


BigQuery is one of the most prominent Big Data Warehouses, which allows you to store, manage, and analyze colossal amounts of data. It comes with a built-in query engine to run SQL queries on the BigQuery data and acquire meaningful insights. However, the BigQuery platform does not have a built-in Data Visualization feature. You can connect BigQuery with external tools such as BigQuery Jupyter Notebook to create effective visualizations for identifying the patterns and trends in the BigQuery data.
Since Python provides you with a vast set of data visualization libraries, you can connect BigQuery with Jupyter Notebook to create interactive dashboards and perform Data Analysis by executing very few lines of Python code. This article will help you connect BigQuery Jupyter Notebook.
Table of Contents
Prerequisites
Fundamental knowledge of Python.
What is BigQuery?

Introduced by Google in 2010, BigQuery is a Cloud-based and serverless Data Warehousing platform that enables you to manage, process, and analyze Big Data. BigQuery is a fully managed, serverless data warehouse that enables fast analysis of terabytes to petabytes of data with SQL queries, without needing infrastructure management. It integrates with Google Cloud Storage for easy bulk data loading and can be accessed via browser, command-line tools, or the BigQuery API. Additionally, BigQuery offers built-in AI and machine learning capabilities, allowing you to create and run models directly using SQL.
Hevo Data helps you directly transfer data from 150+ Data Sources (including 60+ free sources) to BigQuery, Business Intelligence tools, Data Warehouses, or a destination of your choice in a completely hassle-free & automated manner.
Let’s look at some of the salient features of Hevo:
- Fully Managed: Hevo automates data operations with no need for management or maintenance.
- Data Transformation: Easily modify and enrich data before transfer through a simple interface.
- Real-Time Migration: Data is migrated in real-time, always ready for analysis.
- Schema Management: Automatically detects and maps incoming data schema to the destination.
- Scalable & Supported: Hevo scales with built-in integrations and provides live monitoring and 24/5 support.
What is Jupyter Notebook?
Jupyter Notebook was originally developed as a part of the IPython project by Fernando Pérez and Brian Granger in 2014. It is an open-source and web-based computational tool that allows you to write code, create visualizations, render equations, and write narrative texts. With the Jupyter Notebook, you can build end-to-end Machine Learning models and perform Data Cleaning, Transformation, and Visualization. Jupyter Notebook also allows you to perform numerical simulation, statistical modeling, complex scientific compilations, and much more. Since the Jupyter Notebook is a multi-language computation tool, it supports over 40 Programming Languages like Python, R, Julia, Java, and JavaScript.
Steps to Connect BigQuery Jupyter Notebook
Follow the below-mentioned steps to establish a BigQuery Jupyter Notebook connection.
- BigQuery Jupyter Notebook Connection Prerequisites
- Enabling BigQuery API
- Getting an Authentication file
- Connecting BigQuery Jupyter Notebook
BigQuery Jupyter Notebook Connection Prerequisites
To establish a BigQuery Jupyter Notebook connection, you have to satisfy 3 prerequisites.
- You should have an active Google Cloud account and a pre-installed Jupyter Notebook.
- If you have not previously installed Jupyter Notebook, you can download and install the Anaconda distribution package.
- After installing the Anaconda Distribution package, you must launch the Anaconda Navigator to install Jupyter Notebook.
Step 1: Enabling BigQuery API
- You can use BigQuery APIs to extract or fetch data from BigQuery datasets. In other words, the BigQuery service provides you with various REST APIs that are used to collect and transmit data from external data sources.
- You can access BigQuery API using exclusive client libraries like Python, Java, and C++. When your application doesn’t permit you to use other client libraries, you will have to use HTTP commands to manually access the BigQuery API.
- You can enable BigQuery API by using two methods: Using Cloud Console and Cloud Shell.
Method 1: Enabling BigQuery API from Cloud Console
- Visit the Google Cloud Platform.
- Now, go to the navigation menu and click on “APIs & Services“, as shown in the above image.
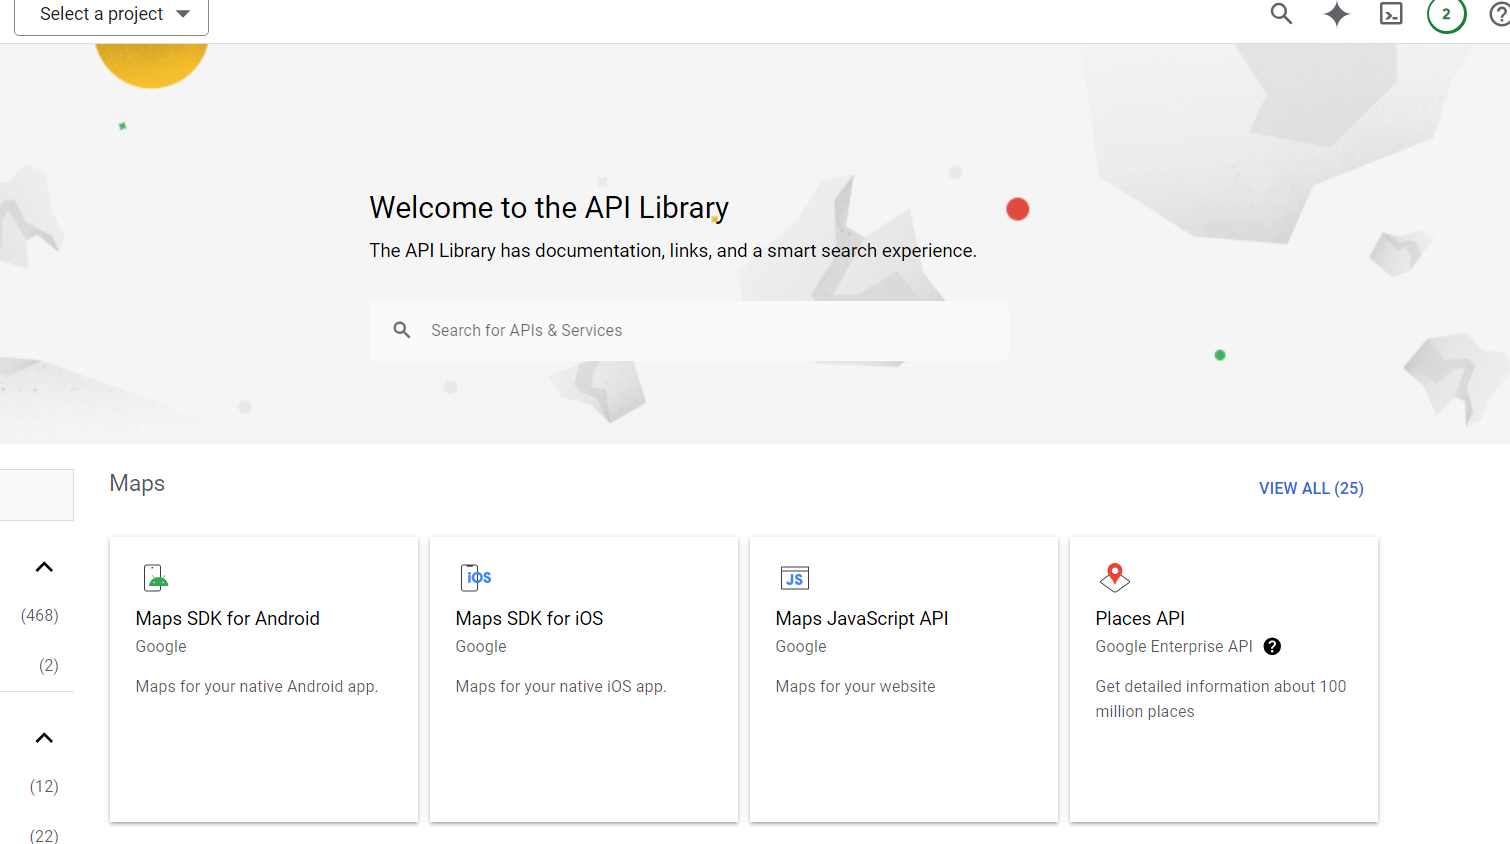
- In the search bar, type “BigQuery API” and press Enter.
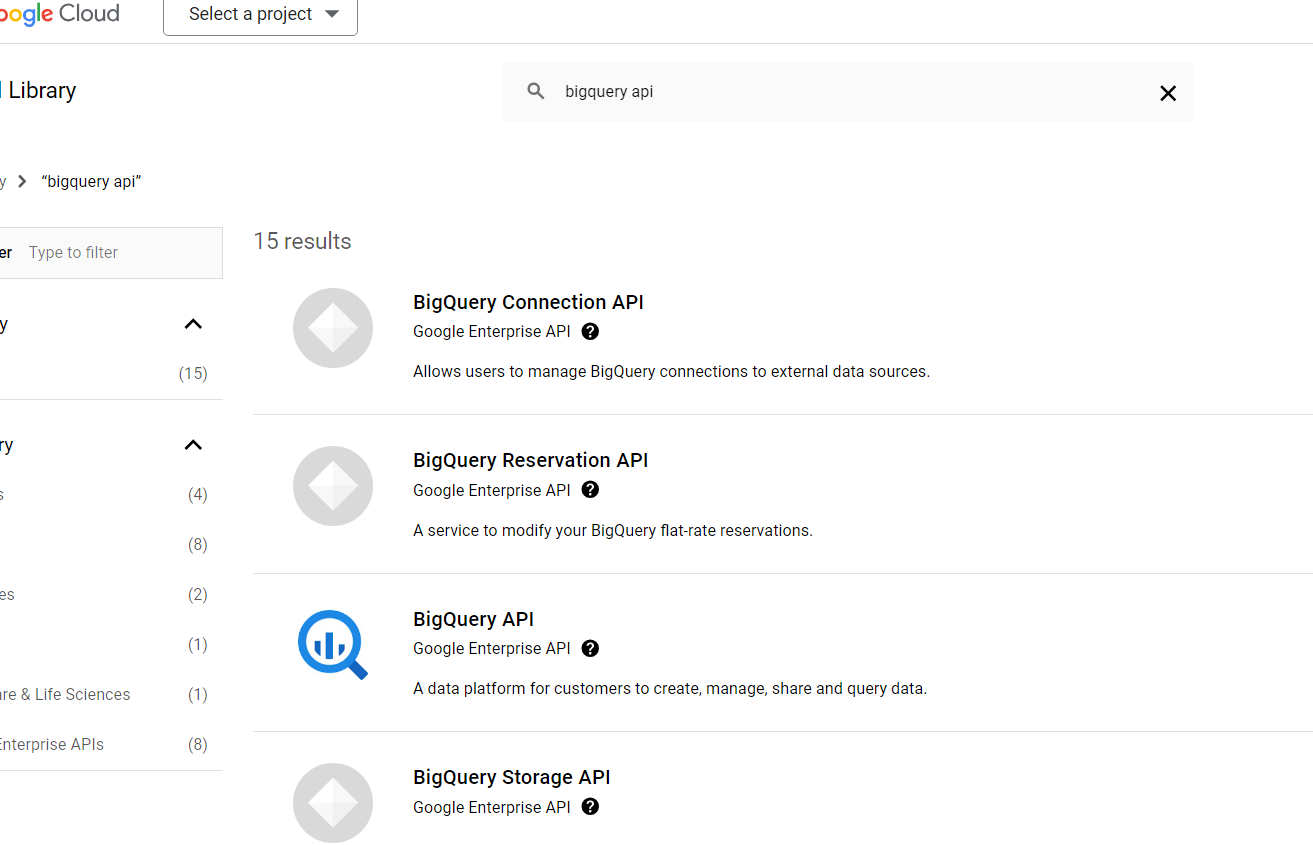
- Now, you are redirected to the new page where you can see various APIs of BigQuery. Click on the “BigQuery API” displayed at the top.
- Then, you are again taken to the new page, where you are prompted to enable the BigQuery API. Click on the “ENABLE” button.
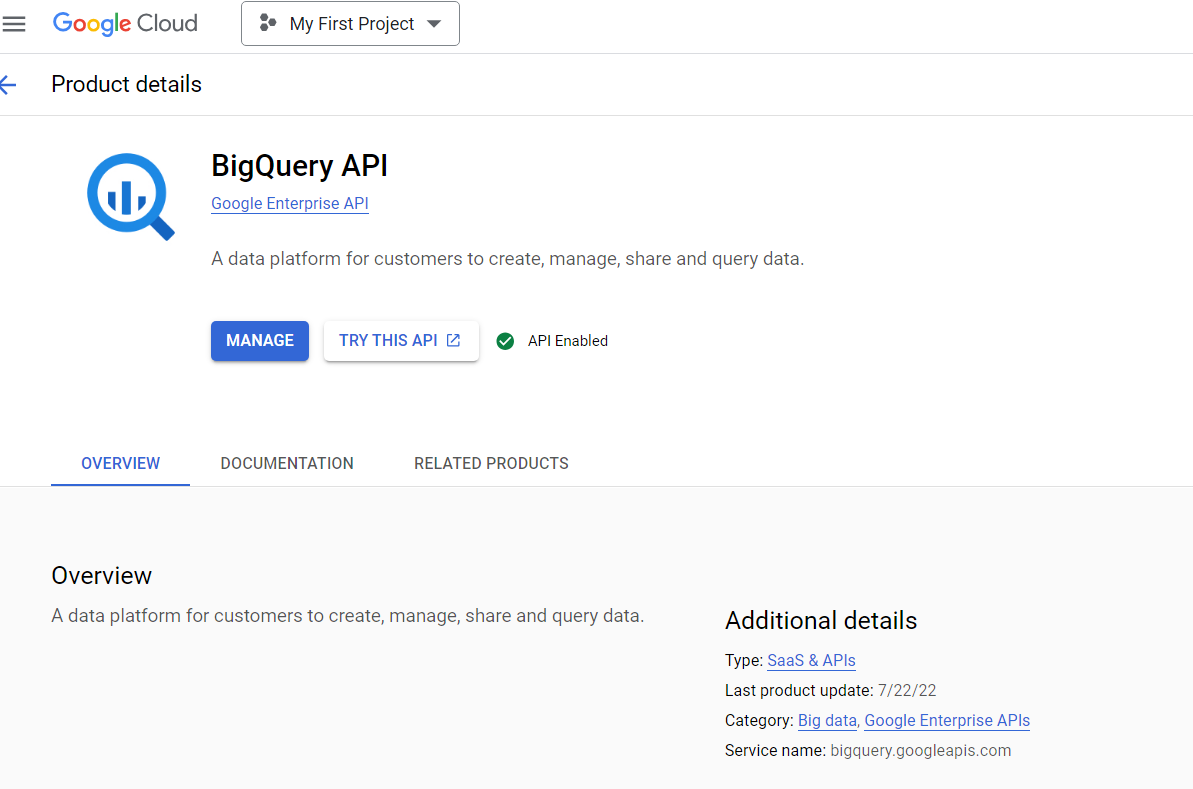
- On successfully enabling the BigQuery API, you can see the “API Enabled” tag, as shown in the above image.
- You can also see the Activation status as “Enabled” in the overview tab of Google Cloud Platform.
Method 2: Enabling BigQuery API from Cloud Shell
- Open your Cloud Shell and execute the following command to enable the BigQuery API.
gcloud services enable bigquery.googleapis.com
- You can check whether the BigQuery API is successfully enabled by executing the command given below.
gcloud services list
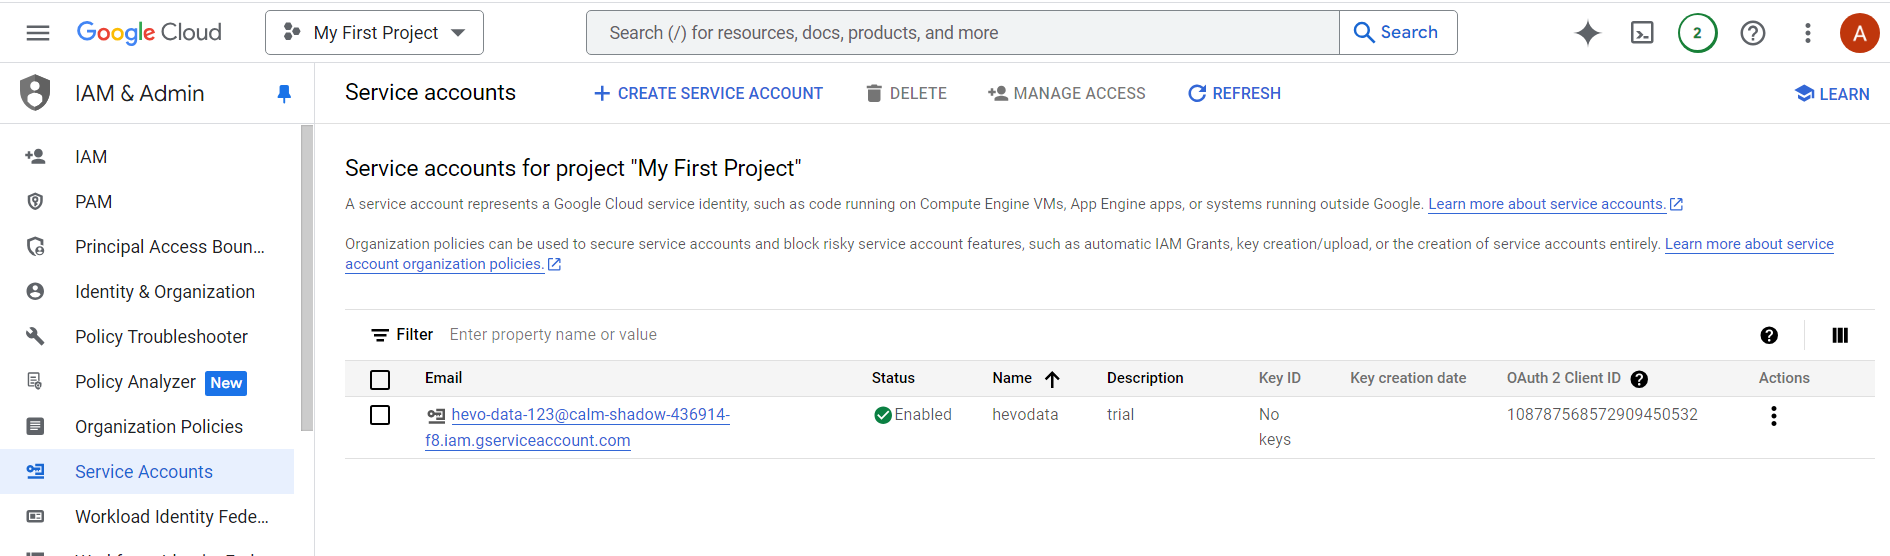
Step 2: Getting an Authentication File
- To access data from BigQuery using the BigQuery API, you have to create a service account and download an authentication file for Jupyter Notebook.
- For creating a new service account, go to the “Create Service Account” page on the Google Cloud Platform.
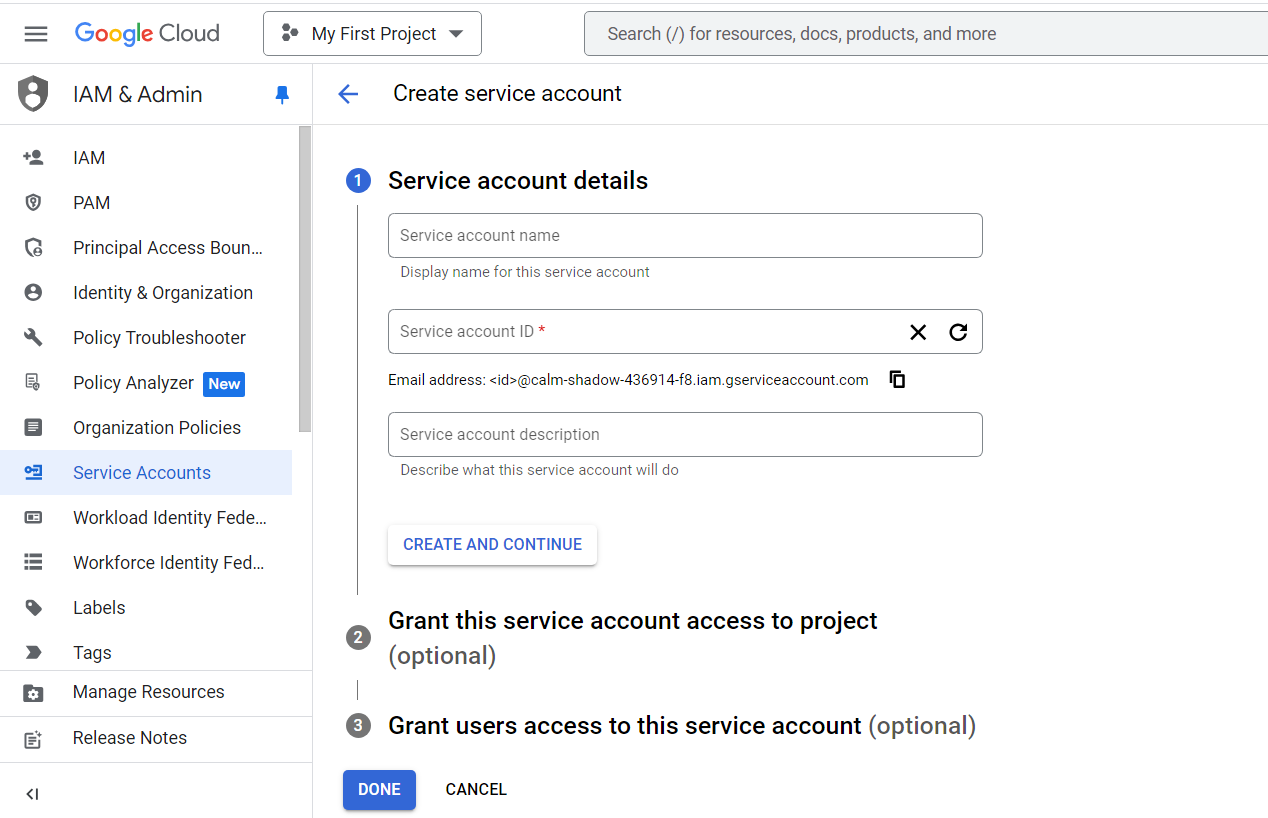
- Now, you are prompted to enter the Service account name, ID, and description. After filling in the details, click on the “Create and Continue” button.
- You can see the newly created service account in the “Credentials” field of the Google Cloud Platform, thereby ensuring the service account is created successfully.
- Now, you have to create an authentication key for the service account. In the “Credentials” field, click the pencil icon beside the newly created service account. Then, click on the “Add Key” button and select the “Create New Key” option.
- In the next step, select the key type as JSON and click on the “Create” button.
- Now, the JSON file with the authentication information is downloaded to your local machine.
Step 3: Connecting BigQuery Jupyter Notebook
- At this stage, you are all set to connect BigQuery Jupyter Notebook. Now, open a command prompt and enter the following code to install the necessary packages for connecting BigQuery with Jupyter Notebook.
pip install google-cloud
pip install google-cloud-bigquery[pandas]
pip install google-cloud-storage- You can also install the packages from Jupyter Notebook by executing the one-line command. Open your Jupyter Notebook and run the following command in the code cell.
pip install --upgrade 'google-cloud-bigquery[bqstorage,pandas]'- Now, you have to load the BigQuery client library by executing the command given below.
%load_ext google.cloud.bigquery- In the further steps, you will be querying the data from the BigQuery public dataset samples.
- Now, execute the following commands to run a SQL query and store results in the form of DataFrame.
%%bigquery
SELECT
    source_year AS year,
    COUNT(is_male) AS birth_count
FROM `bigquery-public-data.samples.natality`
GROUP BY year
ORDER BY year DESC
LIMIT 15- Enter the below command in the next cell block to repeat the same query. However, this time, the query saves the results in the form of a DataFrame to a new variable called “total_births,” which is passed to “%% bigquery” as an argument. The total_births data can also be further analyzed and visualized using Python.
%%bigquery total_births
SELECT
    source_year AS year,
    COUNT(is_male) AS birth_count
FROM `bigquery-public-data.samples.natality`
GROUP BY year
ORDER BY year DESC
LIMIT 15- After executing the above command, a new DataFrame named “total_births” is created to perform data visualization in the next step.
- For performing data visualization, you have to install the Matplotlib library. Execute the following command to install the Matplotlib package.
%matplotlib inline- Now, execute the following code to visualize the “total_births” data in the form of a Bar Chart using the Pandas DataFrame.plot() method.
total_births.plot(kind="bar", x="year", y="birth_count")- You can further analyze the sample data to retrieve the number of births by weekdays.
%%bigquery births_by_weekday
SELECT
    wday,
    SUM(CASE WHEN is_male THEN 1 ELSE 0 END) AS male_births,
    SUM(CASE WHEN is_male THEN 0 ELSE 1 END) AS female_births
FROM `bigquery-public-data.samples.natality`
WHERE wday IS NOT NULL
GROUP BY wday
ORDER BY wday ASC- The above-given query saves the results in the form of DataFrame to a new variable called “births_by_weekday,” which is passed to “%% bigquery” as an argument.
- You can further plot the “births_by_weekday” data using the plot method by executing the code given below.
births_by_weekday.plot(x="wday"- You can also use the BigQuery client library to analyze BigQuery data. Run the following code to import the BigQuery client library for Python.
from google.cloud import bigquery- Then, execute the command given below to initialize the BigQuery client.
client = bigquery.Client()- In the next step, run the following code that includes the client.query() method to retrieve the annual count of plural births by plurality (2 for twins, 3 for triplets, and so on).
sql = """
SELECT
    plurality,
    COUNT(1) AS count,
    year
FROM
    `bigquery-public-data.samples.natality`
WHERE
    NOT IS_NAN(plurality) AND plurality > 1
GROUP BY
    plurality, year
ORDER BY
    count DESC
"""
df = client.query(sql).to_dataframe()
df.head()- Then, convert the result set “df” to a pivot table by executing the following command.
pivot_table = df.pivot(index="year",
columns="plurality", values="count")- Now, run the code given below to create a stacked bar according to the count of plural births over time.
pivot_table.plot(kind="bar",
stacked=True, figsize=(15, 7))
- Now, run the following query to retrieve the count of births by the number of gestation weeks using the client.query()method.
sql = """
SELECT
    gestation_weeks,
    COUNT(1) AS count
FROM
    `bigquery-public-data.samples.natality`
WHERE
    NOT IS_NAN(gestation_weeks) AND gestation_weeks <> 99
GROUP BY
    gestation_weeks
ORDER BY
    gestation_weeks
"""
df = client.query(sql).to_dataframe()- Then, plot the output of the above code by running the following code snippets.
ax = df.plot(kind="bar", x="gestation_weeks", y="count", figsize=(15, 7))
ax.set_title("Count of Births by Gestation Weeks")
ax.set_xlabel("Gestation Weeks")
ax.set_ylabel("Count")
On executing the above-mentioned steps, you have successfully connected BigQuery Jupyter Notebook and also performed Data Analysis and visualization using the BigQuery APIs and Client Libraries.
Conclusion
In this article, you learned about BigQuery, Jupyter Notebook, how to enable BigQuery API and connect it to Jupyter Notebook. This article only focused on connecting BigQuery Jupyter Notebook via client libraries. However, you can also connect any external database servers like Oracle, SQL Server, and MySQL with Jupyter Notebook by using the respective ODBC drivers or connectors of the Database.
Find out how to integrate BigQuery with Python to improve your data workflows. Access our detailed guide for a smooth and effective connection setup.
BigQuery supports many more Data Sources and allows loading data from other traditional and Cloud-based applications, SaaSs, CRMs, BI tools, etc. You may require a Data Integration tool to do extract and load data from multiple sources into Snowflake, and this is where Hevo comes in.
Hevo Data with its strong integration with 150+ Sources allows you to not only export data from sources & load data in the destinations such as BigQuery, but also transform & enrich your data, & make it analysis-ready so that you can focus only on your key business needs and perform insightful analysis using BI tools.
Give Hevo Data a try with a 14-day free trial today. Hevo offers plans & pricing for different use cases and business needs, check them out!
Share your experience of working with BigQuery Jupyter Notebook in the comments section below.
FAQs
1. How to use Google BigQuery in Jupyter Notebook?
To use Google BigQuery in Jupyter Notebook, install the google-cloud-bigquery Python library using pip. Authenticate your Google Cloud account, then use the BigQuery client to run SQL queries and fetch data directly in the notebook. You can also use pandas-gbq to load query results into pandas DataFrames for analysis.
2. Can Python connect to BigQuery?
Yes, Python can connect to BigQuery using the google-cloud-bigquery library. This allows you to run queries, manage datasets, and retrieve results directly from BigQuery in your Python environment.
3. Can SQL be done in Jupyter Notebook?
Yes, SQL can be executed in Jupyter Notebook using libraries like ipython-sql or database-specific connectors like sqlite3 or sqlalchemy. These allow you to write and run SQL queries directly within the notebook for data analysis.
4. How to run Jupyter Notebook in GCP?
To run Jupyter Notebook in Google Cloud Platform (GCP), you can use AI Platform Notebooks or set up a Compute Engine VM with Jupyter installed. After setting up, access the notebook through your browser by connecting to the VM’s external IP.


Share it with your connections.
-
 Share To X
-
 Share To LinkedIn
-
 Share To Facebook
-
 Copy Link


