In a project-centric organization, managing simultaneous projects becomes very difficult. However, delivering projects to stakeholders timely can benefit a business in the long run with more revenue and clients. As a result, a Project Management tool to monitor multi-faceted projects is gaining popularity among decision-makers. Trello is one such popular tool offering various features and comes with a Gantt chart to prepare a project schedule and distribute tasks accordingly. It also provides real-time updates to track progress and automation to deal with project work swiftly.
Along with Trello software, this article provides an overview of the Trello Gantt Chart, its features for Project Management, and more. You will also gain an understanding of different Power-Ups available to create Gantt charts in Trello and the steps to create a Gantt chart using TeamGantt. Read along to learn more about Trello Gantt Charts.
Simplify your ETL processes within Trello using Hevo’s no-code platform, perfect for automating complex data workflows. Hevo provides an intuitive interface for effortless data extraction, transformation, and loading—no manual coding needed!
- Easily automate ETL pipelines directly from Trello
- Enjoy flexible, real-time data transformations
- Hevo’s robust infrastructure ensures reliable data transfer with zero data loss.
See why Hevo is rated 4.7 on Capterra for data integration excellence.
Get Started with Hevo for FreeTable of Contents
Prerequisites
- An active Trello account.
Introduction to Trello
Trello is a Web-based application used to organize projects in a Kanban-style. With Trello, the details of the entire work are displayed at-a-glance to bring the visual perspective of project progress. It also provides seamless collaboration among team members and real-time sync for improving productivity. Released in 2011 at the TechCrunch event by Joel Spolsky (founder of Fog Creek), Trello is a subsidiary of Atlassian. The name Trello is derived from the word Trellis, resembling an architectural structure.
Key Features of Trello
With its dazzling visual experience and adaptable interface, Trello is an incredible Project Management tool. It is useful, especially when team members are scattered across remote locations.
Below are a few benefits and features of Trello:
- Organized System: This software comprises a unique Board and Card system designed in a user-friendly manner. A project can consist of many Boards, and each Board consists of Cards usually resembling tasks of a particular phase of the project. Trello also provides a different view to suit the type of requirement during Project Management.
- Power-Ups: With Trello, Power-Ups are used to integrate with various tools to simplify the management of information and manual tasks. Trello includes a wide range of Power-Ups that are available to suit diverse team’s workflow, from reporting to custom integration like Confluence, Evernote, and Slack.
- Automation: Trello helps users harness the power of Automation in Task Management with natural language commands by a feature called Butler. It reduces the number of tedious tasks in a few clicks (no code automation), allowing teams to focus on priority work.
- Sharing Details: Cards play an important role in a Trello board. Project tasks embedded in Cards can be customized before assigning them to teammates. Some tasks require detailed information; in such cases, Cards facilitate File Attachments, Checklists, and Comments to share details precisely. With Trello Cards, one can also share crucial details like Assign Tasks, Set Deadlines, Track Feedback, and Connect with different apps.

For further information on Trello, click here to check out their official website.
Introduction to Gantt Charts

Organizations use Trello as a Project management tool. However, with development in Cloud Computing, Project Planning, and Scheduling can be visualized with Gantt charts. Gantt chart was designed in 1910 by ‘Henry Gantt’ to obtain a birds-eye view of various tasks involved in a project.
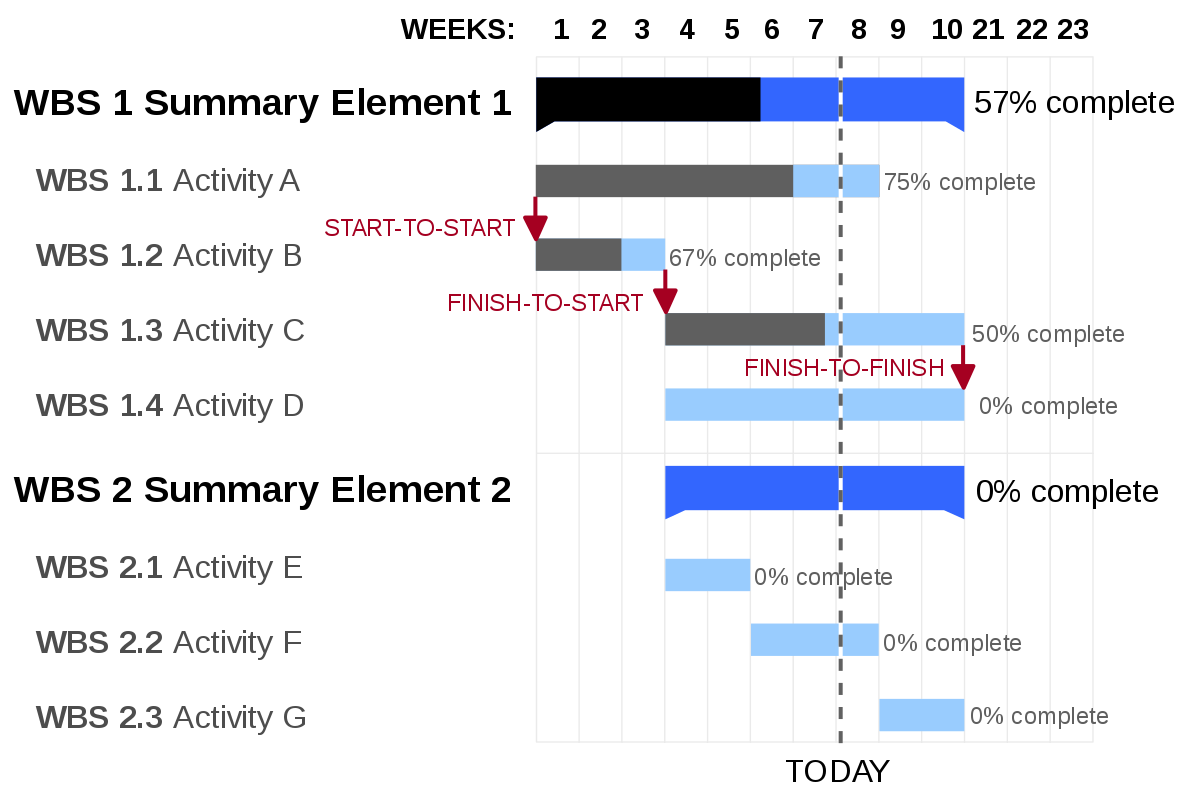
Gantt Chart comprises horizontal bars, where the length of a bar represents the amount of time allotted to complete a task. Due to its effectiveness in Project Management, almost every business considers Gantt Charts during meetings and discussions with stakeholders. In the later section of this article, you will learn about the steps involved in creating Trello Gantt Charts.
Key Features of Gantt Charts
- Real-time updates: Gantt Chart allows users to obtain the real-time status of tasks to stay abreast with the progress. Milestones in the Gantt Chart mark the completion of a significant part of a project. As modern Gantt Charts update swiftly, it allows progress in tasks to be reflected in real-time to get an overview of project development.
- Connect Dependencies: Some tasks depend on prior tasks, thereby creating dependencies among several tasks. Modern Gantt charts efficiently manage relationships between tasks by automatically reflecting changes in the project timeline.
- Manage Workforce: Often work is diverted to teams already working on other projects. It brings unnecessary burdens, reducing team performance. However, Gantt Charts have improvised workforce management by indicating a metric of members assigned with a number of tasks to distribute work evenly.
4 Key Power-Ups Used for Trello Gantt Charts
Power-Ups predominantly have helped Trello become popular among the other tools. With Power-Ups, additional features can be integrated to give additional functionalities in a Trello Board. To build a Trello Gantt Chart, below are a few Power-Ups available in Trello:
1) Planyway
Planyway helps in glancing at the entire work of an organization. It visualizes plans and breaks big tasks into simple steps by building a team schedule. This software also assists in balancing workloads mapping all tasks and subtasks allotted on a timeline view. One can also create a roadmap and set dependencies to mark the prior work importance before starting a new work. Planyway also improves productivity by estimating the task completion time, with Time Tracking feature managers deep-dive to find prolificity of team members.
2) TeamGantt

TeamGantt is a Project Scheduling software used to make Trello Gantt Charts online for decision-makers to get a pulse of a project. With its collaboration feature, one can invite team members or clients to plan, manage, or schedule a project. As it comes with a drag and drop interface, building Trello Gantt Charts using TeamGantt requires no training. All the necessary files, documents related to tasks are made available in one place, thus avoiding unnecessary emails and discussions. TeamGantt is mobile, and any change in progress or comments gets updated on other devices. However, a user can even import these timelines as CSV and print PDF to pitch meetings’ plans.
3) BigPicture
BigPicture is a Project Portfolio Management (PPM) Power-Up tool in Trello. It helps in Planning Tasks, Automating Work, and Tracking Project Progress. It comes with a Work Breakdown Structure (WBS) panel while working on Gantt Charts to distribute tasks evenly. As most projects may come with teams with various methodologies, BigGantt features all the Milestones, Auto Schedules, and Baselines with critical paths for project completion.
4) Projects by Placker
Placker offers flexible Project Management and an extensive set of features for making a Gantt Chart. Placker and Trello Board are bidirectionally connected. Any changes in the former reflect the latter. It also helps users to effectively plan and track Cards on single or multiple Boards.
Steps to Create Trello Gantt Charts Using TeamGantt
Trello Boards consist of Cards arranged in Kanban style. With TeamGantt Power-Up, one can easily synchronize Trello Boards manually or automatically to create Trello Gantt Charts. Below are the steps to create a Trello Gantt Chart using TeamGantt:
- Step 1: Search for TeamGantt in the Power-Up section of the Trello account, and click on the ‘Add Power-Up’ button. One can also add power-up from the ‘show menu option’ on the Trello board.
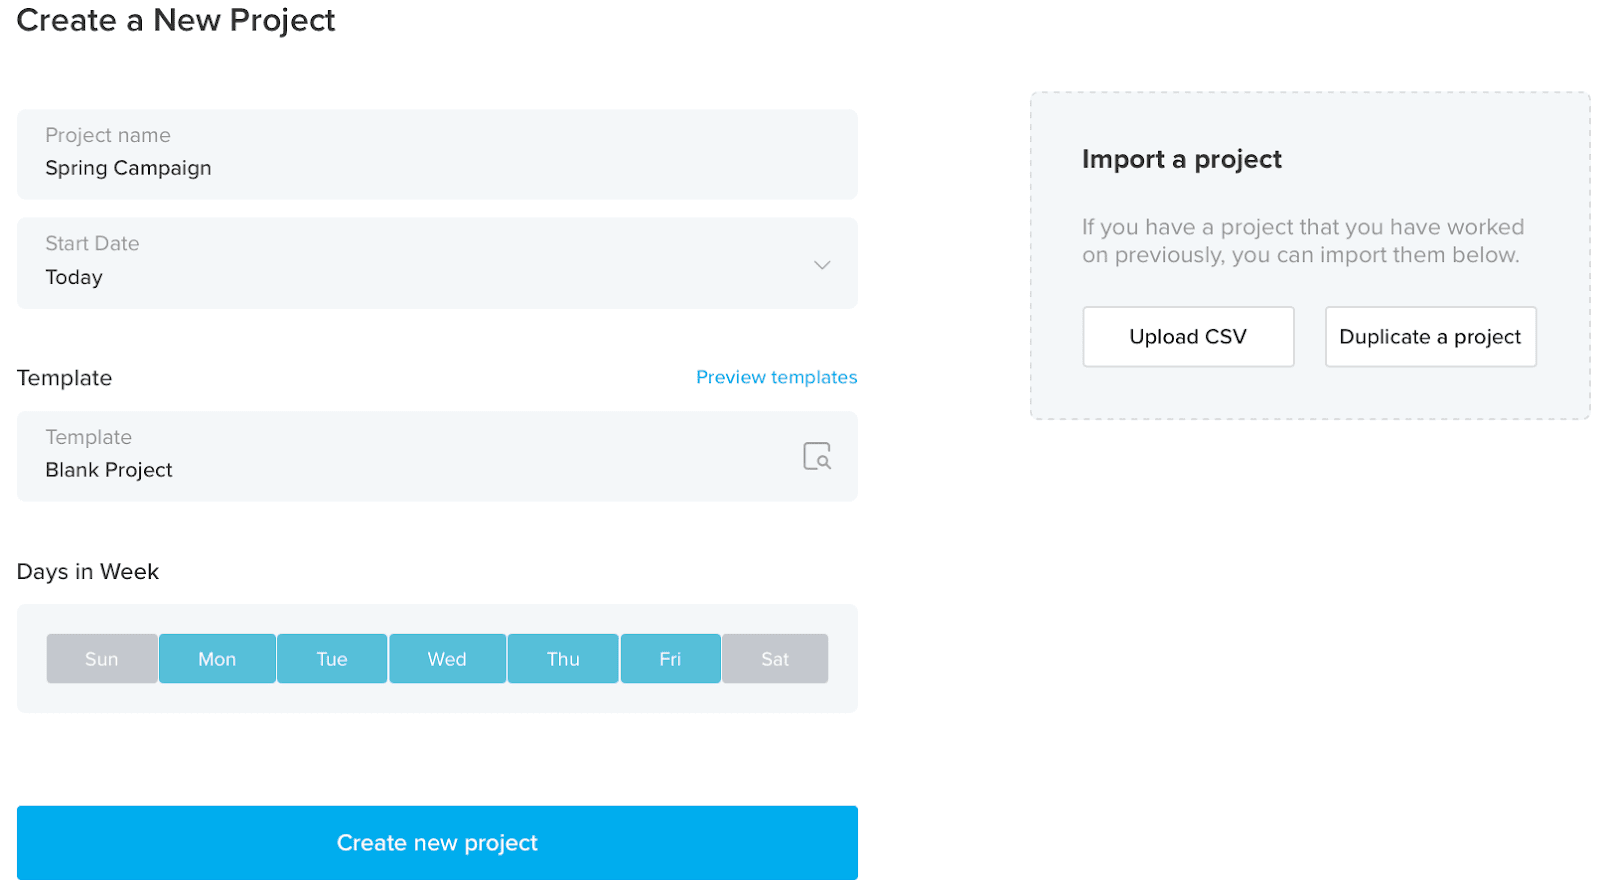
- Step 2: TeamGantt plugin can prompt users to make an account before it gets added automatically in the Trello Board. To connect a Trello Board, a user needs to create a blank project in TeamGantt and click on ‘View in Gantt chart‘.

- Step 3: All the project tasks are arranged in a list form, and the schedule of the tasks can be added on selecting a particular task in the Gantt view of the TeamGantt Board (left side).

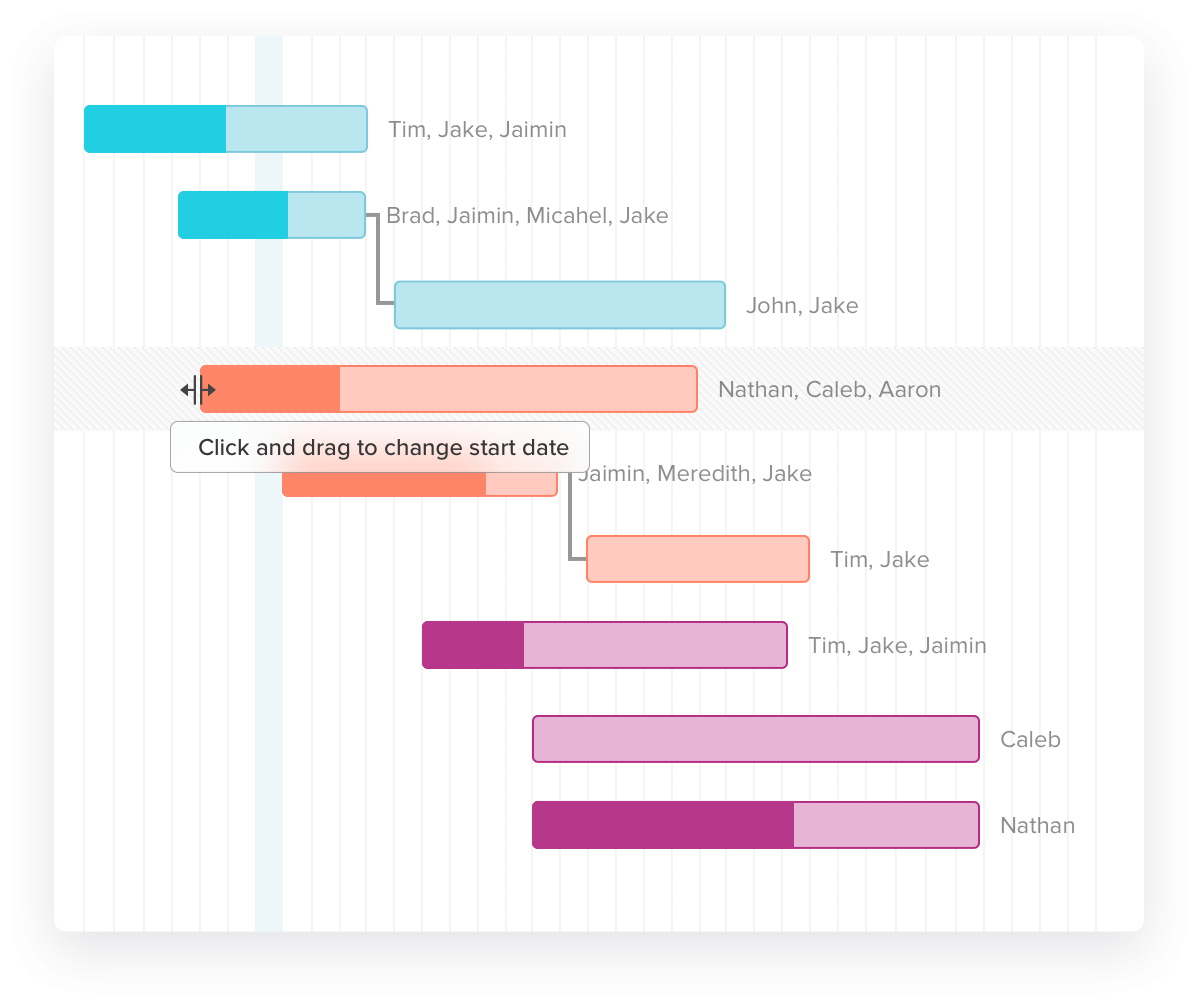
- Step 4: Hover the mouse on the Board to create a Trello Gantt chart (default of one day), and this can be later extended by dragging either side to suit the requirements of tasks.

- Step 5: Upon hovering over a particular task, task progress can be updated by clicking the ‘Edit Task’ option. A dependency can also be added by clicking a dot and connecting it to the dependent task.
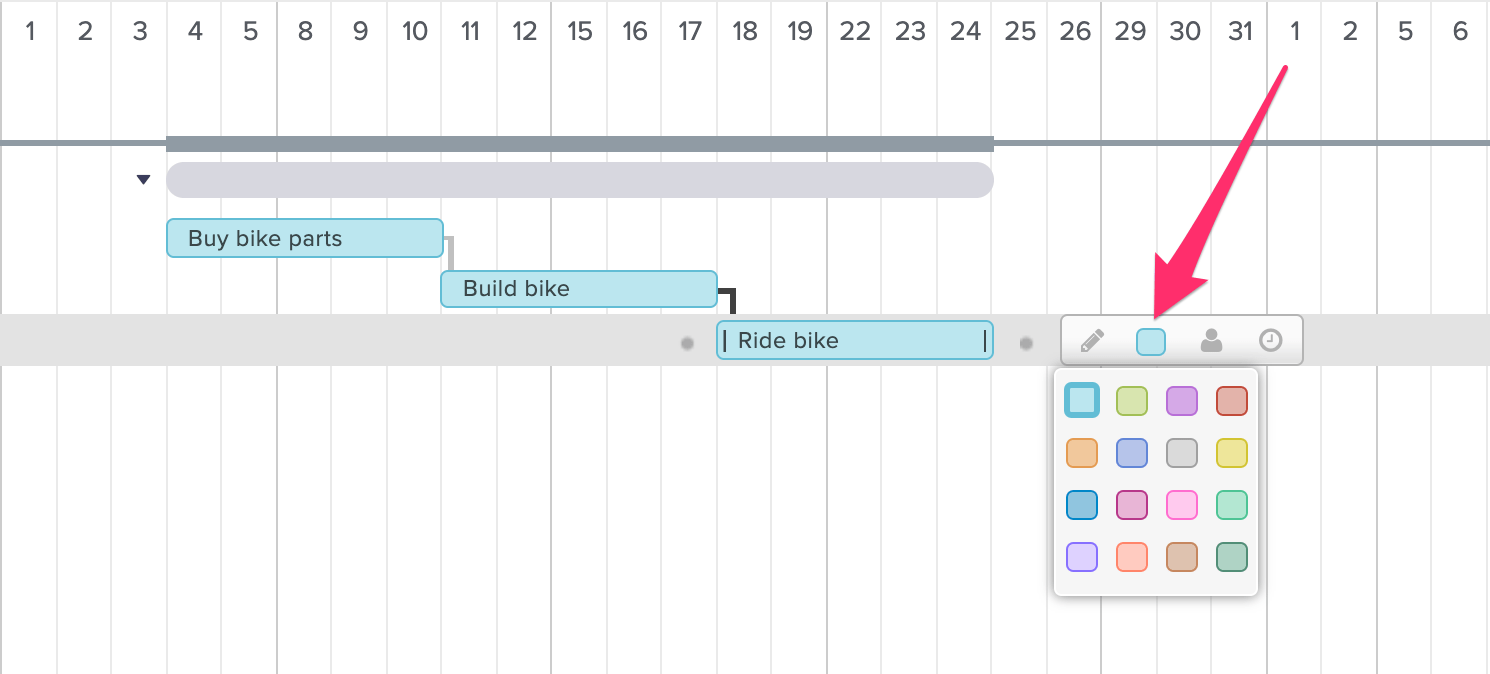
- Step 6: A task in TeamGantt can be assigned a resource by selecting the person logo (last option) and selecting relevant names for a task. The color of a task can also be customized by selecting the blue square box.

Advantages of Trello Gantt Charts
Advancement in Cloud Technology has made this Chart become more flexible, and below are a few benefits exhibited by Trello Gantt Charts:
- Visualize Project: A schedule can be prepared using a simple table. However, Trello Gantt charts visualize the entire project to give better insight. It also visualizes some additional features like Assigned Tasks and Added Dependencies.
- Productive Work: Certain tasks have high priority, team collaboration becomes necessary to extensively solve them. As the tasks are to be completed within a stipulated time, a Trello Gantt chart provides high-level visibility to increase productivity.
- Resource Management: A project, once scheduled, requires discussion among team members. All necessary files and documents during the meeting are shared as email or attachments in other software. Such practice often leads to data duplication or data loss. However, modern Trello Gantt charts have a separate space to store all relevant data like discussions and documents to decrease complexity.
Learn More About:
Setting up Trello Roadmap Simplified
Conclusion
Organizations handle multiple projects with Project Management tools like Trello, and Trello Gantt Chart plays a vital role in scheduling and planning projects. TeamGantt assists teams in Tracking Progress, Creating Milestones, and Distributing Work. As a result, decision-makers get clarity of current work and set a plan of action for the next phase of a project. In this article, you learned about Trello and the salient features that it offers. You also learned about the steps required to create Trello Gantt Charts in a seamless manner.
With your Trello Gantt Chart now ready, you can analyze your progress and project success with ease. However, to carry out an in-depth analysis of your project, you would often need to extract data from multiple sources to have all insights. Integrating and analyzing your data from a diverse set of data sources can be challenging and this is where Hevo Data comes into the picture.
You can try Hevo’s 14-day free trial. You can also have a look at the unbeatable pricing that will help you choose the right plan for your business needs!
Share your experience of building Trello Gantt Charts. Tell us in the comments below!
FAQs
1. Does Trello have a Gantt chart feature?
Trello does not have a built-in Gantt chart feature, but you can integrate Gantt chart functionality using third-party Power-Ups like Planyway, BigPicture, or TeamGantt. These tools enable timeline views and project scheduling within Trello.
2. Does Trello have a project management tool?
Trello itself is a lightweight project management tool. It uses boards, lists, and cards for organizing tasks, tracking progress, and collaborating with teams. For advanced project management features, integrations with tools like Jira, Slack, or Trello Power-Ups can be used.
3. Do project managers still use Gantt charts?
Yes, project managers still use Gantt charts, especially for projects requiring detailed planning and scheduling. Gantt charts provide a visual timeline of tasks, dependencies, and deadlines, making them useful for monitoring progress in complex projects. However, for agile or flexible methodologies, tools like Kanban (e.g., Trello) are often preferred.


