


According to a report, over 97 percent of the fortune 500 companies use Power BI as their business analytics tool to process, manage, and analyze data for making data-driven decisions.
While using Power BI for visualizing data to get business insights, users often undergo the process of data processing and data filtering, thereby getting appropriate data for creating dashboards. To help users perform complex operations with datasets, Power BI provides DAX. It allows users to carry out custom calculations and create calculated fields by utilizing high-level expressions, logical functions, and mathematical equations.
This article will talk about Power BI, DAX functions, and four types of DAX functions: DAX COUNT, DAX CALENDAR, DAX DATE, and DAX HASONEVALUE.
Table of Contents
Prerequisites
A fundamental understanding of data analysis and data filtering. And a basic understanding of Power BI DAX COUNT, DAX CALENDAR, DAX DATE, and DAX HASONEVALUE.
What is Power BI?

Introduced by Microsoft in 2010, Power BI is one of the most popular business intelligence tools mainly used for performing data visualizations to make data-driven decisions. In other words, Power BI allows you to create interactive dashboards and reports based on the given input dataset.
Power BI has an easy-to-learn interface through which even non-technical users can easily grasp the concepts of various graphs and widgets. It can also connect with external data sources like Google Analytics, MailChimp, and Azure SQL Database to extract data from the respective authorities for effectively creating dashboards and reports.
Because of such user-friendly capabilities and high-end functionalities, Power BI is being used by the most prominent companies like Apple, Toyota, Dell, and Walmart for making business decisions.
What is DAX Function?
DAX (DATA ANALYSIS EXPRESSIONS) is a client library or tool that comprises various functions and operations for implementing custom calculations in Power BI. It is also called a function language since the customizable parameters are defined inside a specific DAX function. With DAX functions, you can solve high-end calculations, data analysis problems, and complex Power BI tasks.
Each DAX function has a specific or unique formula based on the aggregate operations that users are about to perform in Power BI. The formulas in DAX are very similar to formulas in Excel. For performing a specific function in DAX, you just need to type an equal sign, followed by a function name or expression.
Then, inside the function, you have to enter the required values or arguments by following the syntax of the specific DAX function. DAX has a number of functions for working with strings, performing calculations with dates and times, and creating conditional values, all of which are very similar to Excel functions.
Hevo Data, a No-code Data Pipeline helps to load data from any data source such as Power BI, Databases, SaaS applications, Cloud Storage, SDKs, and Streaming Services and simplifies the ETL process. It supports 150+ data sources and is a 3-step process by just selecting the data source, providing valid credentials, and choosing the destination.
Check out why Hevo is the Best:
- Secure: Hevo has a fault-tolerant architecture that ensures that the data is handled in a secure, consistent manner with zero data loss.
- Schema Management: Hevo takes away the tedious task of schema management & automatically detects the schema of incoming data and maps it to the destination schema.
- Minimal Learning: Hevo, with its simple and interactive UI, is extremely simple for new customers to work on and perform operations.
Types of DAX Functions
- DAX Count
- DAX COUNTA
- DAX COUNTX
- DAX COUNTAX
- DAX DISTINCTCOUNT
- DAX COUNTBLANK
- DAX COUNTROWS
- DAX Calendar
- DAX Date
- DAX Hasonevalue
1. DAX COUNT
- The DAX PowerBI COUNT function is used to count the total number of cells that contain value entities such as integer, whole number, string, and character. In other words, the DAX COUNT function returns the number of cells containing non-blank values, excluding all blank cells.
- The DAX Power BI COUNT function can count cells with repeated values. It can also count dates since Power BI considers dates as a number.
- The DAX COUNT Power BI function does not count the number of boolean function data such as True or False that appeared in the given table. Instead, you can include boolean function alternatives like categorical data or numerical value (0/1) for counting the total number of boolean data in the dataset.
- For counting the number of boolean data in its raw form, you can use the DAX COUNT function.
- The DAX COUNT in Power BI function will not be supported in DirectQuery mode when used in calculated columns or row-level security (RLS) rules for restricting data access for different users.
DAX COUNT Function Syntax
COUNT(<column>)- In the above syntax, DAX COUNT is the function name, and column is the name of the column whose values you need to count using the DAX COUNT function.
Example
Below given is the sample command that shows how to use the COUNT function for counting the number of non-blank values in the given column.
Number of sales id = COUNT(DATA1[Sales ID])In the above example, the Number of sales id is the name you give to the output tile, and DATA1 is the name of the table. Then, Sales ID is the column name of the given table, where DATA1[Sales ID] combinedly indicates that the DAX COUNT function is used for counting the number of non-blank values in the Sales ID column present in the DATA1 table.
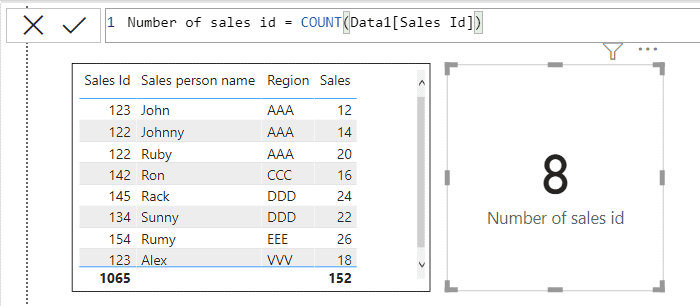
As shown in the above image, the DAX COUNT function returns the total number of values present in the Sales ID column.
2. DAX COUNTA
The COUNT and COUNTA functions are very similar, the only difference is that the COUNTA function can also count Boolean values (True or False), whereas the COUNT function would return an error. Neither function counts only non-empty cells and does not react to repeated values in the cells.
DAX COUNTA Function Syntax
COUNTA(<column>)- In the above syntax, DAX COUNTA is the function name, and column is the name of the column containing the values to be counted.
Example: Below is a sample command that shows how to use the COUNTA function to count the number of blank values in a given column.

COUNTA_Output = COUNTA(SampleTable[Amount])
Output = 3
3. DAX COUNTX
The COUNTX function counts the number of non-blank rows when evaluating an expression in a table.
DAX COUNTX Function Syntax
COUNTX (<table>,<expression> ) Example: Column = COUNTX(FILTER(‘Customer Details’,’Customer Details’[Customer Index] > 100), ‘Customer Details’[Customer Index])

This formula uses a filter expression to retrieve only the rows in the CustomerDetails table that meet the condition of Customer Index> 100 and counts the rows with the CustomerIndex in the resulting table.
Note: This function is not applicable to boolean values.
4. DAX COUNTAX
The COUNTAX function counts non-empty results when evaluating the results of an expression applied on a table. It works like the COUNTA function, but it is used to iterate over the rows in the table and count the rows that result in the specified expression results in non-empty.
DAX COUNTAX Function Syntax
COUNTAX(<table>,<expression>)In the above syntax, “table” represents the table containing the rows for which the expression will be evaluated.
Example: The following example uses the table resulting from filtering the reseller table with Status = “Active”, to count the number of non-blank rows in the Phone column.
COUNTAX(FILTER(‘Reseller’,[Status]=”Active”),[Phone])
5. DAX DISTINCTCOUNT
The DISTINCTCOUNT function only returns the number of unique values that exist in a column.
DAX DISTINCTCOUNT Function Syntax
DISTINCTCOUNT(<column>)Example: CLO = DISTINCTCOUNT(Sheet1[SALARY])

In the image above it’s very clear that a unique count can give an incorrect output if a null value is present in the column. This function takes “10000”, “20000”, “45000”, and null as separate values and provides the output as 4. Therefore, to remove the null value, you need to use the DISTINCTCOUNTNOBLANK function.
6. DAX COUNTBLANK
The COUNTBLANKS() function helps to calculate the number of blank spaces present in a column.
DAX COUNTBLANK Function Syntax
COUNTBLANK(<column>)Example: To count the number of blanks present in the SalesDate column of the above-mentioned database, you can use the below command:
COUNTBLANK = COUNTBLANK(SampleTable[SalesDate])
Output = 1
7. DAX COUNTROWS
The COUNTROWS function returns the count of rows in the specified table or table defined by the expression.
DAX COUNTROWS Function Syntax
COUNTROWS(<table>)Here “table” is the name of the table that contains the rows to count or an expression that returns the table. It is an optional parameter. If not specified, by default function takes the output table of the current expression as an argument.
Example: The following example shows how to count the number of rows in the table Data1.

8. DAX Calendar
- The CALENDAR function is one of the “date & time” functions of DAX, which allows you to get a calendar table with a continuous set of dates based on the given start date and end date. In other words, the CALENDAR function returns a table named “Date” with a single column having the respective set of calendar values according to the specified date range.
- A range of continuous calendar values returned from the CALENDAR function is inclusive of both starting date and ending date.
- The CALENDAR function returns an error when the starting date is greater than the ending date in the specified date range.
Syntax
CALENDAR(<start_date>, <end_date>) - The syntax of the CALENDAR function consists of only two parameters, such as start date and end date, which indicate the beginning and ending date of your preferred time range, respectively. The above command returns a table with one column containing all the dates between the given start date and end date.
Example: For getting the contiguous set of dates between 22-03-2022 and 22-04-2022, you can execute the command given below.
Date = CALENDAR (DATE (2022,03,22), DATE (2022,04,22))- You should always enter the start date and end date in the order of year, month, and date, as shown in the above example. After executing the above command, you will get a new column containing a whole set of dates between the specified range.
- You can also specify certain conditions inside the CALENDAR function, and it is not always mandatory to enter static or raw dates.
- The below-given is another example of how to use specific calculated values inside the CALENDAR function.
Date = CALENDAR(TODAY() - 365, TODAY() + 365)The command above will return all dates from a year before (TODAY() – 365) the current date to a year after the current date (TODAY() + 365).
9. DAX DATE
The DATE function allows you to get the specified date value in the DateTime format, i.e., “mm/dd/yyyy hh:mm:ss.” The DATE function generates a DateTime value based on the numbers that are passed in as arguments.
Syntax
DATE (<year>, <month>, <day>)- The syntax of the DATE function consists of three parameters, such as year, month, and day, which indicate the specific entities of your preferred date.
- There are certain rules to specify a value to the three parameters such as year, month, day in the DATE function.
Year
- The number should always represent the year and be in four digits.
- In the DATE function, the year argument is interpreted according to the date system used in your local machine.
- The function returns a “#VALUE!” error for values greater than 9999 or less than zero (negative values). When the value of the year is between 0 and 1899, the final value is calculated by adding the year value to 1900.
- For example, when we enter 22 for 2022, the DATE function returns 1922 as the year value, which is incorrect. To avoid such unexpected results, use four digits for the year argument whenever possible.
Month
- The month parameter only supports values ranging from 1 to 12. In other words, a month of the year is represented by a number between 1 and 12. January is represented by 1, February by 2, and so on until December is represented by 12.
- If you enter a number greater than 12, you will get an incorrect value or date as a result. For example, if you type DATE (2008, 18, 1) into the function, it will return a DateTime value of June 1st, 2009, i.e., “2009/6/1” because 18 months are added to the beginning of the year 2008, thereby yielding a value of June 1, 2009.
Day
- The day parameter supports values ranging from 1 to 31, representing the days of the month.
- If you enter a value greater than the given range, you will get inappropriate results. For example, When you type “DATE (2008, 3, 32),” for example, the DATE function returns a DateTime value equivalent to April 1st, “2008, i.e., 2008/4/1” since 32 days are added to the beginning of March, which produces the date value as April 1st of 2008.
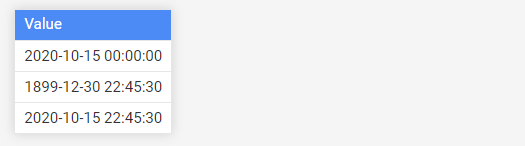
Example: When you enter the DATE function as DATE ( 2020, 10, 15 ), the output will be, “2020-10-15 00:00:00”.
You can also include the preferred time range to the DATE function by providing the TIME function.
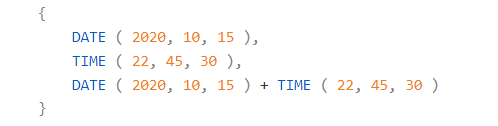
On executing the functions given above, you will get the output, as shown below.
10. DAX HASONEVALUE
The HASONEVALUE value function returns true if the specified column gives you the output based on only one value or entity. In contrast, when the specified column returns results based on more than one value or entity, the HASONEVALUE function will return false.
Syntax
HASONEVALUE(<columnName>)In the above syntax, “columnName” is the name of the column for which you are about to apply the HASONEVALUE function.
Example

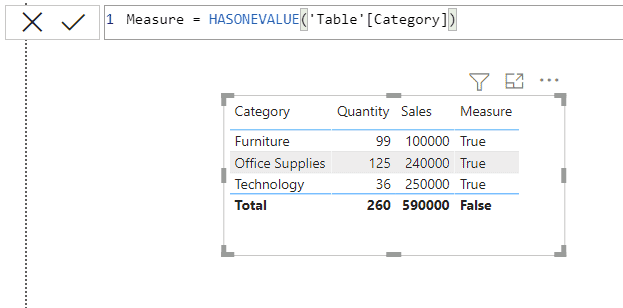
In the above example, the measured field returns “True” when the Sales is based on only one column. For instance, when you sum the one single column named “Furniture,” you will get the sales value as 100000; similarly, the Measure column returns True. This is because the sales calculation is based on only one entity called Furniture. For the “Total” category, the measure is returned as False since the total is not calculated based on one entity, but is calculated from three entities Furniture, Office Supplies, and Technology.
Advantages of Using DAX function
- Learning DAX opens up a new world of Power BI. The main function of unlocking is the ability to dynamically select, combine, filter, etc. data. This means that dashboards can take input from users and use it to dynamically create and generate calculated columns, metrics, and tables.
- With the better use of DAX, you can design your dashboard smartly and efficiently. DAX allows you to create smarter calculated columns and metrics that dashboards can use to limit the data they need to capture and visualize. Some DAX expressions can test data engine limits, but well-written expressions can speed things up and thereby limit resource usage.
- When you learn DAX, newly discovered skills do not have to be limited to the PowerBI environment. DAX can be used with Microsoft products in tabular formats, such as:
- Power BI
- Microsoft Analysis Services
- Microsoft Power Pivot for Excel
- Needless to say, the DAX syntax is also very similar to Excel formulas, so you can transfer your knowledge to this good old and widely used software.
- DAX is based on a system of various nested filtering contexts where performance is important, which changes the way you think about filtering tables and data. In short, learning DAX will improve your thinking about how to efficiently merge, filter, select, and manipulate data.
Conclusion
In this article, you learned about Power BI, DAX functions, and four types of DAX functions with their syntax and examples. This article mainly focused only on four DAX functions such as DAX COUNT, CALENDAR, DATE, and HASONEVALUE, along with their use cases. However, there are many types of DAX functions like filter functions, statistical functions, logical functions, and text functions, which you can explore, learn, and implement later.
Power BI is a great tool for performing Data Analytics and Visualization for your business data. However, at times, you need to transfer this data from multiple sources to your PowerBI account for analysis. Building an in-house solution for this process could be an expensive and time-consuming task.
Hevo Data, on the other hand, offers a No-code Data Pipeline that can automate your data transfer process, hence allowing you to focus on other aspects of your business like Analytics, Customer Management, etc. This platform allows you to transfer data from 150+ data sources to BI tools like Power BI, and Cloud-based Data Warehouses like Snowflake, Google BigQuery, Amazon Redshift, etc. It will provide you with a hassle-free experience and make your work life much easier.
Want to take Hevo for a spin? Sign Up for a 14-day free trial and experience the feature-rich Hevo suite firsthand.
Frequently Asked Questions
1. What does count in DAX do?
COUNT in DAX (Data Analysis Expressions) is a function used in Power BI, Excel Power Pivot, and other data modeling tools to count the number of non-empty cells in a column.
2. How to count all rows in DAX?
TotalRows = COUNTROWS(‘TableName’)
3. What is count and countx?
Count counts the number of non-blank values in a column while countx counts the number of non-blank results when evaluating an expression over a table.
4. What is count () used for?
Count () is used to determine the number of non-empty entries in a specific column
Share it with your connections.
-
 Share To LinkedIn
-
 Share To Facebook
-
 Share To X
-
 Copy Link


