


The digital world is becoming a fast-paced environment where businesses need to adapt to the ever-changing customer perceptions. The competition become So fierce in recent years that data analytics has given us a way of predicting trends over time.
This way, companies can predict customer-related trends and adjust business practices to boost profits using such data. Excel is a Data Storage platform that can store data in form of rows and columns to be able to perform analytics. Connecting Excel to Redshift will improve the analytical capabilities discussed further.
Data analytics is a vast domain that encompasses several categories, such as data warehousing. As can be inferred from the name, data warehousing is the process of collecting and managing data from various sources to provide valuable business insights.
It is no secret that businesses generate tonnes of data, and housing this information on-site can become an expensive affair that will consume much company resources.
Luckily, this process becomes way less complicated for companies with cloud-powered platforms such as Amazon Redshift.
Table of Contents
What is Amazon Redshift?
Amazon Redshift, AWS Redshift for short, is a popular data warehousing solution capable of handling data on an exabytes scale. Over the years, it has become synonymous with successful companies all over the world due to the numerous benefits it offers.
It is worth noting that AWS Redshift uses Massively Parallel Processing Technology (MPT). This enables it to perform various operations on large data volumes at lightning speed. To put this into perspective, AWS Redshift can work with data on the exabytes scale usually denoted by 1018. That’s pretty impressive!
Data hosted on Redshift is always encrypted, providing an extra layer of security for users. It can be deployed with just a few clicks and offers tonnes of features to enable users to import data easily. Below are some of the key features of Amazon Redshift
Key Features of Amazon Redshift
Below are some of the key features that have enabled Amazon Redshift to stand apart from the pack:
- Automation capabilities: With AWS Redshift, you do not have to perform repetitive tasks such as generating daily, weekly, or monthly reports as the platform has automation capabilities.
- Intelligent Optimization: When querying large data sets, there are several ways you can query information using the same parameters. AWS Redshift helps in such situations by providing tools and data to improve queries. The software will also offer tips to enhance the database automatically.
- SQLFriendly: AWS Redshift is based on PostgreSQL, meaning all SQL queries can work on the platform.
- Data Encryption: This is an extra security feature part of the Redshift operation. The user can decide which data needs encryption and which does not.
Hevo Data, a No-code Data Pipeline helps to load data from any data source such as Databases, SaaS applications, Cloud Storage, SDKs, and Streaming Services and simplifies the ETL process. It supports 150+ data sources (including 30+ free data sources) like Asana and is a 3-step process by just selecting the data source, providing valid credentials, and choosing the destination. Hevo not only loads the data onto the desired Data Warehouse/destination but also enriches the data and transforms it into an analysis-ready form without having to write a single line of code.
GET STARTED WITH HEVO FOR FREE[/hevoButton]
What is Microsoft Excel?
Microsoft Excel is a data analysis and visualization tool offered by the global tech giant, Microsoft. In simple terms, it is a spreadsheet program used to record and analyze numerical information. One of the most significant benefits of this software is that it is compatible with multiple OS such as macOS, Android, iOS. Below are some of the key features of the platform.
Key Features of Microsoft Excel
- Conditional Formatting: With this feature, you can view realistic data patterns and draw key insights from such information. Even though conditional formatting can be a tad complicated, its benefits outweigh the costs.
- Pivot Tables: Pivot tables are useful when you want to simplify large spreadsheets based on specific criteria. Accordingly, you can perform sort, count, total, and average operations on a large spreadsheet.
- Paste Special: Pasting data is one of the most common and repetitive tasks in Excel. However, you can paste data in a specific styling and according to set criteria using the paste special option.
- Print Preview: Printing from Excel is often complicated since the spreadsheet may not look the same on paper. However, with print preview, you can say goodbye to such problems with the numerous print options.
Connecting Excel to Redshift
Prerequisites
This post assumes that you have the following installed:
- ODBC Driver
- Amazon Redshift
- Microsoft Excel
By now, it is evident that both Redshift and Excel are powerful tools capable of taking data analysis to new heights. How about using them together? By Connecting Excel to Redshift together, you can import data from Excel to Redshift and perform calculations to draw critical conclusions based on information. Below is how you perform this process:
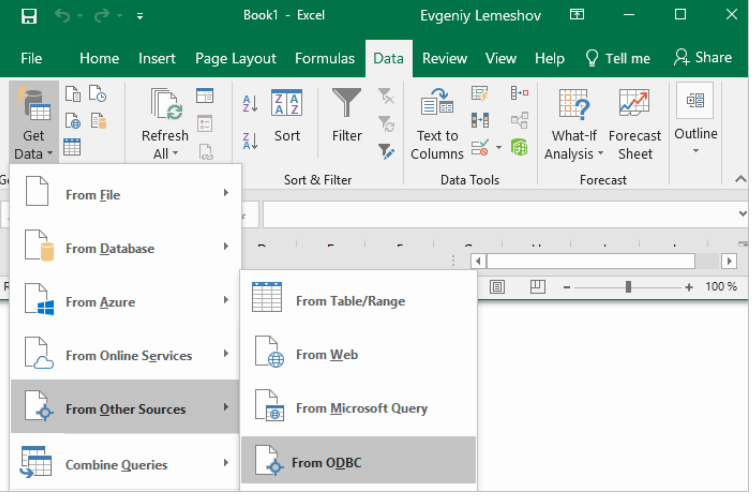
Excel to Redshift: Step 1
Head over to excel and click Data. Expand the Get Data list and under From other sources, select From ODBC.
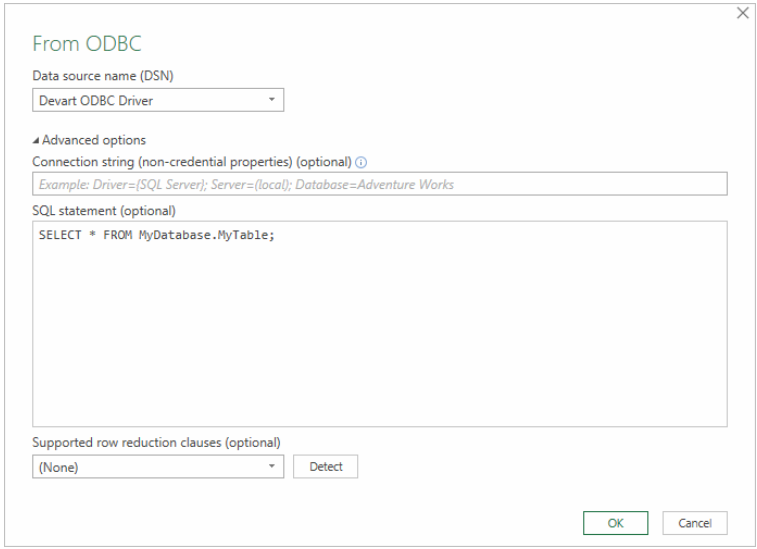
Excel to Redshift: Step 2
Assuming you have already configured your ODBC Driver, choose your Data Source Name. However, if you have not yet configured your ODBC Data name, click on Advanced Options and input the connecting string for your source.
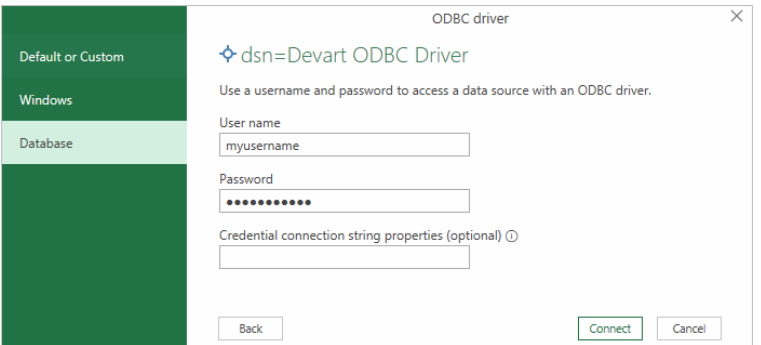
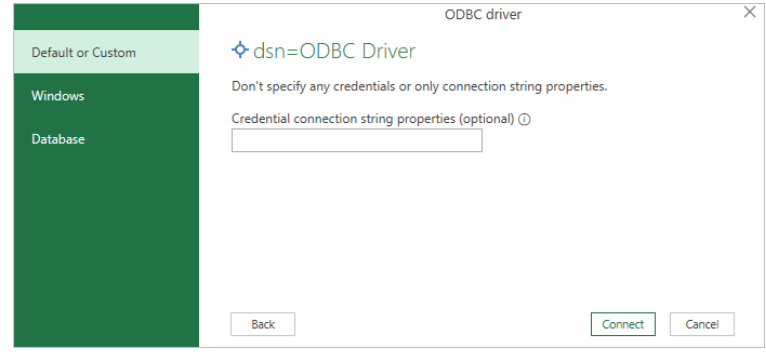
Excel to Redshift: Step 3
Select Database, and input your credentials
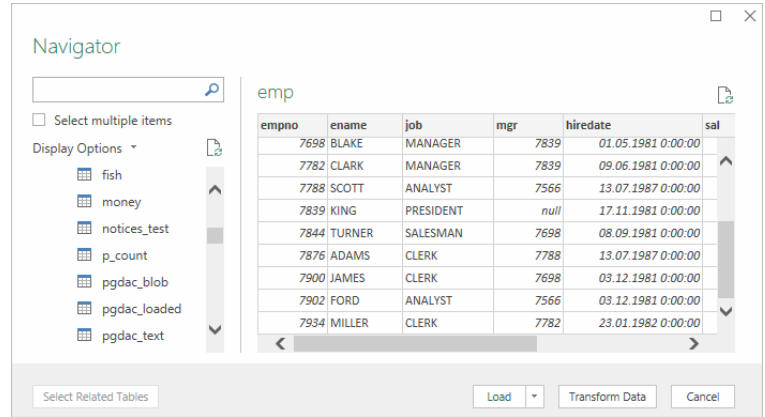
Excel to Redshift: Step 4
By now, you have already Connected Excel to Redshift, In the next window, select the table you want to import and click Load. The data will now be presented in Excel.
Conclusion
- Connecting Excel to Redshift is the right step for forward-minded companies seeking to monetize data by performing critical analyses that will help make business decisions.
- By performing the process, businesses can now conduct mathematical analysis on numerical data from Redshift and draw conclusions based on constraints such as average and deviation, which in turn, helps make financial decisions.
Hevo can help you Integrate your data from numerous sources like Excel and load them into a destination to Analyze real-time data with a BI tool such as Tableau. It will make your life easier and data migration hassle-free. It is user-friendly, reliable, and secure.
FAQ on Connect Excel to Redshift
Can I connect Excel to Redshift?
Yes, you can connect Excel to Amazon Redshift. This can be done using an ODBC or JDBC driver to create a direct connection between Excel and the Redshift cluster. Once connected, you can query and manipulate Redshift data directly from Excel.
How do I import an Excel file into Redshift?
– Convert Excel to CSV
– Upload CSV to Amazon S3
– Create a Redshift table
– Load data from CSV to Redshift
How do I transfer data to Redshift?
There are several ways to transfer data to Redshift, including:
– COPY command
– AWS Glue
– AWS Data Pipeline
– Third Party ETL Tools
– Redshift Data API

Share it with your connections.
-
 Share To X
-
 Share To LinkedIn
-
 Share To Facebook
-
 Copy Link

