The benefits of Business Intelligence and Data Visualization are becoming increasingly evident to business organizations around the world. Power BI is a Business Intelligence Service that is employed by many of these organizations to implement these useful techniques on their business data maintained in their Cloud Data Warehouse.
There are numerous instances when users require access to Power BI reports on multiple devices. These devices may not have the processing power to host/run the complete version of Power BI Desktop, and sometimes these reports are even required to be shared over email. In these scenarios Power BI Report Server can prove to be a very useful and effective tool.
In this article, you will learn in detail about Power BI Report Server, Its key features, and the steps to set up Power BI Report Server. You will also learn how to create and launch reports on the Power BI Report Server to access them on the web portal.
Table of Contents
What is Power BI?

Power BI is a Cloud-based Business Intelligence tool that is used to analyze and create Data Visualization in real-time. The user can leverage data from multiple sources to create Business Reports, Interactive Dashboards to get essential insights that help in strategic business decision making.
Power BI solution consists of various sub-platforms Power BI Desktop, Power BI Service [SaaS based Solution], and various other app-based mobile solutions. The functionality to create illustrative and data-driven Reports and real-time Dashboards help business organizations to find answers to the right questions and provide an objective basis for decision making for the management of the organization.
Key Features of Power BI
- Interactive Interface: The Power BI interface is based on an easy-to-learn Drag and Drop UI. The reports can be created using the data without requiring any programming knowledge.
- Customizable Data Visualizations: The platform provides various default templates that can be utilized by different organizations according to their requirements. Further, it provides complete customization of its templates to fit the needs of the Report / Dashboard creation.
- Secure Platform: Power BI uses a feature called Active Directory to set up access to the control panel. Along with the traditional security layer, the platform is designed to develop and create security where every user is granted access to data in a controlled manner.
- Easy Implementation: The platform requires little IT resources to be set up across the organization/department and inculcate in the workflow. Many aspects of report creation do not require any programming knowledge.
What is Power BI Report Server?
Power BI Report Server is an On-Premise Report Service solution. It offers a web portal that can help you display and manage Reports & Dashboards.
The platform is based upon SQL Server Reporting Services [SSRS] architecture that helps you access your Reports using a Web Browser, Mobile Device, or Email. Official Documentation regarding Power BI Report Server can be found here.
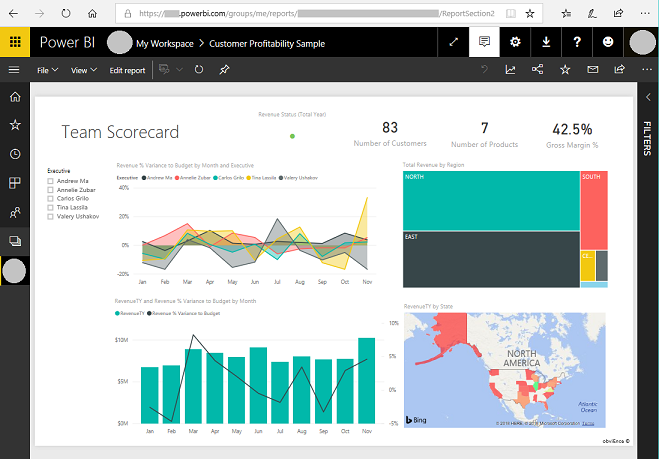
Below you can check out a screenshot of the Power BI Report Server web portal:

Key Features of Power BI Report Server
- On-Premise Capabilities: The reports on Power BI Report Server are hosted on-premises. On-Premise solutions promote secure collaborations between users. There is also a provision to host .rsmobile – Mobile Reports and .rdl – Paginated Reports and KPI Dashboards.
- Custom Visualizations: It provides the capability to render custom visualizations. [100 additional customizations were added to the default ones]
- Mobile Connectivity: The reports stored can be accessed using Power BI Mobile using mobile connectivity. Platforms including iOS, Android, Windows Mobile Platforms are supported.
- Data Export: It provides the functionality to export data into format files like CSV .xlsx etc.

Power BI Report Server Version
In this section of the Power BI Report Server, you can learn about the recent versions released by the Power BI Report Server. These versions contain major feature updates in areas like Reporting, Modeling, Paginated Reports, and many others.
You can find detailed information on those by visiting the following page:
Power BI Report Server (PBIRS) Versions
Elements of Power BI Report Server
Following are the key elements of the Power BI Report Server:
1. Web Portal
The main interface with which the user would interact the most is the secure Web Portal of the Power BI Report Server. In this portal, the user can access their Report, Dashboards, and KPIs from any device that is capable of running a modern browser.
The interface is easy to use and the files are displayed in a traditional folder hierarchy. The content is also categorized into categories as Power BI reports, Mobile Reports, Paginated Reports, KPIs, and Excel Workbooks. The Web Portal also provides the functionality to schedule report processing, access reports on demand, and subscribe to published reports.
2. Power BI Reports
Power BI Reports are multi-perspective views of data visualizations to represent and analyze the target dataset. This functionality allows the user to create .pbix reports on Power BI Desktop and then publish them across the web portal and view them according to their convenience.

3. Paginated Reports
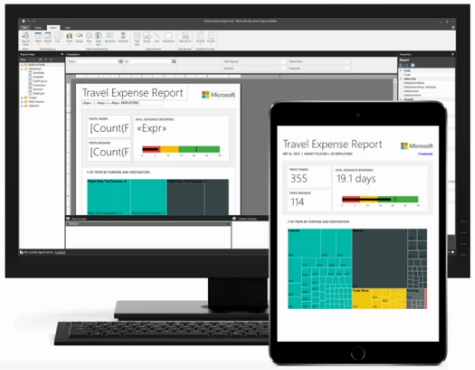
These are the type of reports in which tables expand both horizontally and vertically. They are.rdl format documents that generate files that are optimized for printing, for example, PDF and Word Files.
4. Mobile Reports
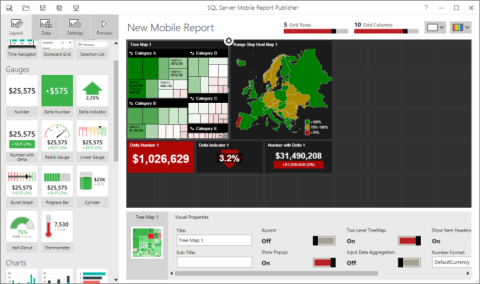
These are the types of reports which can be accessed by connecting to an On-premise server. These reports offer an interactive layout that adapts to the different screen sizes and aspect ratios of mobile devices. They are usually created using SQL Server Mobile Report Publisher.
Hevo Data helps to transfer data from 150+ sources to a Data Warehouse/Destination of your choice and visualize it in your desired BI tool such as Power BI. Hevo is fully managed and completely automates the process of not only loading data from your desired source but also enriching the data and transforming it into an analysis-ready form without having to write a single line of code.
Check out what makes Hevo amazing:
- Secure: Hevo has a fault-tolerant architecture that ensures that the data is handled in a secure, consistent manner with zero data loss.
- Schema Management: Hevo takes away the tedious task of schema management & automatically detects schema of incoming data and maps it to the destination schema.
- Incremental Data Load: Hevo allows the transfer of data that has been modified in real-time. This ensures efficient utilization of bandwidth on both ends.
- Live Support: The Hevo team is available round the clock to extend exceptional support to its customers through chat, email, and support calls.
Steps to Set Up Power BI Report Server
Step 1: You can download the software by visiting the link here and clicking on “Download Free Trial”
Step 2: Find the downloaded file and launch the installer.
Step 3: Select Power BI Report Server.
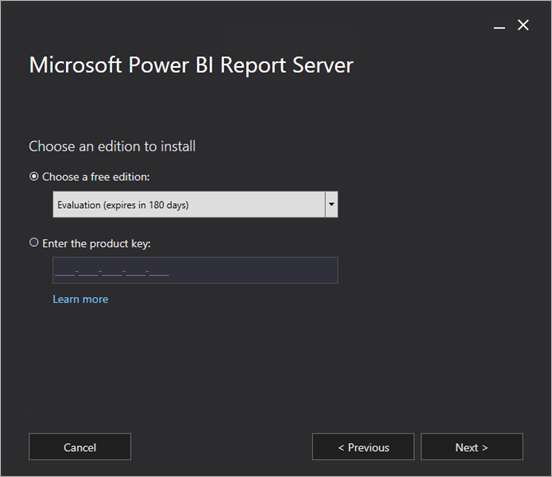
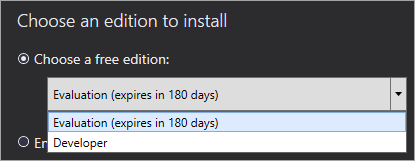
Step 4: Select the edition you would want to set up and click on “Next”. You will be given a choice between Evaluation or Developer Edition.
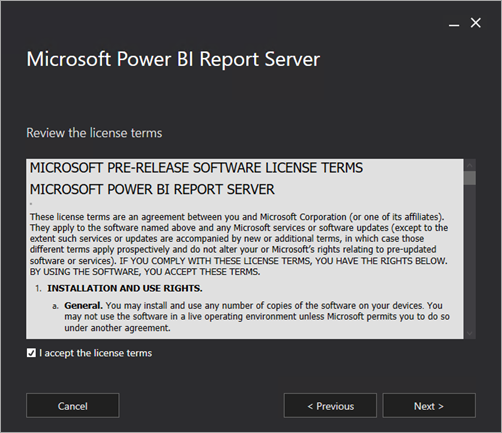
Step 5: Agree to all the terms and conditions and continue the installation process by clicking on “Next”.
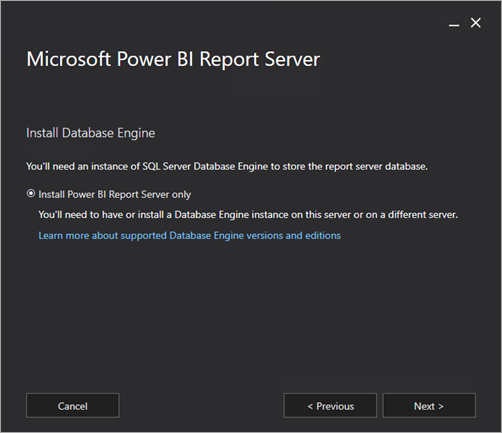
Step 6: Subsequently you would be required to install a Database Engine to store the data from the Power BI Report Server.
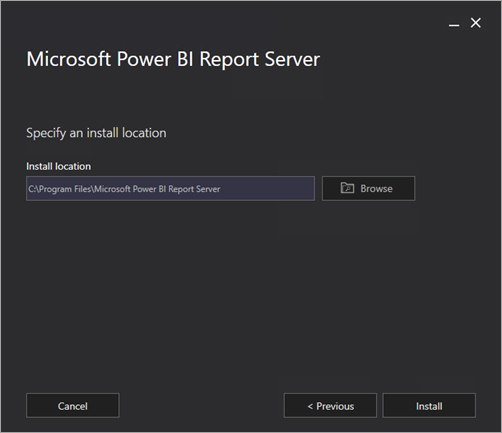
Step 7: The user is required to specify an install location for the software. To continue with installation after making the required changes select “Install”.
If you require more information regarding the installation of the Power BI Report Server, it can be found here.
Launching Reports on Power BI Report Server
Following are 4 major steps that are required to launch Reports on Power BI Report Server.
- Step 1: Initialising Power BI Desktop Now
- Step 2: Selecting the Data Source
- Step 3: Designing the Report
- Step 4: Saving the Report
Step 1: Initialising Power BI Desktop Now
Firstly you would be required to set up and initialize Power BI Desktop Now. You may choose the 32-Bit or 64-Bit version according to your requirement.

Step 2: Selecting the Data Source
On the Welcome screen while operating “Power BI Desktop Now” users will be required to select “Get Data”. In the list of the available data sources, select “Analysis Services”.

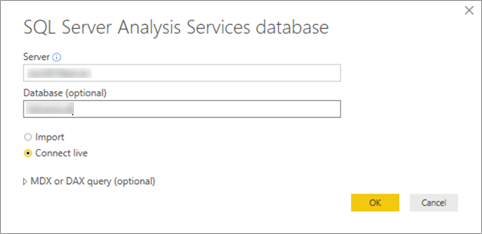
In the subsequent window, select “Server”, and ensure that Connect Live is selected as “OK”.
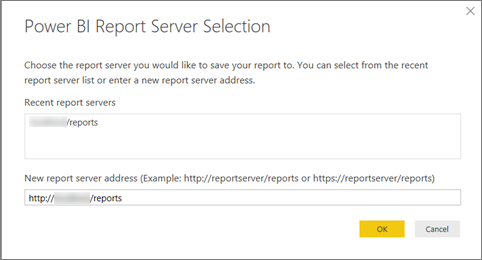
Then choose the Report Server where you want to store your Power BI Reports.
Step 3: Designing the Report
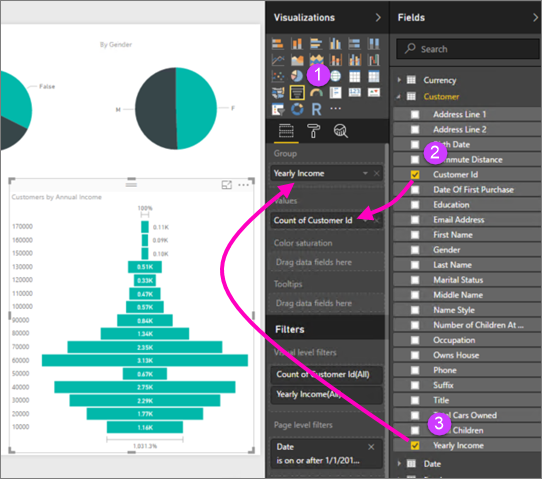
In this step, you would be required to create the desired report based on the dataset being leveraged. The report creation is fairly easy to use and it is based on the Drag and Drop user interface.
Step 4: Saving the Report
Once the Illustrative Report is created according to the requirements, the user should proceed to Saving the report on the server. Start by selecting “Power BI Report Server” in the “Save as” option in the File menu.
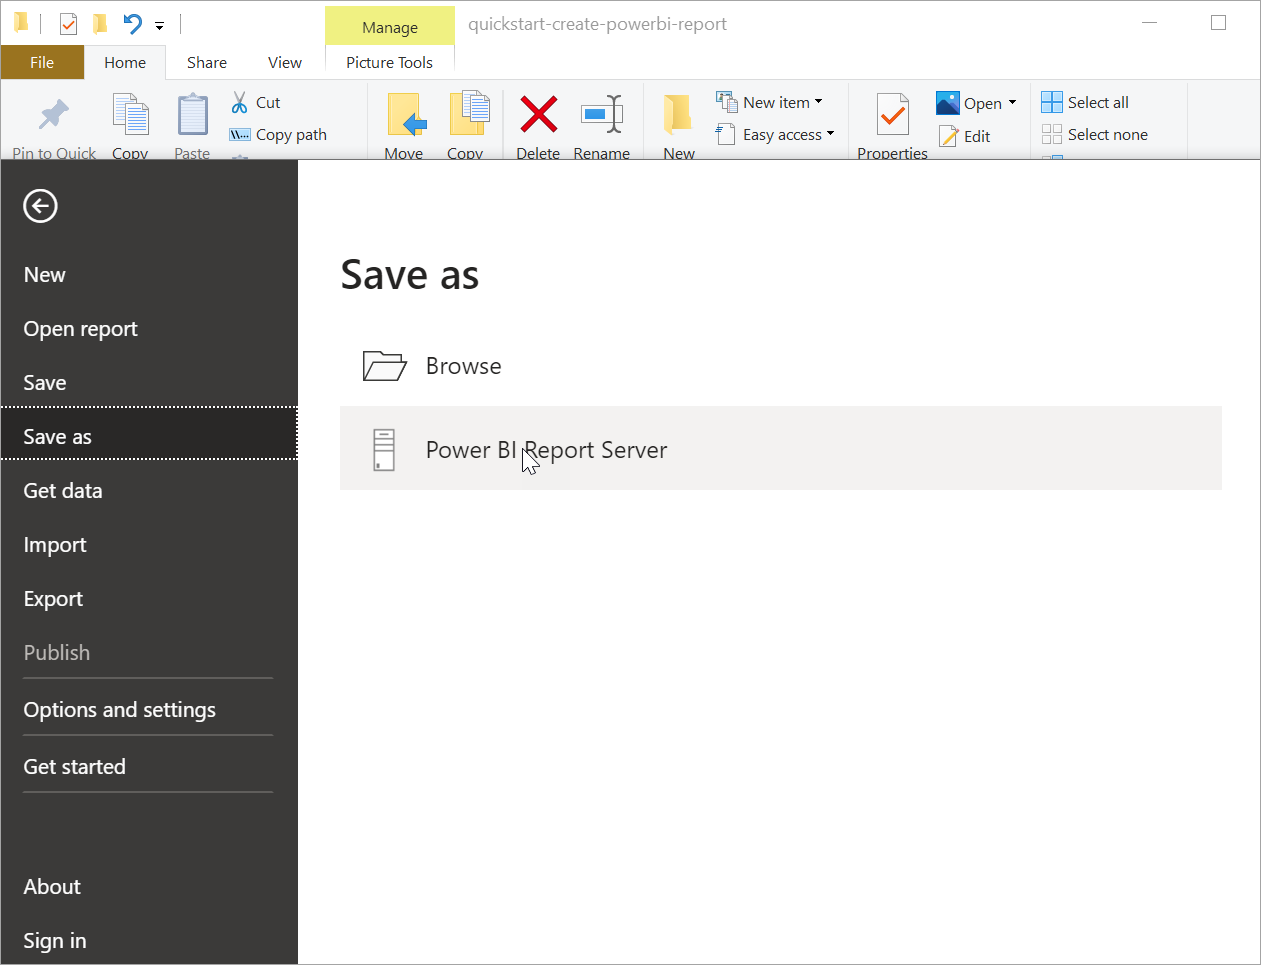
The report can now be viewed in the Power BI Report Server web portal and other supported services.
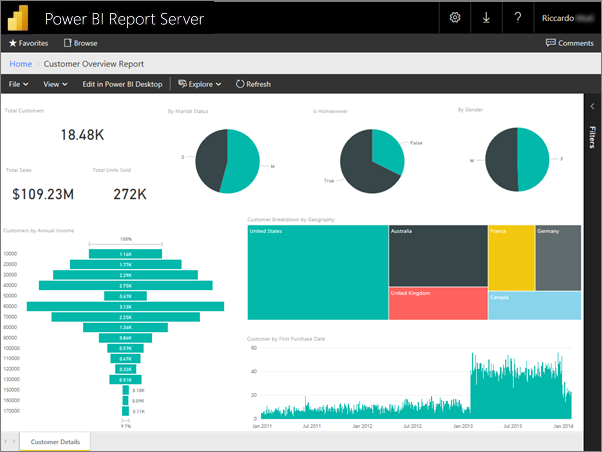
More information regarding hosting reports on the Power BI Report Server can be found here.
Conclusion
In this article, you learned in detail about Power BI Report Server, Its key features, steps to set up Power BI Report Server, and how to create and launch reports on the server to access them on the Web Portal.
Integrating and analyzing data from a huge set of diverse sources can be challenging, this is where Hevo comes into the picture. Hevo Data, a No-code Data Pipeline helps you transfer data from a source of your choice in a fully automated and secure manner without having to write the code repeatedly.
Hevo with its strong integration with 100+ sources & BI tools, allows you to not only export & load Data but also transform & enrich your Data & make it analysis-ready in a jiffy.
Get started with Hevo today! Sign up here for a 14-day free trial!


