Tableau is a very popular and easy-to-use Business Intelligence (BI) tool for transforming business data into meaningful reports or dashboards. As Tableau provides easy drag-and-drop action for creating data visualizations, organizations rely on it for gaining insights seamlessly. Tableau helps users understand their data through charts, maps, reports, and more data visualizations. However, at times, users and organizations might need to visualize only some part or portion of the dataset instead of visualizing the entire dataset.
In such cases, Tableau uses REST API and GraphQL to retrieve these portions of datasets and provide users with the exact data they want. To connect GraphQL data with Tableau, you can use a third-party connector like the CData Tableau GraphQL connector.
In this blog, you will learn to visualize the GraphQL data within Tableau Server using the CData Tableau GraphQL connector. Read along to learn the steps required to set up the Tableau GraphQL connection and use them for your business today!
Table of Contents
Prerequisites
- Tableau account.
- Understanding of big data.
Streamline your ETL processes with Hevo’s no-code platform, which is designed to automate complex data workflows effortlessly. Our intuitive interface ensures smooth data extraction, transformation, and loading without the need for manual coding.
- Automate your ETL pipelines with ease.
- Enjoy flexible, real-time data transformations
- Connect to 150+ data sources, including 60+ free sources
Join and trust Hevo to simplify ETL workflows. See why Hevo is rated 4.7 on Capterra for data integration excellence.
Get Started with Hevo for FreeWhat is Tableau?
Developed in 2003, Tableau is a popular business intelligence (BI) tool for visualizing and analyzing data. Tableau allows users to create and share data visualizations using graphs, charts, reports, dashboards, and more. Data visualizations help users and organizations to make data-driven and business-oriented decisions.
Tableau supports several data types for visualization like text, date, time, date & time, boolean, geographic values, and more. Tableau can also access data from different data sources like Microsoft Excel or CSV files on your system.
Key Features of Tableau
Tableau offers the following key features:
- High Security: Tableau builds a highly secure system by using several authentication methods and permissions systems for data connection and user access.
- Real time-sharing: Tableau allows users to share their reports, dashboards, workbooks, and more data visualizations with other users or their team in real-time.
- Tableau Dashboards: Tableau dashboards allow users to provide a complete view of their data by using charts and graphs. It enables users to gain meaningful insights from their data with different layouts and formats.
- Compatible Mobile view: Using Tableau, you can create reports, dashboards, workbooks, graphs, or other data visualization compatible with mobile devices.
- Ask Data Feature: The Ask Data feature in Tableau enables users to get insights into data by asking questions in natural language.
- Maps: Tableau lets you add maps to your visualizations that provide you with detailed information like cities, postal codes, administrative boundaries, and more.
What is GraphQL?
Developed by Facebook in 2012, GraphQL is used for mobile applications to reduce network usage due to its specific data fetching capabilities. It is a Query Language and a server-side runtime for enhancing the Application Programming Interface (API). GraphQL provides users with a complete and understandable description of data with the help of different APIs. It provides users with what exactly they need instead of the entire dataset. In other words, GraphQl tells the API how to present data to their clients in the backend.
GraphQL, in Tableau, is also used for obtaining metadata of visualizations with the Metadata API. The Metadata API is used to discover the data source of the data visualizations published on your Tableau Server or Tableau Online site. It is also used to track the relationship between content and external assets. However, besides Metadata API, you can leverage REST API to get the metadata associated with visualizations.
Setting up Tableau GraphQL connector using CData
Tableau Server is a visual analytics tool used for transforming data into interactive visualizations. When paired with the CData Tableau connector, you will get access to live GraphQL data within the Tableau Server. The CData Tableau connectors enable high-speed access to the GraphQL data. Once you install the CData Tableau connector, you must authenticate it with GraphQL to create visualizations.
You can establish the Tableau GraphQL connection using the following steps:
- Step 1: Connecting to GraphQL in Tableau Server
- Step 2: Connecting to GraphQL in Tableau Desktop
- Step 3: Discover Schemas and Query Data with the Tableau GraphQL Connection
- Step 4: Publish Data with the Tableau GraphQL Connection
- Step 5: Visualize Data with the Tableau GraphQL Connection
Step 1: Connecting to GraphQL in Tableau Server
You can start by installing the CData Tableau Connector on the machine hosting Tableau Server.
If you have a Linux machine, follow the below steps.
- You can download the CData GraphQL Tableau connector.
- Create a directory for the connector files similar to the following:.
/opt/tableau/tableau_driver/connectors- Update your Tableau configuration with the location of the above directory as shown below.
tsm configuration set -k native_api.connect_plugins_path -v /opt/tableau/tableau_driver/connectors --force-keys- Copy the cdata.graphql.taco and cdata.tableau.graphql.lic from the connector installation directory.
- Paste the above files into the created directory.
- Restart the Tableau Server.
- Install the CData Tableau Connector on the machine running Tableau Desktop.
Step 2: Connecting to GraphQL in Tableau Desktop
After installing the CData Tableau Connector on the server machine, you can configure a connection to GraphQL in Tableau Desktop and publish a GraphQL based data source to Tableau Server.
Follow the below steps to connect GraphQL in Tableau Desktop.
- Open the Tableau Desktop.
- Under Connect, click on More → To a Server tab.
- Select “GraphQL by CData.”
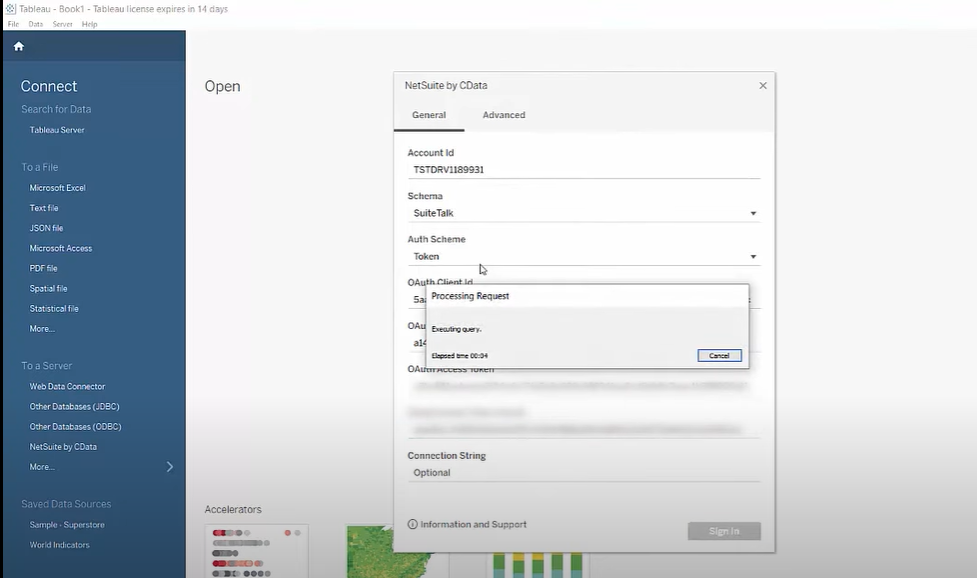
- Configure the connection to the data.
You need to specify the URL of the GraphQL service. You need to describe the Username and Password of the GraphQL service.
- Finally, click on Sign in, as shown in the below image.

Step 3: Discover Schemas and Query Data with the Tableau GraphQL Connection
Once you set up the connection to GraphQL data, you can configure which entities to visualize in GraphQL.
- Select CData from the Database pull-down menu.
- Select GraphQL from the Schema pull-down menu.
- You can include multiple tables and view to visualize as follows.
- Click on Update Now or ‘Automatically Update’. With Update Now, you can preview the first 10,000 rows of the data source. Automatically Update can auto-load the changes in the preview area.
Step 4: Publish Data with the Tableau GraphQL Connection
After configuring the data for visualizing, you can publish that data to the Tableau Server instance.
Follow the below steps to publish data in Tableau Server.
- Click on Server and then click on Sign in.
- Enter the URL for the Tableau Server.
- Authenticate with the Tableau Server.
- Click on Server and then click on Publish data source. You can select your data source.
- Click on Publish.
- You need to select the Project, the data source name, and add a description.
- Finally, click on Publish, as shown below.
The above step will create a new entry under the server’s data source list, from which you can change the data source permissions, view its history and perform other management tasks.
Step 5: Visualize Data with the Tableau GraphQL Connection
After publishing the Data Source, you are ready to visualize the GraphQL data.
Follow the below steps to visualize the data in GraphQL with the Tableau Server.
- Login to your Tableau Server.
- Connect to the remote source using Search for Data → Tableau Server in the Connect sidebar.
- Click on the published Data Source.
- Click on the New Workbook.
- GraphQL fields are listed as Dimensions and Measures depending on the data in the Workbook.
- Drag a field from the Dimensions or Measures area to Rows or Columns.
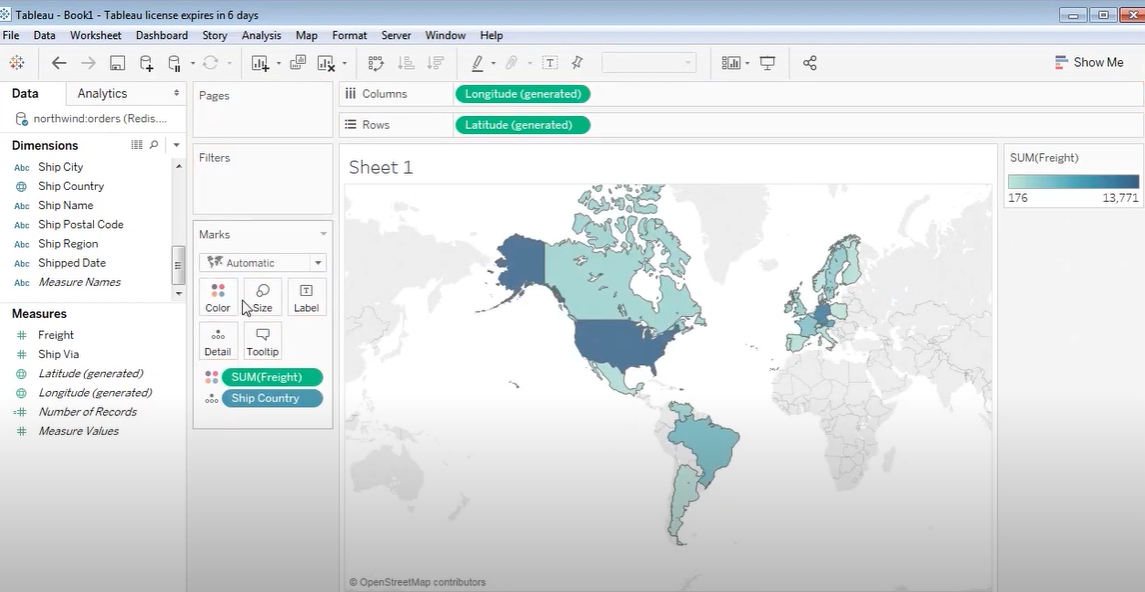
- You can select one of the chart types from the ‘Show Me’ tab. Tableau will display the chart type that you selected, as shown below.

As a result, using the CData Tableau Connector for GraphQL with Tableau Server, you can easily create visualizations and reports on data in GraphQL.
That’s it! Your Tableau GraphQL connection is ready.
Conclusion
This article introduced you to Tableau and discussed its key features. In this tutorial, you have learned to use GraphQL for Tableau Server using CData Tableau Connector. CData is a third-party Tableau Connector that allows you to visualize the GraphQL data within Tableau Server. However, you can further explore visualizing the REST API in Tableau Server. With Tableau, you can also visualize data from various sources using connectors like Amazon Athena, Amazon Redshift, Azure SQL database, Dropbox, Google Analytics, Google Ads, and more.
Tableau is a great tool for performing Data Analytics and Visualization for your business data. However, at times, you need to transfer this data from multiple sources to your Tableau account for analysis. Building an in-house solution for this process could be an expensive and time-consuming task. Hevo Data, on the other hand, offers a No-code Data Pipeline that can automate your data transfer process, hence allowing you to focus on other aspects of your business like Analytics, Customer Management, etc.
Want to take Hevo for a spin? Sign Up for a 14-day free trial and experience the feature-rich Hevo suite first hand.
Share your views on connecting Tableau GraphQL in the comments section!
FAQs
Does Tableau support GraphQL?
As of now, Tableau does not natively support GraphQL. Tableau primarily integrates with data sources through SQL and REST APIs.
Does Tableau have a REST API?
Yes, Tableau has a REST API that allows users to interact programmatically with Tableau Server and Tableau Online. It supports tasks like user management, content management, and embedding Tableau visualizations.
What is GraphQL used for?
GraphQL is a query language for APIs that allows clients to request specific data from a server. It provides a more efficient and flexible alternative to REST APIs, allowing clients to fetch precisely the data they need with a single query.


