Apache Airflow is a well-known Open-Source Workflow Management application. It allows you to create workflows using standard Python, allowing anyone with a minimal understanding of the language to deploy one. This is a significant improvement over earlier platforms, which relied on the Command Line or XML to deploy workflows.
Apache Airflow Monitoring has recently gained a lot of traction in enterprises that deal with significant amounts of Data Collection and Processing, making Airflow one of the most widely used data monitoring solutions.
In this article, you will get to know everything about Airflow Monitoring and understand the important terms and mechanisms related to Airflow Monitoring.
Table of Contents
What is Apache Airflow?

Apache Airflow is an open-source tool for automating and scheduling workflows. It allows users to programmatically create, schedule, and monitor data processing pipelines using a Directed Acyclic Graph (DAG) of nodes and connectors. Geared mainly towards use by data engineers, Airflow provides reliable orchestration of complex processes or data pipelines with strong visibility into dependencies, progress, logs, and task statuses.
Key Features
- Versatility: Users can design customized operators, executors, and hooks.
- User Interface: Pipelines can be built using Jinja templates, making them lean and expressive.
- Dynamic Integration: Creation of dynamic pipelines in Python to generate DAG and connect it using various operators and connectors.
- Scalability: It is built for any number of workflows and is designed to scale endlessly.
What are Callbacks?
The usage of Task Callbacks to act on changes in the state of a single job or across all tasks in a DAG is an important part of Airflow Monitoring and Logging. For example, you might want to be notified when particular jobs fail or have the last task in your DAG Trigger a callback when it succeeds.
There are four types of events that can trigger a Callback:
| Name | Description |
| on_success_callback | Invoked when the task succeeds |
| on_failure_callback | Invoked when the task fails |
| sla_miss_callback | Invoked when a task misses its defined SLA |
| on_retry_callback | Invoked when the task is up for retry |
Say goodbye to manual coding with Hevo Data, a no-code data pipeline that offers a fully managed solution to load data from 150+ data sources (including 60+ Free sources). Let’s look at some of the salient features of Hevo:
- Ensure secure, consistent, and zero data loss with Hevo!
- Eliminate the need for manual schema mapping with the auto-mapping feature.
- Customize your transformations using Hevo’s drag-and-drop feature.
With a 4.2 rating on G2, check out the 14-day free trial to experience a better way to manage your data pipeline integration
Sign up here for a 14-Day Free Trial!Understanding the Basics of Apache Airflow Monitoring
1) Logging
– It runs automatically and requires good tracking.
– It has built-in logging to rectify issues quickly.
– It uses standard Python logging; logs are local by default.
– Use the Web UI to open the view log on tasks.
– Community handlers let you write logs to cloud storage such as AWS, Google Cloud, and Azure.
2) Lineage
– It provides an image of what data was used, how it was transformed, and where it was used.
– It provides an audit trail for data governance
– Defines input and output sources of jobs
– Adds graphs of data source connections through Apache Atlas
3) User Interface
A) Tree View
The Tree View allows you to drill down into a specific DAG at a lower level.
This allows you to track the state of Run and Task over time.
The Graph View can examine multiple Runs at once and discover problems more quickly.
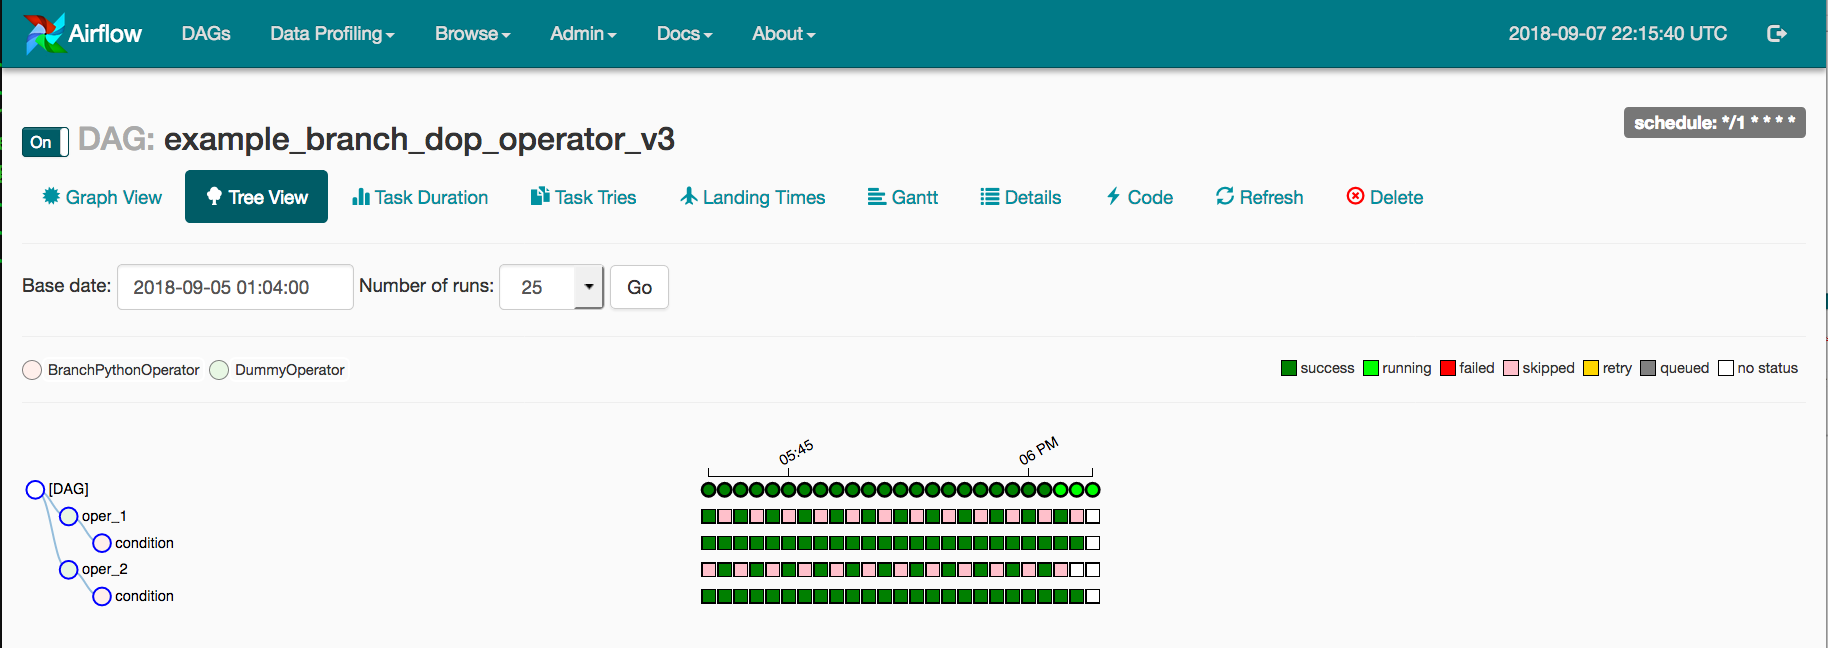
- While this View is useful, it gets tough to manage when the DAG is large and there are numerous Runs, especially when the Status colors and boundaries are difficult to distinguish.
- To simplify things, the TaskInstance and DagRunState colors in Airflow’s Webserver can be customized.
- To do so, write an airflow local setting.py file and place it on $PYTHONPATH or inside the $AIRFLOW HOME/config folder.
- NOTE: When Airflow is established, $AIRFLOW HOME/config is added to $PYTHONPATH.
- After that, according to Airflow’s instructions, you need to add the following to the airflow local setting.py file:
STATE_COLORS = {
  "queued": 'darkgray',
  "running": '#01FF70',
  "success": '#2ECC40',
  "failed": 'firebrick',
  "up_for_retry": 'yellow',
  "up_for_reschedule": 'turquoise',
  "upstream_failed": 'orange',
  "skipped": 'darkorchid',
  "scheduled": 'tan',
}
Pro Tip: You can change the colors to suit your team’s tastes. Simply restart the Webserver to see the modifications take effect.
B) DAGs View
- The DAGs View displays a list of DAGs in your environment as well as shortcuts to other built-in Airflow Monitoring tools.
- Here you can see the names of your DAGs, their owners, the statuses of recently conducted runs and tasks, and some fast actions.
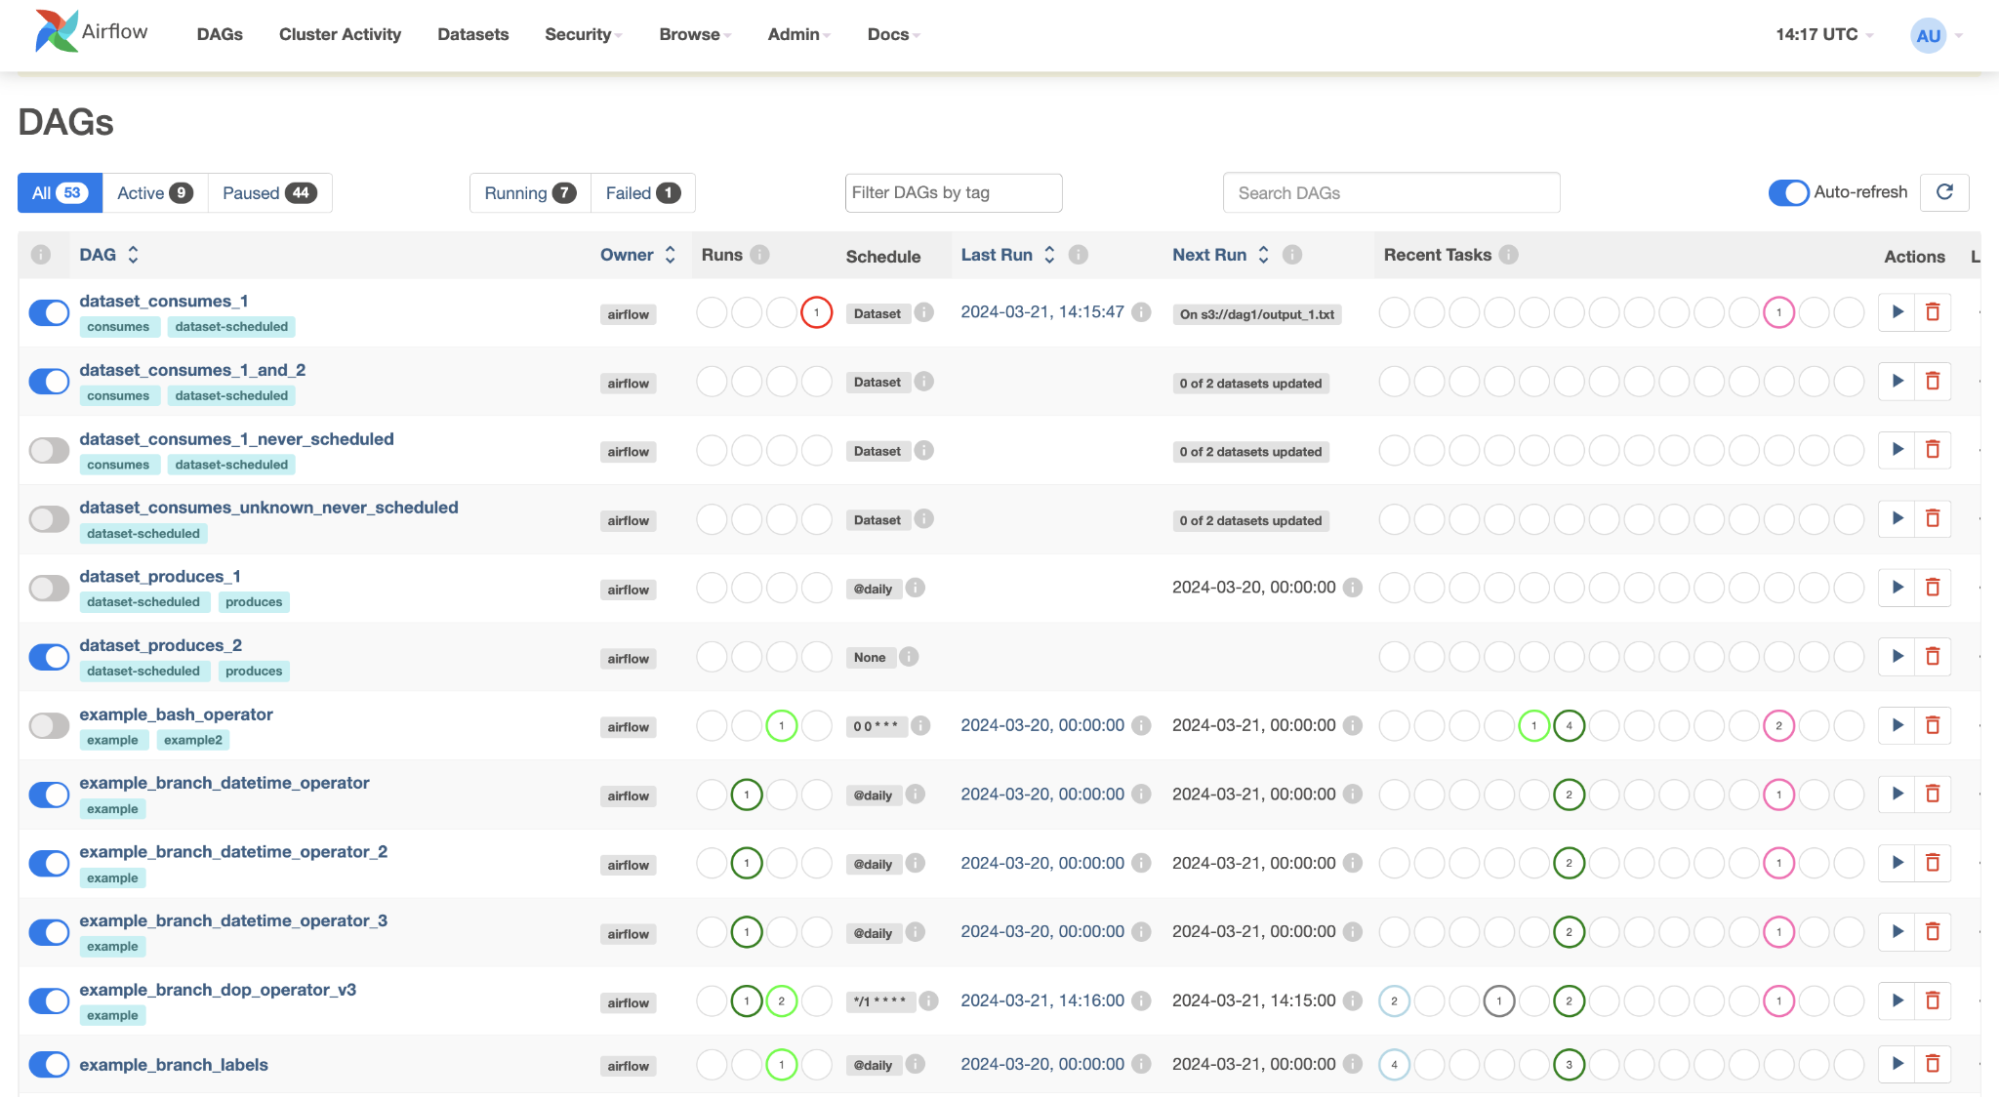
- If you’re dealing with many teams in this setting, you should tag the pipeline to facilitate Airflow Monitoring.
- In your DAG file, you can add Team Tags to the DAG Object. Here’s an example of what that could look like, according to Airflow’s documentation:
dag = DAG(
  dag_id='example_dag_tag',
  schedule_interval='0 0 * * *',
  tags=['example']
)
Pro Tip: This filter is then kept as a cookie, and you can use it to add it to the DAG View by typing it into the filter input form at the top.
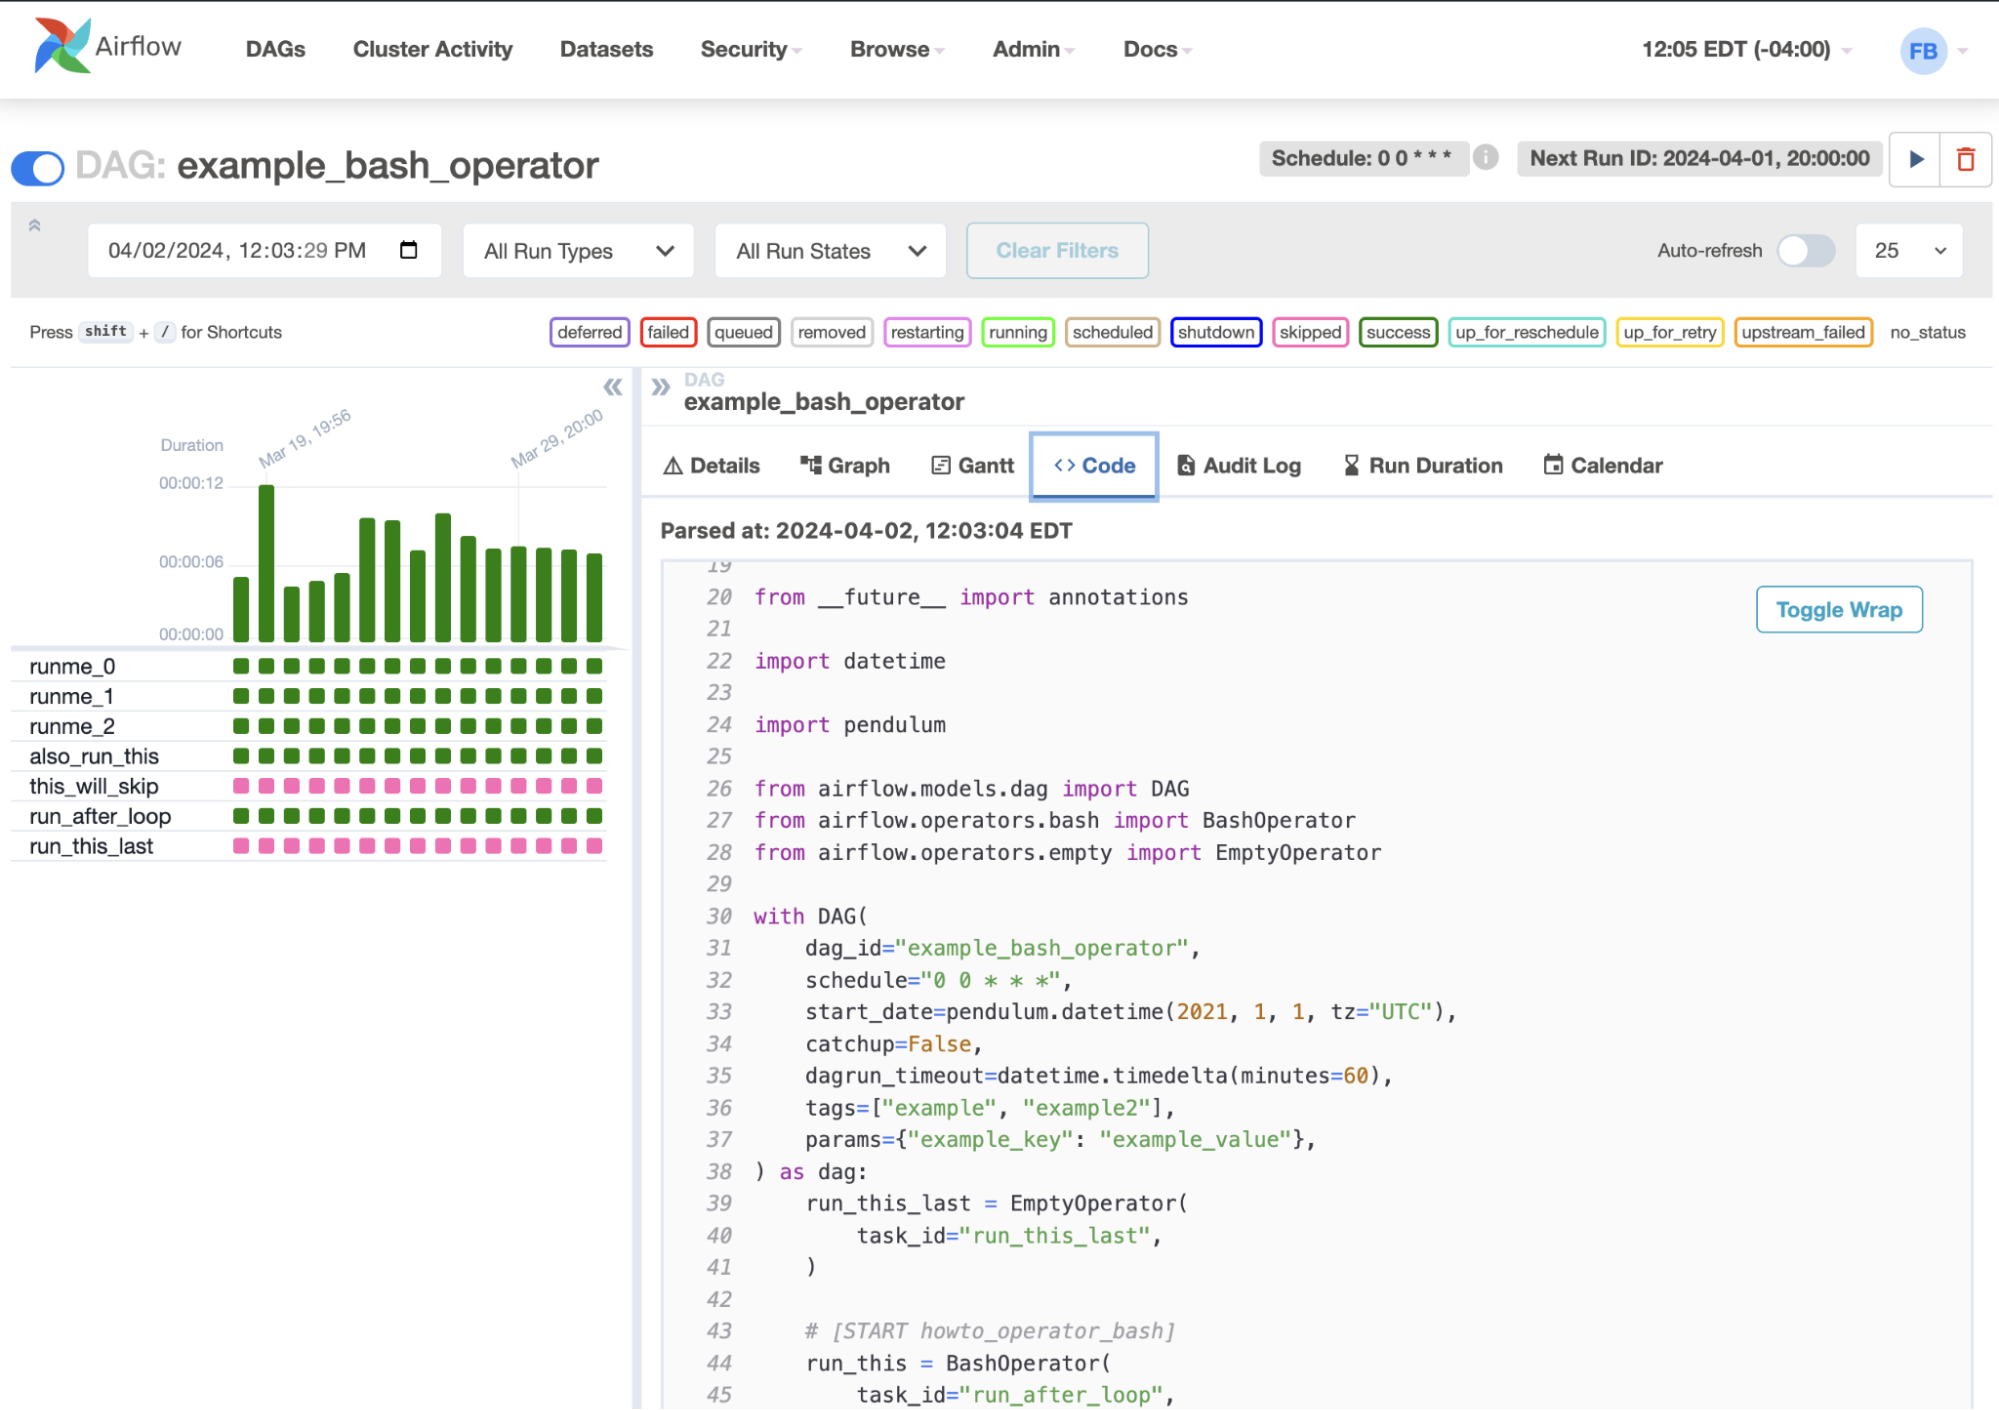
C) Code View
- While the code for your pipeline technically lives in source control, you can examine the User Code through Airflow’s UI,
- It helps you uncover logic flaws, provided you have appropriate context.
How to Check the Health Status in Airflow?
- HTTP Checks and CLI Checks are two methods for checking the health of components in Airflow.
- Due to the nature of the component being checked and the technologies used to monitor the deployment, only some checks are accessible over HTTP.
- For example, when running on the Kubernetes software deployment platform, use a Liveness probe (livenessProbe property) with CLI checks. The scheduler deployment restarts the process when it fails. You can use Health Check Endpoint to configure the readiness probe (readinessProbe property) for the webserver.
What are the available Airflow Monitoring Services?
With our effective designs, any prominent organization’s services strive to boost pipeline performance. The following are basic Airflow Monitoring services that cover a variety of critical factors:
- Management: The Apache management monitoring services provide high-level management and Airflow Monitoring of the DAG Nodes, Servers, and Schedule Logs, ensuring that all airflow pipelines are operational.
- Tracking: Airflow allows users to keep track of their information. All of the crucial details about the data, such as its origins, how it is handled, and so on, are continuously tracked.
- Sensors: Sensors in Airflow allow users to activate a job based on a pre-condition that the user must set.
- Security: The airflow services aim to provide customers with a high-security platform that does not necessitate the deployment of any additional security software.
What are some metrics you should monitor?
The following is a list of some of the most critical areas to keep an eye on while Airflow Monitoring, which can also help you troubleshoot and detect resource bottlenecks:
- Check for the Scheduler, Webserver, Workers, and other custom processes to see if they’re up and running.
- How long do they stay online?
- How many workers are on the move?
- Are the Customized Metrics and Settings reflected in Metrics?
- DAG Parsing Time and the number of active DAGs
- Pool Utilization is on the rise.
- Job Execution Status (started/completed) is on the rise.
- Executor Task Status (running/queued/open slots) is on the rise.
- Operator-by-operator Execution Status (success/failure)
- Status of Task Instances (successes/failures)
- Time spent on Critical Tasks and Sensors is on the rise.
- DAGs take an average of time to reach an end state.
- DAGs are delaying their Schedules on a regular basis.
- Time spent by DAGs on Dependency Checks is on the rise.
It’s critical to keep track of these KPIs at various levels, including the overall organization, individual tasks, and the DAG level. You should also keep track of your individual operators and tasks that you believe are more likely to fail or require more resources.
Popular Tools to Set Up an Airflow Monitoring System
1) Prometheus
Prometheus is a popular tool for storing and alerting Metrics. It’s often used to collect Metrics from other sources like RDBMSes and Web servers.
Since Airflow doesn’t have a Prometheus integration, Prometheus StatsD Exporter is used to collect metrics and convert them into a Prometheus-readable format. It connects StatsD and Prometheus by converting StatsD Metrics into Prometheus Metrics using custom mapping rules.
Steps to Connect to Prometheus
Step 1: Write two files to set up statsd-exporter: “prometheus.yml” and “mapping.yml,” which you can find on our GitHub repository linked below and save these in a new folder called “.prometheus” in your Airflow directory.
Step 2: After you’ve copied these two files into the folder, open an Ubuntu terminal and type the following command:
docker run --name=prom-statsd-exporter
-p 9123:9102
-p 8125:8125/udp
-v $PWD/mapping.yml:/tmp/mapping.yml
prom/statsd-exporter
   --statsd.mapping-config=/tmp/mapping.yml
   --statsd.listen-udp=:8125
   --web.listen-address=:9102
You’re good to go if you see the following line in the output:
level=info ts=2021-10-04T04:38:30.408Z caller=main.go:358 msg="Accepting Prometheus Requests" addr=:9102Step 3: Keep this terminal open and type a new command in a new Ubuntu terminal:
docker run --name=prometheus
-p 9090:9090
-v $PWD/prometheus.yml:prometheus.yml
prom/prometheus
   --config.file=prometheus.yml
   --log.level=debug
   --web.listen-address=:9090
If you see the following line in your output, your Prometheus has been correctly set up:
level=info ts=2021-10-02T21:09:59.717Z caller=main.go:794 msg="Server is ready to receive web requests."2) StatsD
StatsD is a popular tool for gathering and aggregating data from a variety of sources. Airflow includes functionality for transmitting measurements to the StatsD server. After Airflow has been configured, it will send Metrics to the StatsD server, where you will be able to visualize them.
Steps to Connect to StatsD
Step 1: To find Statsd, open the airflow.cfg file and look for it. The following variables will be visible:
[metrics]
statsd_on = False
statsd_host = localhost
statsd_port = 8125
statsd_prefix = airflow
Step 2: Set the value of statsd_on = True. You have the option of changing the port where we can listen to the measurements.
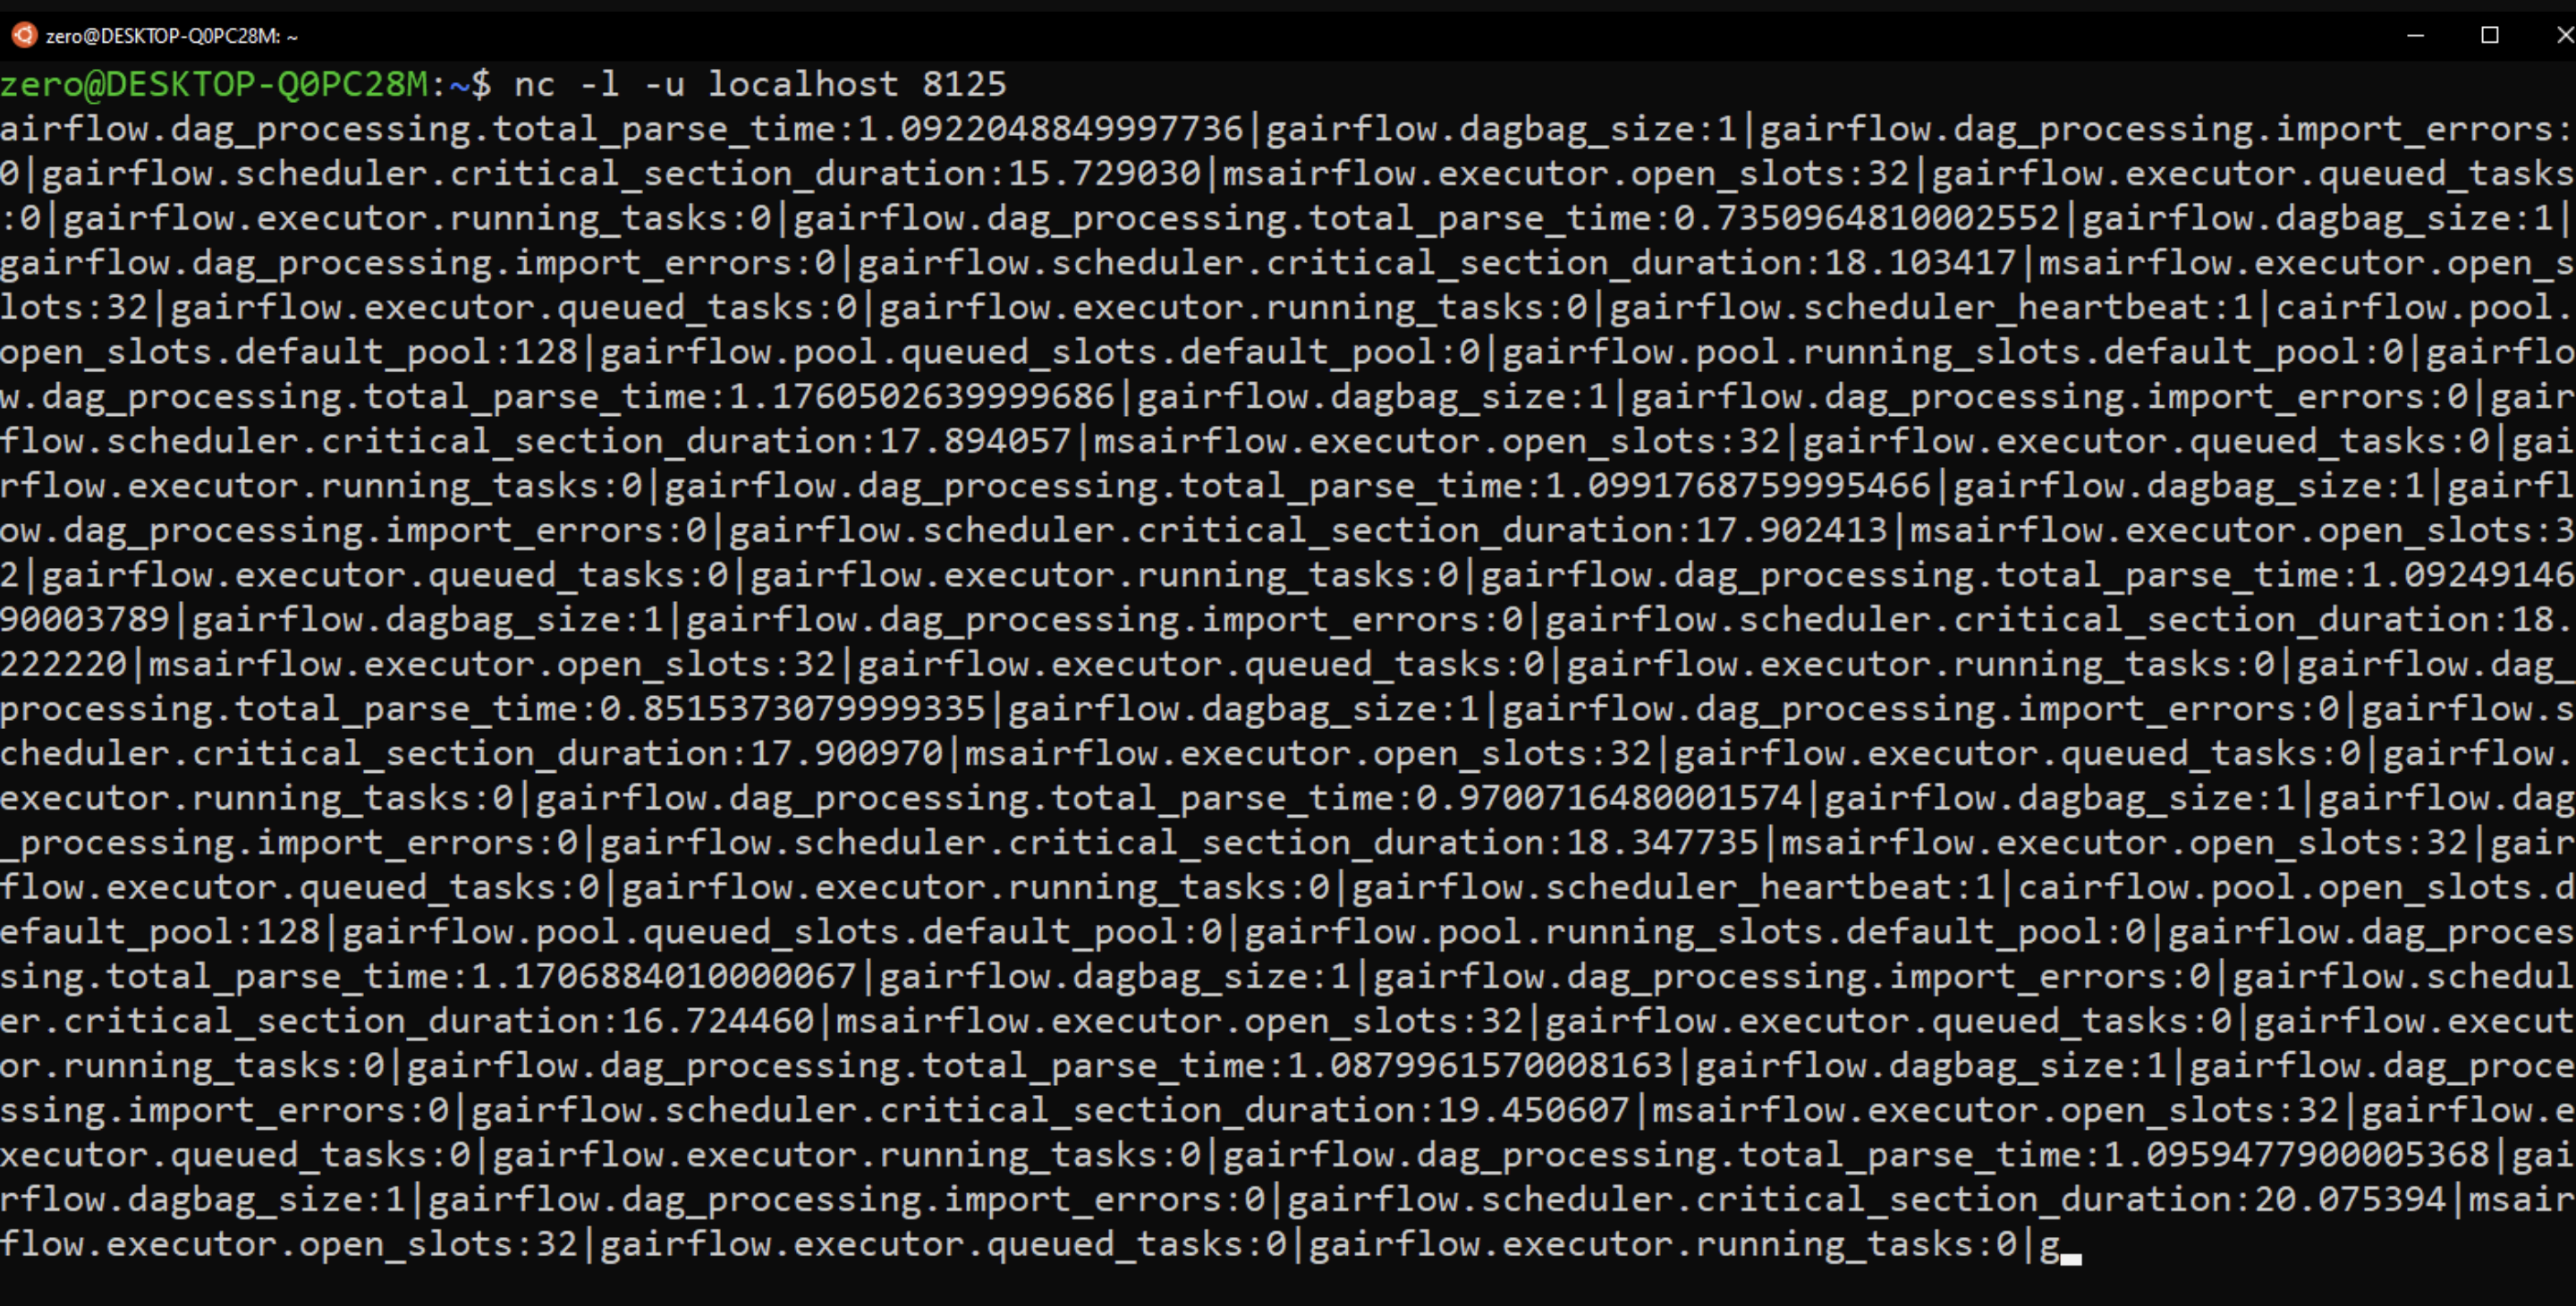
Step 3: Now launch a DAG in airflow and type the following command in another terminal:
nc -l -u localhost 8125This command simply returns the Airflow Metrics that StatsD has exposed and captured. Since Metrics are collected at regular intervals, the output will be continuous.
3) Grafana
Grafana is one of the best visualization tools for metrics. It supports native Prometheus and is used to set up the Cluster Airflow Monitoring Dashboard.
Here, you can see all the important metrics such as scheduler heartbeat, dagbag size, number of queued / running tasks, and currently running DAG aggregated by task.
You can see DAG-related Metrics such as Successful DAG Execution Period, Unsuccessful DAG Execution Period, DAG Execution Dependency-Check Time, and DAG Execution Schedule Delay.
Steps to Connect to Grafana
Step 1: To set up Grafana on your system, enter the following command in your Ubuntu terminal:
To set up Grafana on your system, enter the following command in your Ubuntu terminal:
docker run -d --name=grafana -p 3000:3000 grafana/grafanaAfter a successful setup, you can access https://localhost:3000/ to access the Gafana Dashboard.
Step 2: On the dashboard, click on the icon below the + icon to create a new Data Source, and select Prometheus Data Source in the URL section, type:
host.docket.internal:9090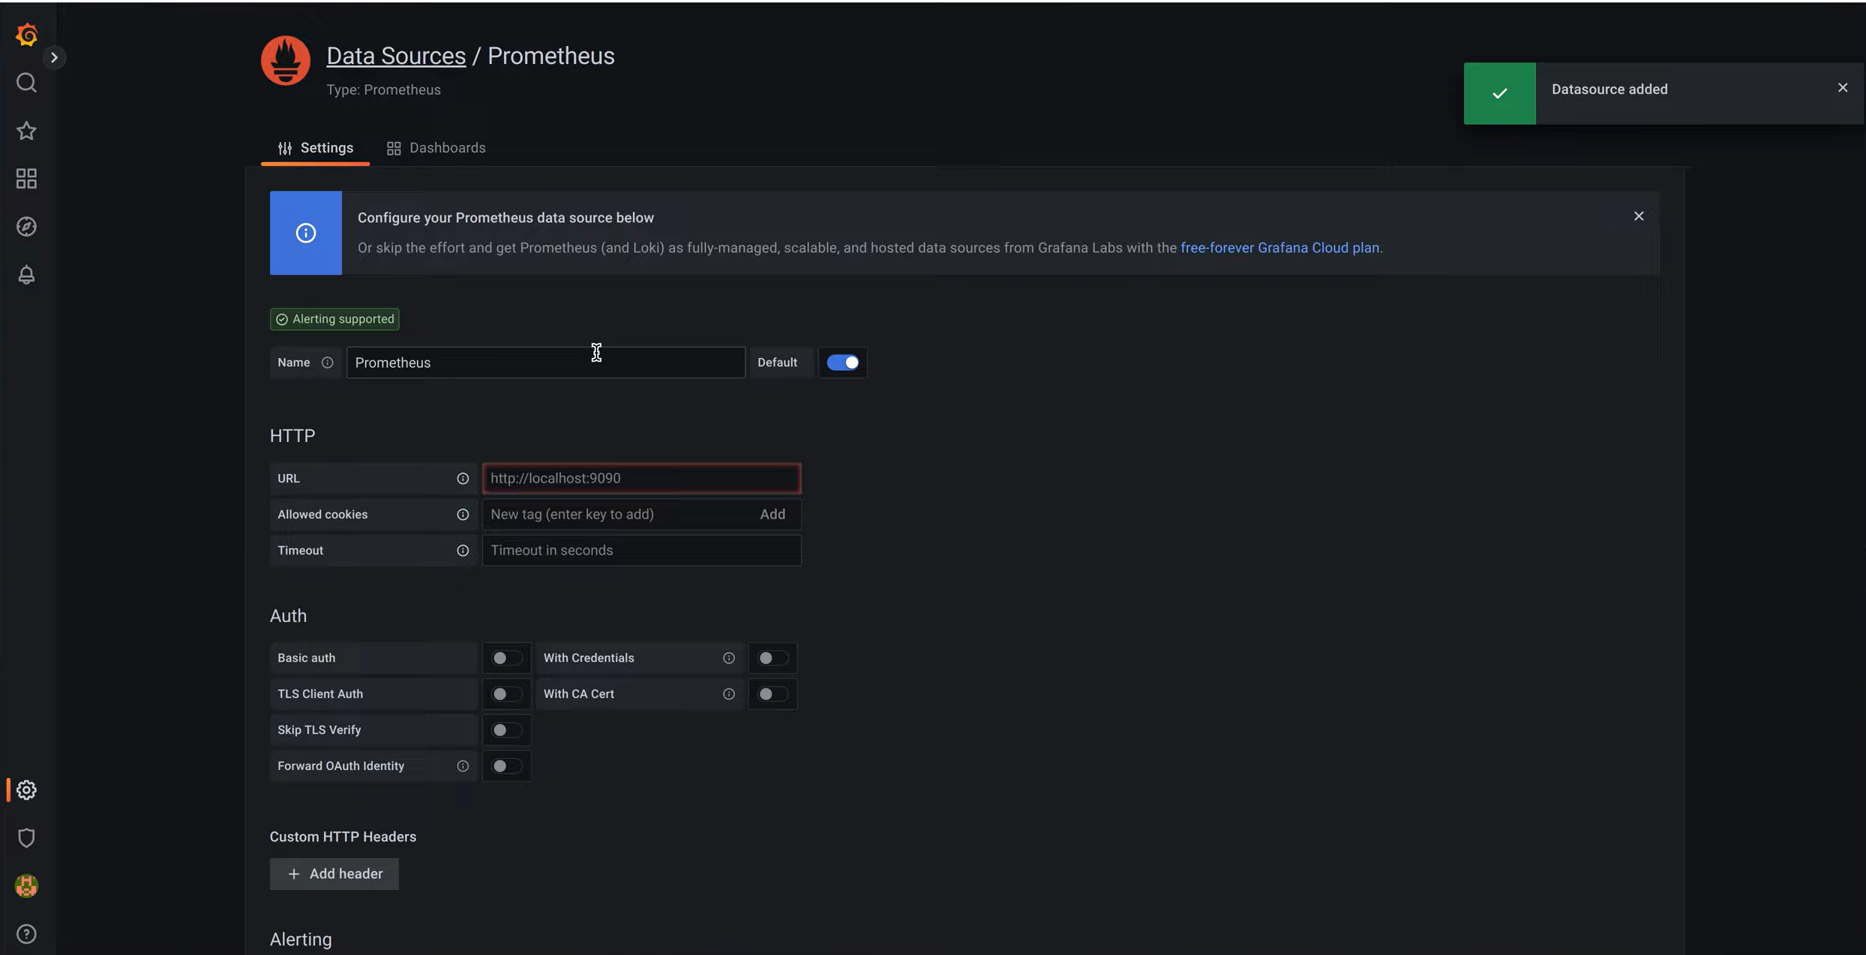
Step 3: Then create a new Dashboard and give it any name you like. You will be taken to the Edit Panel.
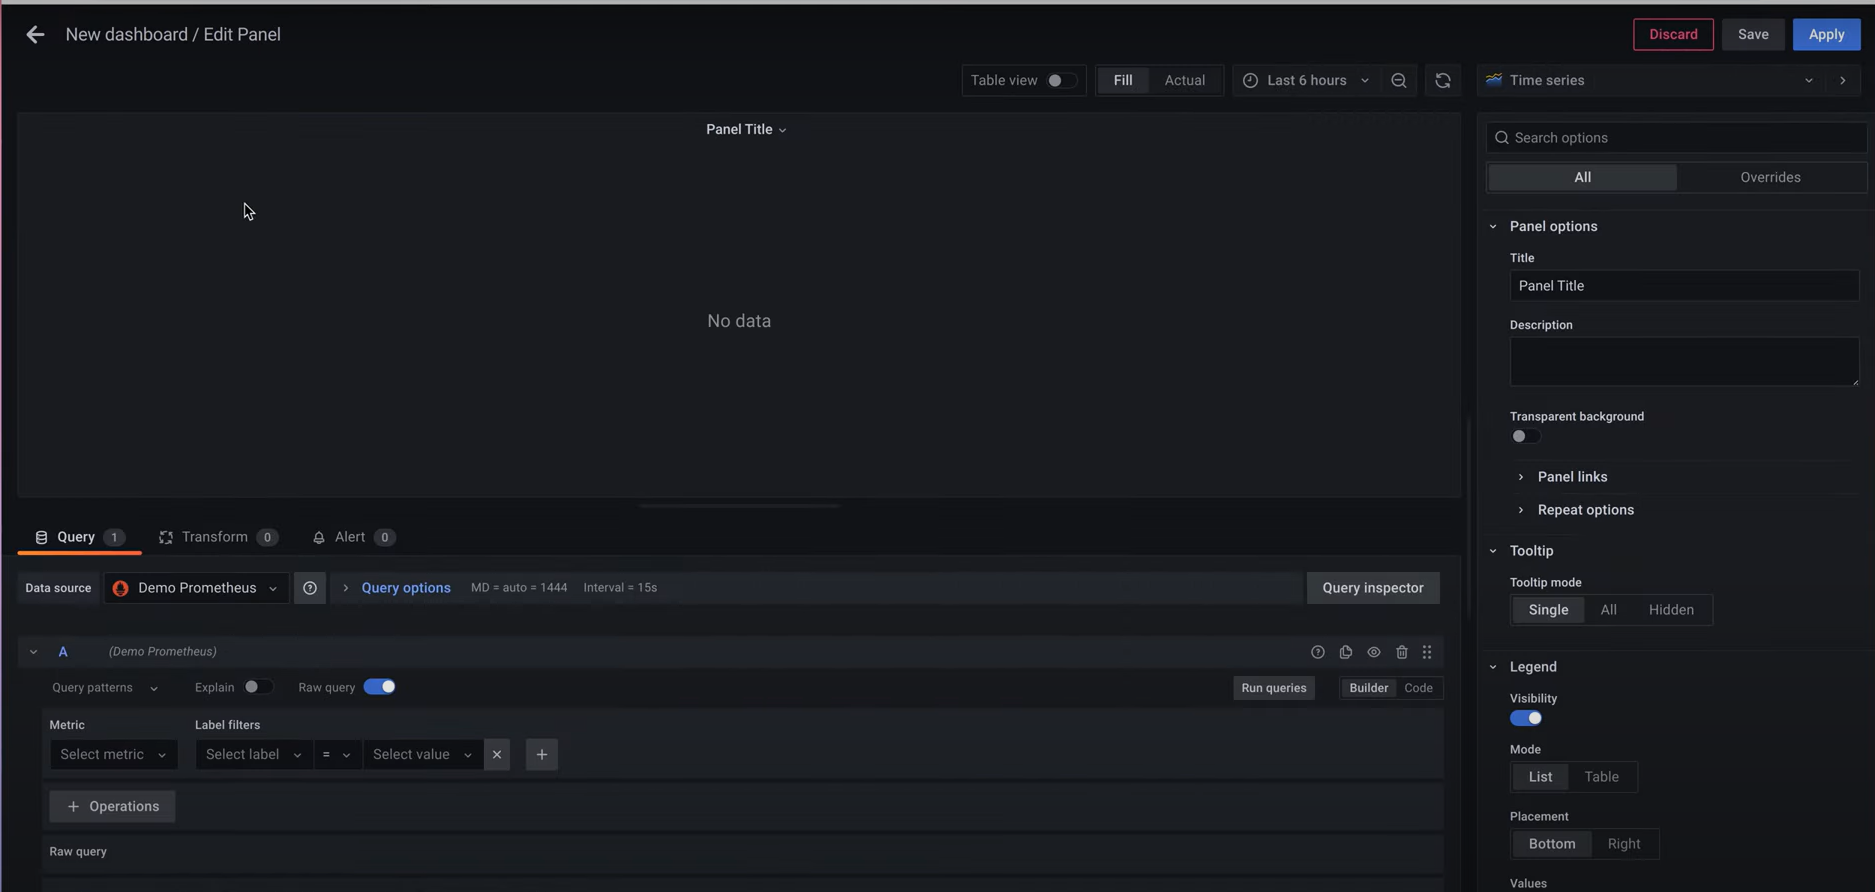
Step 4: The Metrics Browser allows you to enter the Metrics you want to monitor. Check the Scheduler Heartbeat, so try entering the following command:
rate(airflow{host="airflowStatsD",
instance="host.docker.internal:9123", job="airflow", metric="scheduler_heartbeat"}[1m])
A Chart (in this case a time series) is generated for the above command and the chart is updated every minute (indicated by 1m).
You can also format the chart with panel options by giving the chart a Xaxis Name and Title.
Challenges in Airflow Monitoring
Apache Airflow excels at orchestration, which is exactly what it was designed to do. However, without some finessing, Airflow Monitoring can be difficult to handle. It is difficult to keep track of airflow mostly because of three interconnected reasons:
1) No Data Awareness
Airflow has views into task status and execution time but doesn’t provide visibility into the flow of data through the DAGs. A transformation can fail; a column is missing or some incorrect transformations aren’t throwing an alert, so the data consumers get stale and incomplete data.
2) Limited Monitoring and Alerting Capabilities
Airflow is rather minimalist in terms of offering basic operational metadata while having only simple alerts, but it does not provide full monitoring features. Tracking data quality and trends requires operational dashboards, which are introduced by adding data quality listeners such as Deequ or Great Expectations to DAGs.
3) Complex Integration with Operational Workflows
When multiple environments of Airflow are monitored across teams, it gets really complex, where alerts, dashboards, and logs are all over the place, making it really hard to get a view, thus delaying issues as they take time to be detected and remedied.
Conclusion
This article has given you an understanding of Apache Airflow, its key features along with a deep understanding of Airflow Monitoring. You are now ready to start monitoring your Airflow Tasks. In case you want to integrate Data into your desired Database/destination, then Hevo Data is the right choice for you!
While Airflow is a good solution for Data Integration, It requires a lot of Engineering Bandwidth & Expertise. This can be challenging, resource-intensive & costly in the long run. Hevo offers a much simpler, scalable, and economical solution that allows people to create Data Pipeline without any code in minutes & without depending on Engineering teams.
Want to take Hevo for a spin? Sign up for a 14-day free trial. You may also have a look at the amazing Hevo price, which will assist you in selecting the best plan for your requirements.
Share your experience understanding the concept of airflow monitoring in the comment section below!
Share it with your connections.
-
 Share To LinkedIn
-
 Share To Facebook
-
 Share To X
-
 Copy Link