Databricks Lakehouse is an open data management architecture which combines the scalability, cost-effectiveness, and flexibility of data lakes with the data management and ACID transactions of data warehouses. Databricks Lakehouse is the best of both worlds of data lakes and data warehouses. It enables machine learning and business intelligence on all data with more reliability.
It allows organizations to store all types of data—structured, semi-structured, and unstructured—within a single platform, making it easier to manage and analyze large volumes of data. This article discusses Databricks Lakehouse monitoring, why it is important, and how to set up Databricks Lakehouse monitoring.
Table of Contents
What is Databricks Lakehouse Monitoring?
Databricks Lakehouse Monitoring tracks and manages the usage, performance and costs of workloads and data. It allows you to check the statistical attributes and data quality of all your account’s tables. It helps to observe the flow of data, resource usage and key metrics. Additionally, it can be used to monitor inference tables containing model inputs and predictions to track the performance of machine-learning models and model-serving endpoints.
Importance of Databricks Lakehouse monitoring
It’s important to use Databricks Lakehouse monitoring as it can help in many ways. To derive relevant insights from your data, you must be confident in its quality while also implementing cost optimization strategies. Monitoring the data gives quantitative metrics that help you to track and confirm that the quality is good and the data is consistent over time.
When you notice changes in your table’s data distribution or the performance of its accompanying model, the tables provided by Databricks Lakehouse Monitoring can capture and alert you to the change, as well as assist you in determining the cause. The graphs help you analyze the changes over time. Databricks Lakehouse monitoring also ensures that the analytics and data pipelines are providing good-quality results and are working correctly.
Are you looking for ways to connect Databricks with Google Cloud Storage? Hevo has helped customers across 45+ countries migrate data seamlessly. Hevo streamlines the process of migrating data by offering:
- Seamlessly data transfer between Salesforce, Amazon S3, and 150+ other sources.
- Risk management and security framework for cloud-based systems with SOC2 Compliance.
- In-built transformations like drag-and-drop to analyze your CRM data.
Don’t just take our word for it—try Hevo and experience why industry leaders like Whatfix say,” We’re extremely happy to have Hevo on our side.”
Get Started with Hevo for FreeSetting up Databricks Lakehouse Monitoring
Setting up monitoring on databricks involves a few steps. Here is a simple setup guide:
- Start by logging in to Databricks account.
- In the catalog, inside a workspace, navigate the table on which you want to set up lakehouse monitoring. If there is no table, we can create a table with dummy text for learning purposes.
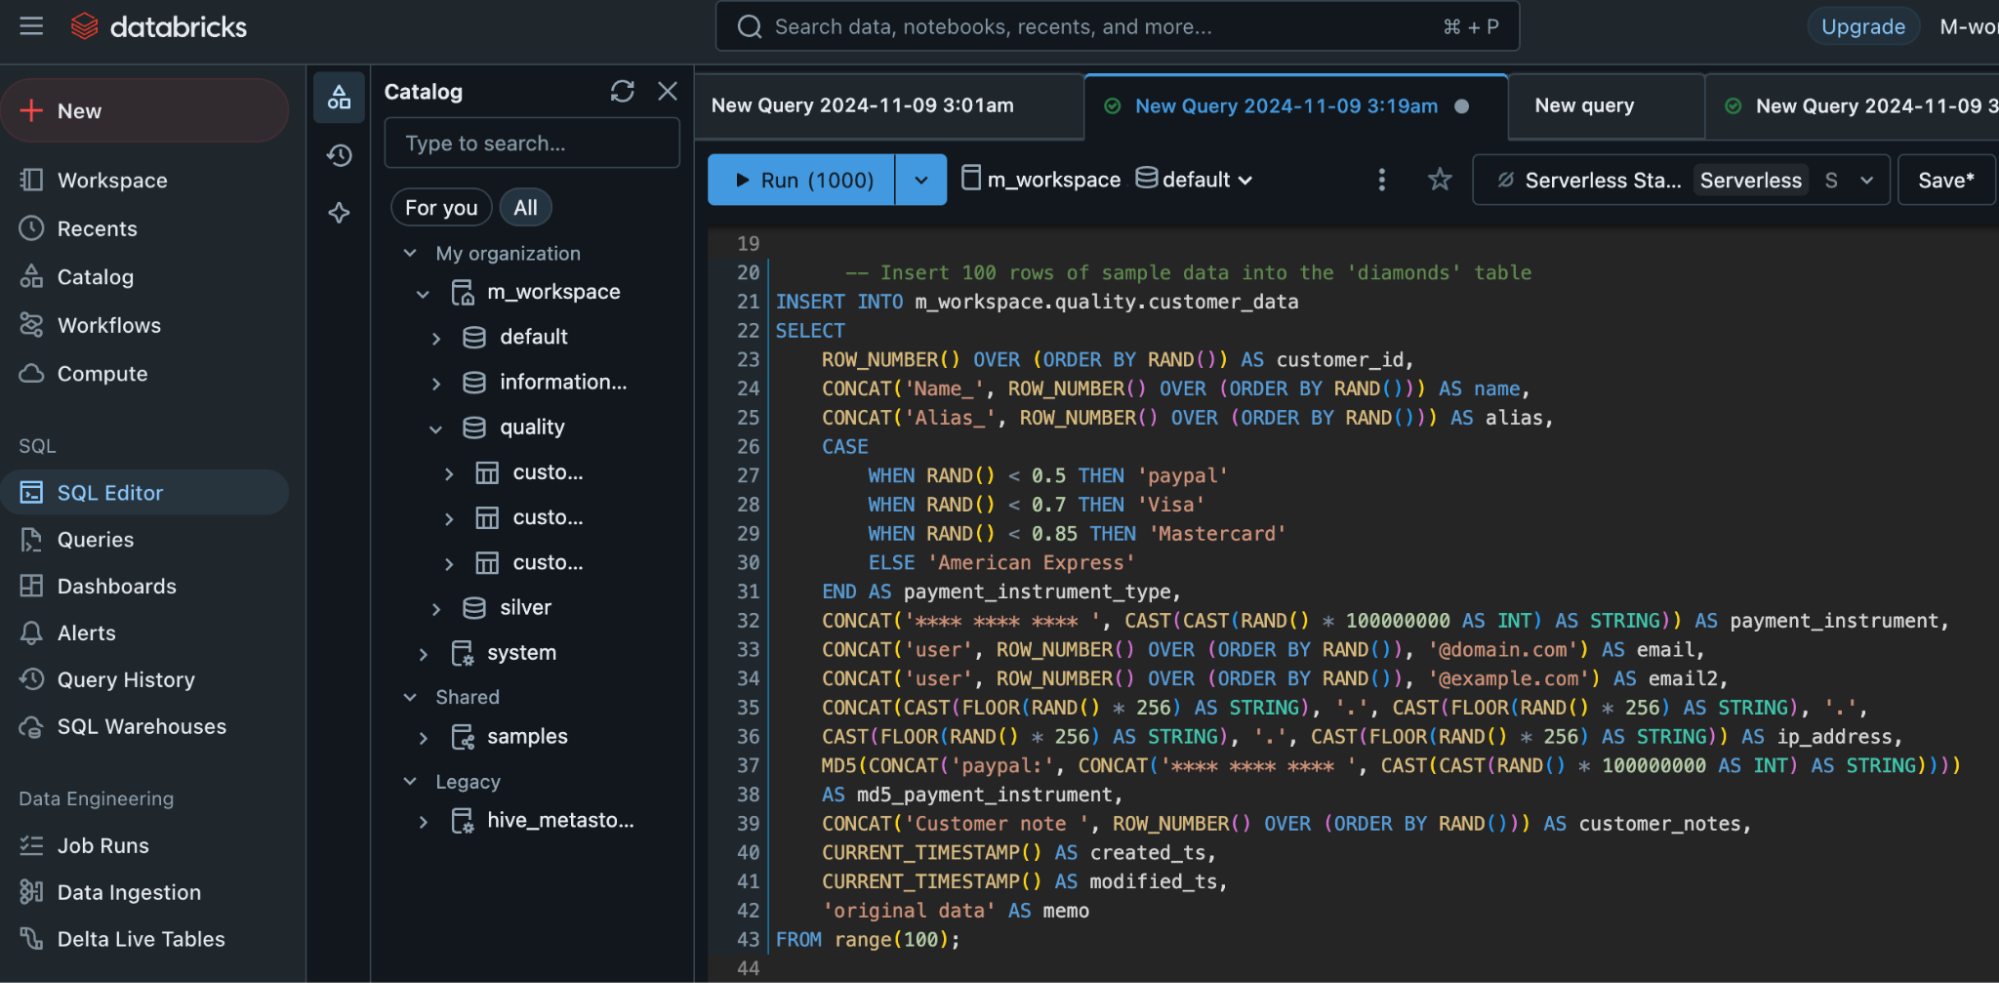
- Let’s start by creating a new table. The following screenshot shows the SQL statement that creates a table called customer_data inside the m_workspace. quality schema if it does not already exist.
- As you can see, we have structured the table so that it can store various types of customer-related data, including customer_id, name, email, payment_instrument_type, ip_address, customer_notes, and some other attributes.
- While creating the table we have also defined the data types for each column clearly, for example, customer_id is stored as a BIGINT, name is stored as STRING, customer_notes is stored as a STRING , created_ts and modified_ts are stored as timestamp columns.
- The columns created_ts, and modified_ts help in tracking the creation and modification dates of each record in the table. These timestamps then further help to analyze the change in data overtime.
- For the storage format of the table, we have used Delta to make sure that it complies with the ACID (Atomicity, Consistency, Isolation, Durability) properties for scalable data storage.
Improve your monitoring by utilizing materialized views.
The following screenshot shows the databricks platform and creates a query for the table.

After creating the table, we need to insert data. We will start by inserting dummy data just for learning purposes.
- The data is generated for 100 rows using the range(100) function to create a virtual table of 100 rows. We can repeat this code to add more rows as needed.
- The
INSERT INTOstatement is used to insert 100 rows of sa - mple data into the customer_data table.
- The
SELECTquery generates synthetic data for each column. - The
ROW_NUMBER()function is used to create a unique customer_id for each row, - And the
CONCATfunction generates values for other columns like name, alias, and email. - The
CASEstatement randomly assigns a payment method type, such as ‘paypal’, ‘Visa’, ‘Mastercard’, and ‘American Express’. - For the payment_instrument, a randomly generated number is created as a pseudo-credit card number.
- Random email addresses and IP addresses are also generated using
RAND()and theCONCATfunction. - A hashed value of the payment instrument is created using
MD5(). - Additionally, the current timestamp is applied to the created_ts and modified_ts columns, and a default string ‘original data’ is inserted into the memo column.
- The data is generated for 100 rows using the range(100) function to create a virtual table of 100 rows. We can repeat this code to add more rows as needed.
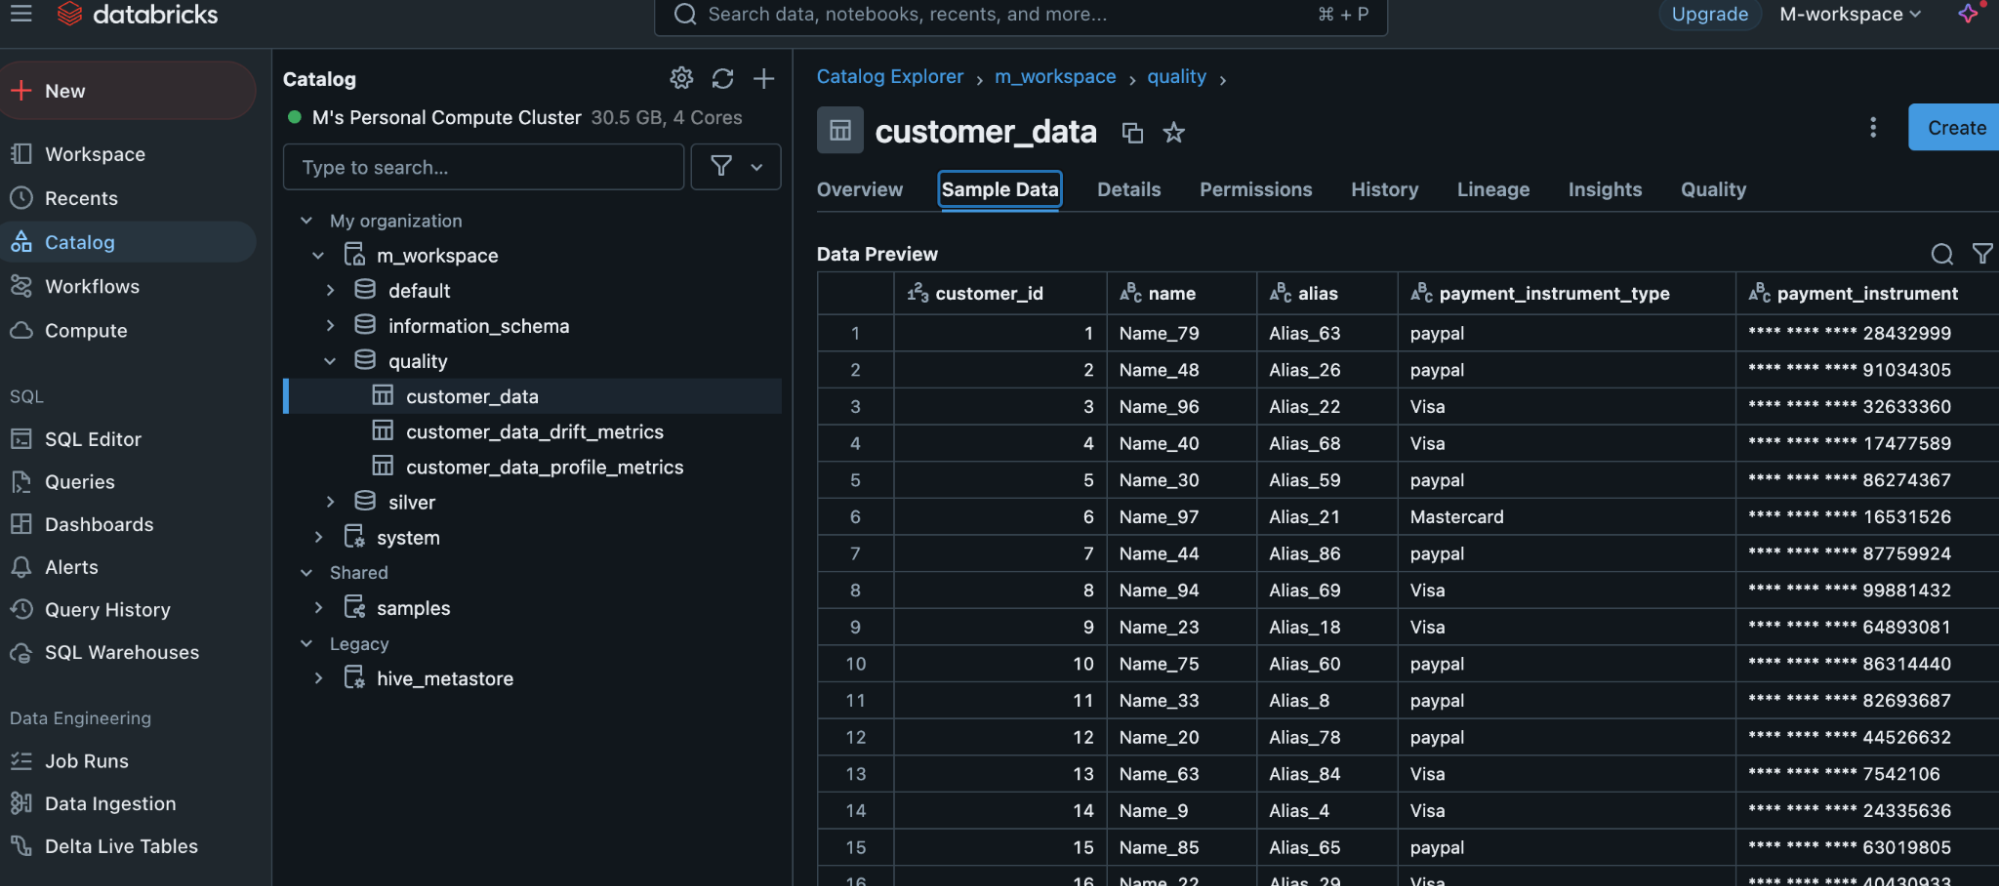
The following screenshot shows sample data that is in the table.
Two methods can be used to create a monitor. You can create a monitor using databricks UI or API.
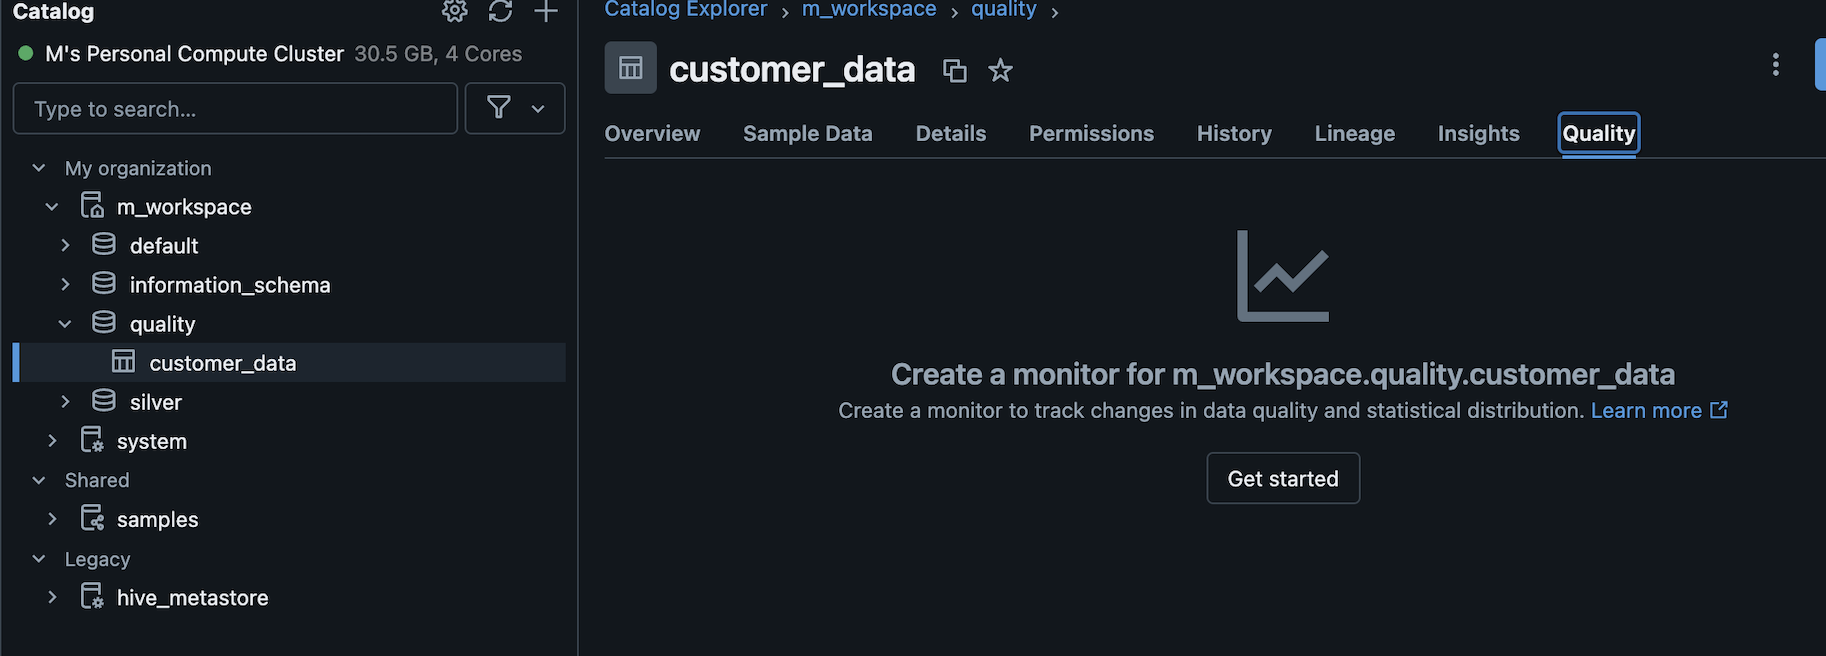
In this article, we will create a monitor using Databricks UI. Now, go to the quality tab in the chosen table. After this click the ‘Get started’ button. In ‘create monitor’ choose the options you want to set up the monitor.
There are three types of profiles that you can choose from in order to create the monitor. You can either choose time series, inference or snapshot.
- Time series profile is used for tables that have values that are measured throughout time, and it contains a timestamp column.
- Inference Profile is used for tables with anticipated values generated by a machine learning classification or regression model. This table contains a date, a model ID, model inputs (features), model predictions, and optional columns for unique observation IDs and ground truth labels. It may also include metadata, such as demographic information, that is not utilized as input to the model but could be relevant in fairness and bias investigations or other monitoring.
- Snapshot Profile is used for any table maintained by Delta, including external tables, views, materialized views, and streaming tables.
In this article, we will choose a snapshot profile to create the monitor.
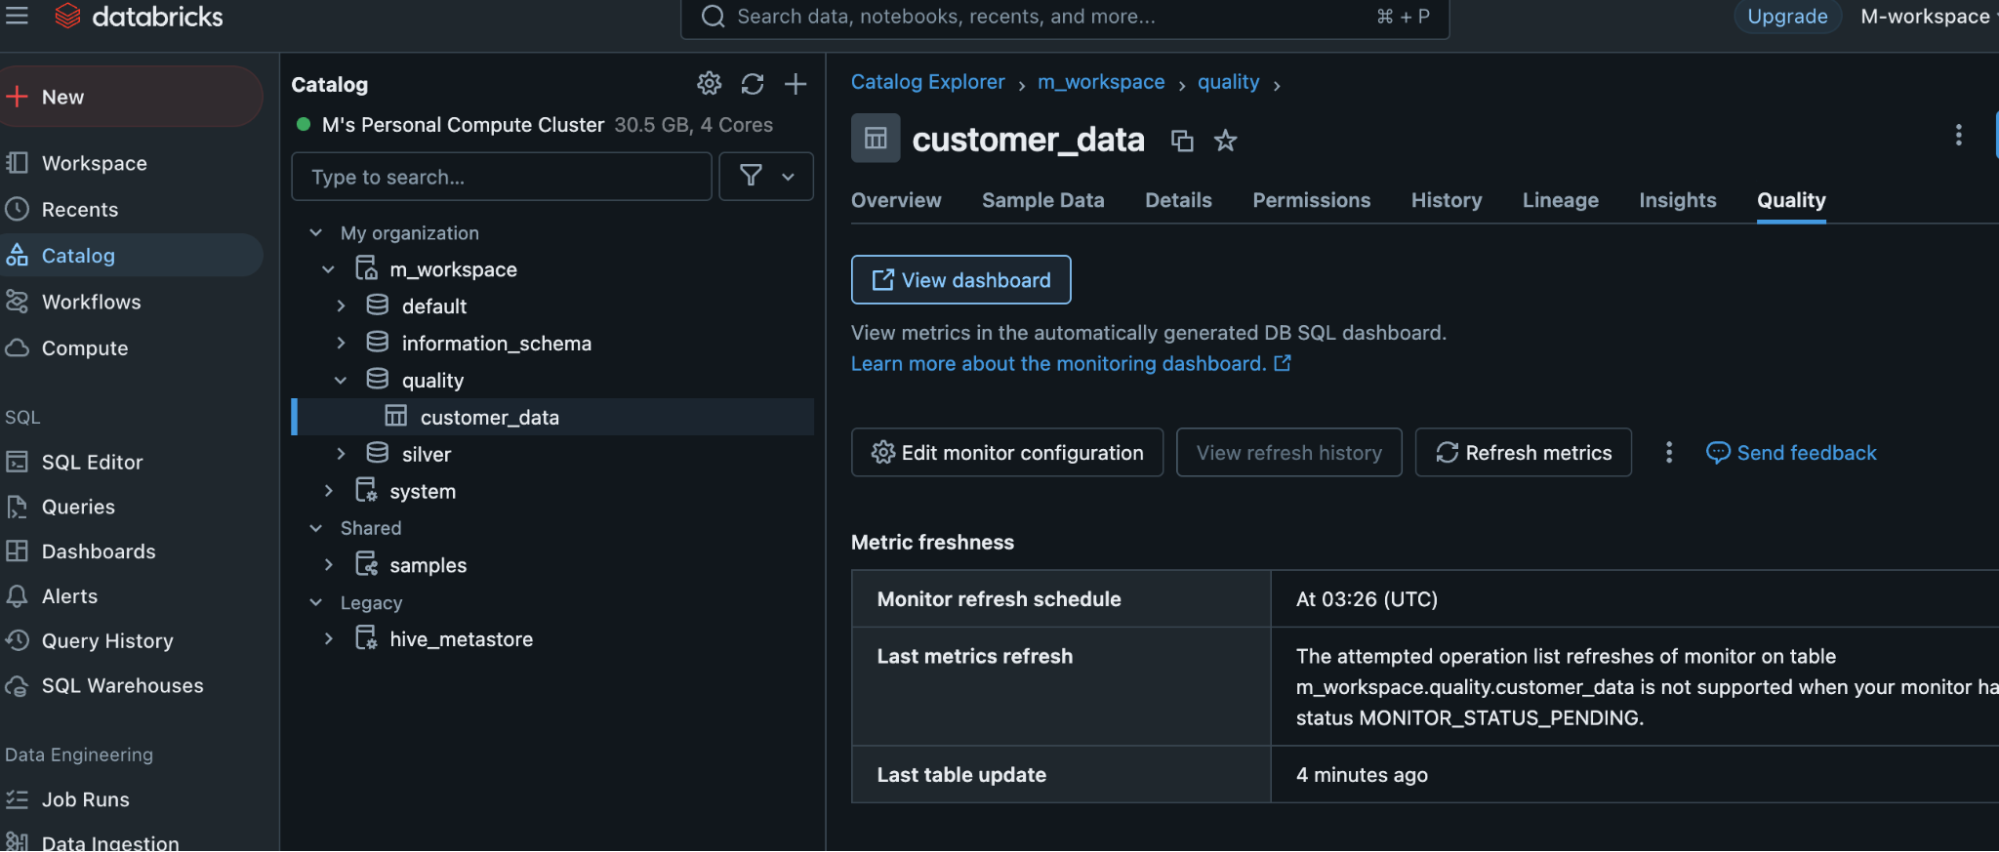
Click the ‘View Dashboard’ button to see the dashboard.
The Databricks Lakehouse Monitoring Dashboard displays detailed information about the data’s health, quality, and pipeline performance. It assists users in ensuring that data is correct, full, and up to date by monitoring critical parameters like data quality and drift. The dashboard identifies anomalies in real-time, allowing teams to preserve consistent data for analysis. Tracking data completeness, quality, and consistency is critical, as is monitoring changes in data format and content over time. It also checks pipeline performance metrics, including throughput, latency, and failure rates, to ensure that data is processed efficiently.
The dashboard displays metadata, data freshness, and business-level KPIs, creating a clear view of how data quality affects operations. Users can receive notifications and messages when data quality or pipeline performance metrics are reached. The dashboard employs a variety of visualizations, including time series graphs and heatmaps, to portray trends and anomalies in an intelligible manner. This enables teams to immediately identify possible errors and take corrective action, maintaining data integrity for decision-making and downstream processes.
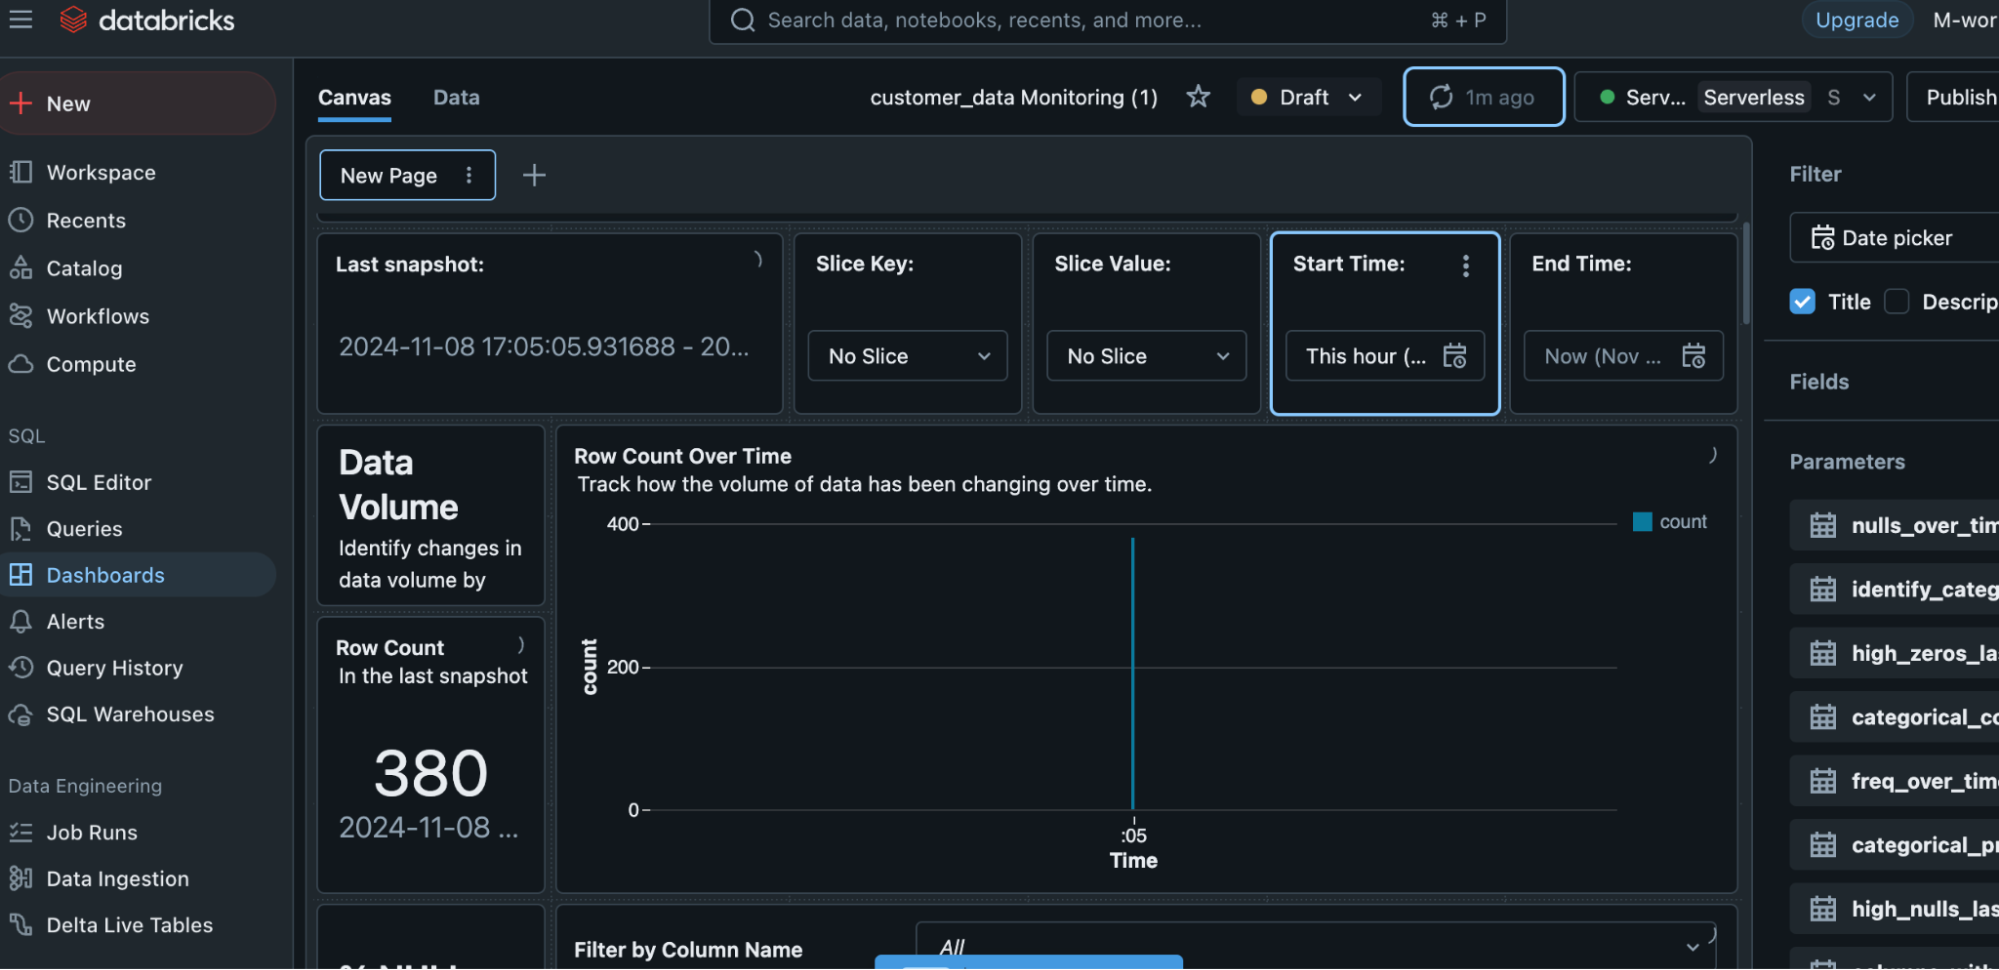
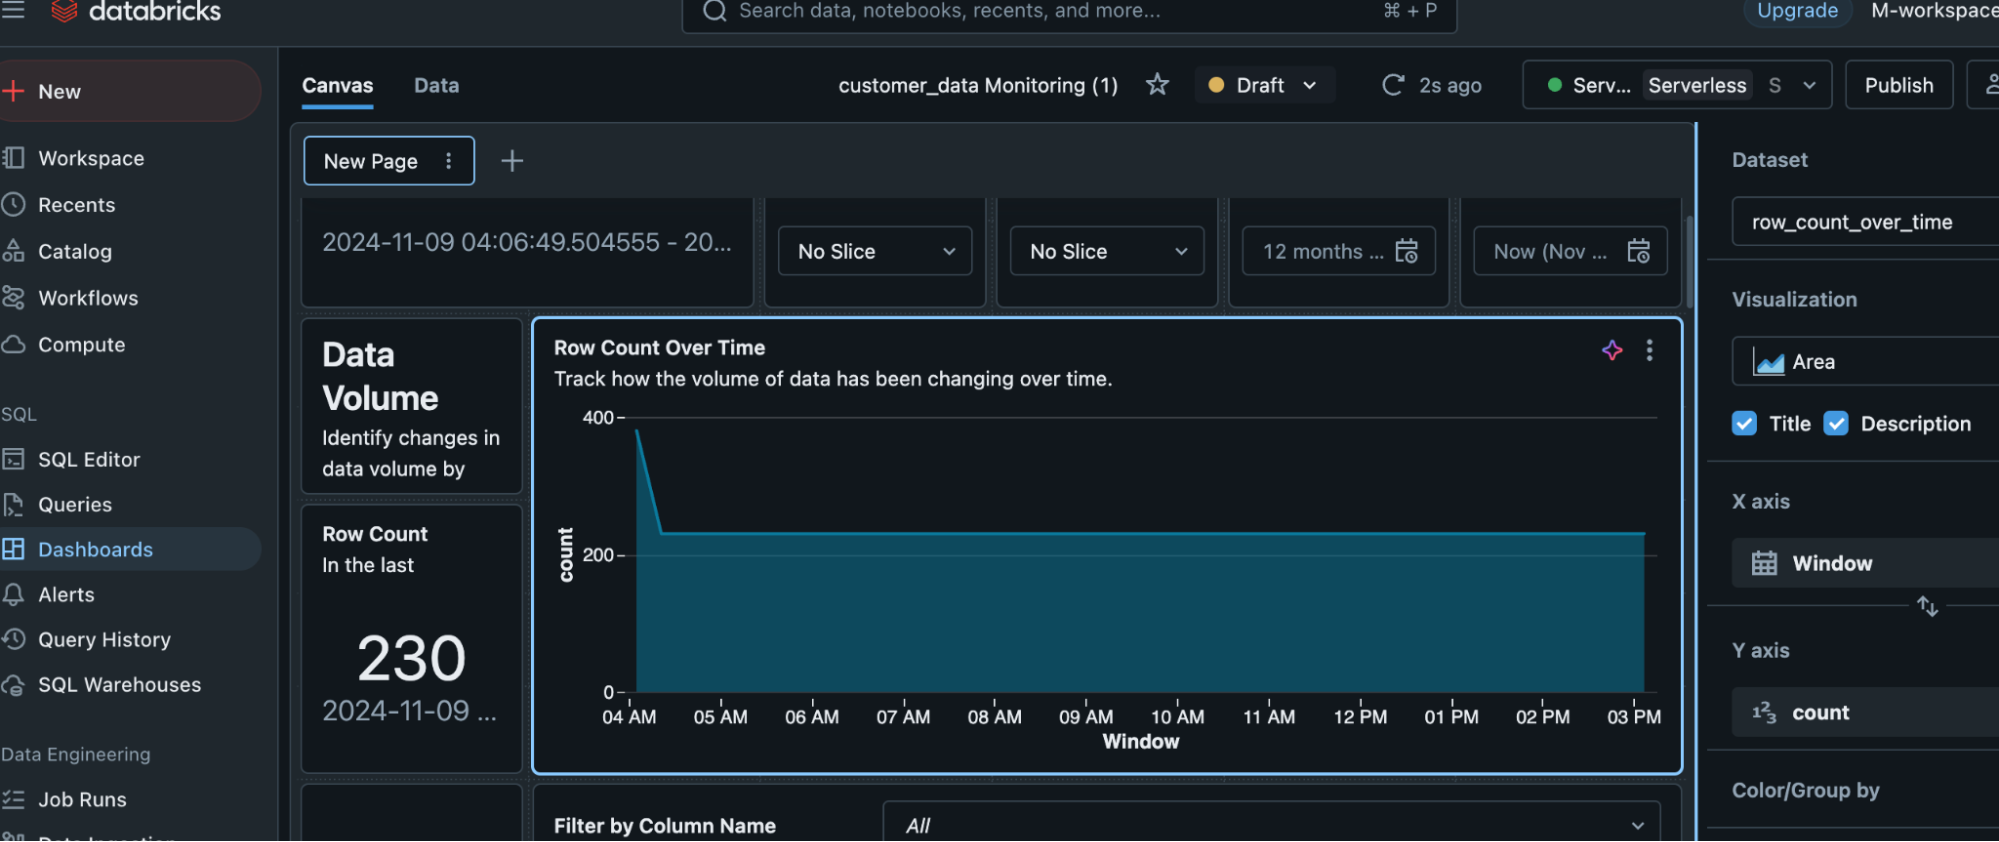
The overtime change will show up here in the graph. For example, if we remove some rows after some time, then it will show the change. After removing 150 rows, the count comes down from 380 to 230. This change reflects on the dashboard. It shows that the row count is 230, and the graph shows overtime change.
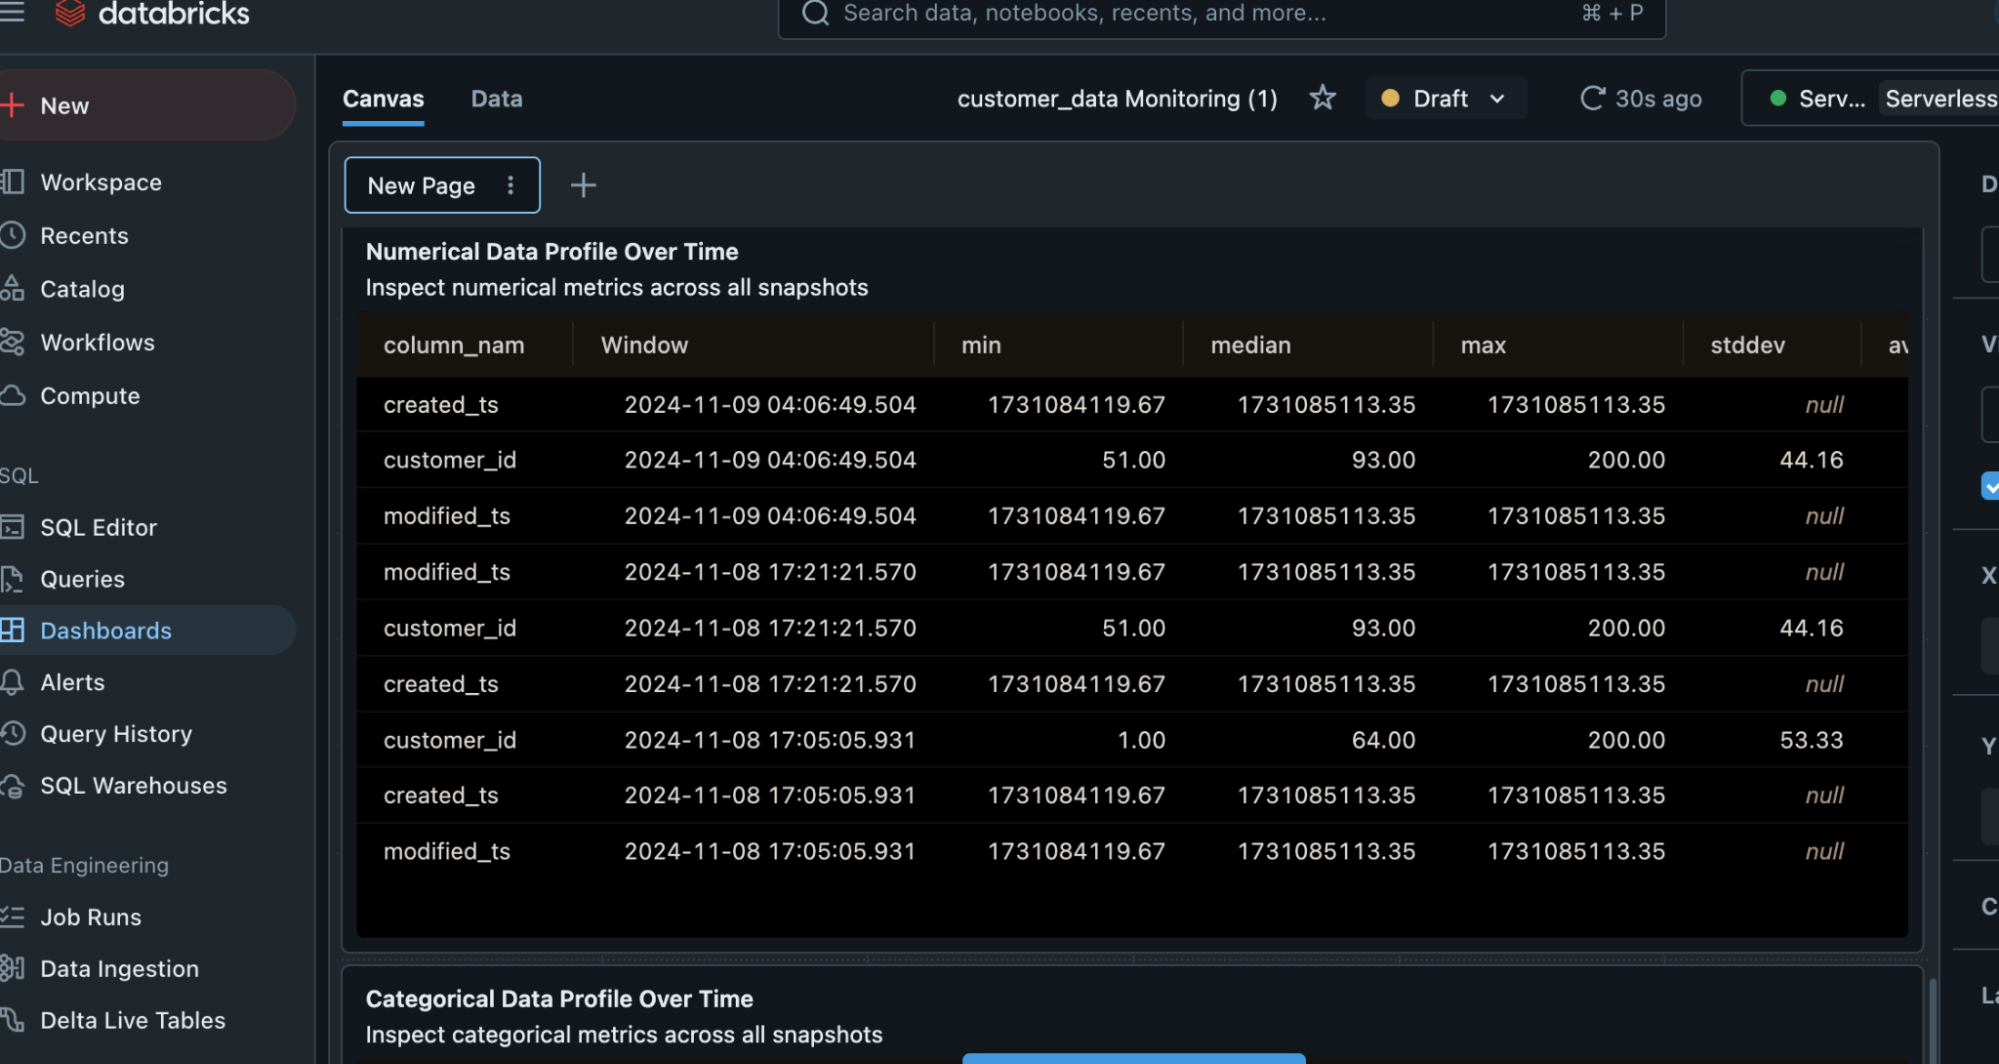
Numerical and categorical profile data is also shown in the dashboard along with other metrics.
Conclusion
Databricks Lakehouse Monitoring presents real-time information about the health and performance of data and data pipelines in a Lakehouse architecture. It monitors critical parameters such as data quality, completeness, and pipeline performance, helping teams to detect and resolve issues such as missing data, schema changes, and pipeline failures before they affect analytics. One of the monitoring solution’s main benefits is its capacity to detect data drift, which indicates changes in data patterns or quality. It also monitors data quality indicators such as null values and discrepancies. You can set up the monitoring dashboard to help maintain high-quality, dependable data pipelines by enhancing decision-making.
Learn how Autoscaling in Databricks complements Lakehouse monitoring by ensuring efficient resource management for seamless operations.
Tools like Hevo make monitoring data pipelines easy while keeping it updated with data flow in real-time into your Databricks Lakehouse. Try a 14-day free trial and experience the feature-rich Hevo suite firsthand. Also, check out our unbeatable pricing to choose the best plan for your organization.
FAQs
1. What is lakehouse monitoring in Databricks?
Lakehouse Monitoring in Databricks monitors the performance along with resource utilisation, and costs of data processing, storage, and analytics. It guarantees that data workflow function is smooth and assists in spotting problems or bottlenecks early on.
2. How to monitor Databricks cost?
The built-in Cost Management function in Databricks allows you to keep track of your costs. It gives data on resource utilisation across clusters and workspaces, allowing you to manage and optimize your spending.
3. What is an inference table in Databricks?
An Inference Table in Databricks is a table used to make predictions or run machine learning models. It stores the model’s processed data and can be used to do real-time or batch inference on new data inputs.


