

These days, industries rely heavily on Visualization and BI tools to extract meaningful information from their massive data pool to understand market aspects. Visualization tools can help users derive meaning from the data, thus allowing them to make data-driven decisions.
In this Looker vs Tableau showdown, we will be taking a glimpse at the 4 key differences, giving you an idea of what each tool does, and in what all use cases we found them indispensable. This will allow you to make an educated decision about the tool to pick, based on your business requirements and use cases.
Table of Contents
What is Looker

Looker is a powerful Data Analytics and Visualization platform that enables companies to extract critical information from the data and create appealing visualization to gain better insights. Looker is a browser-based interactive platform that makes collecting, visualizing, and analyzing data easy. Looker is simple to use and offers a unique modeling language and various graphs and charts to choose from.
Looker is a data discovery platform that helps almost all organizations extract values from the data and analyze real-time data to build commercial enterprise solutions. Looker has adequate support for huge data volume and can be analyzed in the Looker database and browser-based platform. Looker allows users to choose, customize and develop a variety of interactive dashboards with the help of available graphs and charts.
Key Features of Looker
- Looker offers great customization in terms of choosing pricing plans, deploying dashboards, and many more.
- Looker has an intuitive dashboard and provides a vast visualization library to choose various visualization options like charts, clouds, diagrams, heatmaps, etc.
- Looker also integrates with Big Data platforms and databases, and there is no need to extract data from the databases. It can perform analytical queries directly on the database.
- Looker offers an SQL-like language known as LookML to perform analytical operations on the data.
- It has excellent customer support, and technical support available through chat and email.
Are you looking for an ETL tool to migrate your data in one location to perform analytics? Migrating your data can become seamless with Hevo’s no-code intuitive platform. With Hevo, you can:
- Automate Data Extraction: Effortlessly pull data from various sources and destinations with 150+ pre-built connectors.
- Transform Data effortlessly: Use Hevo’s drag-and-drop feature to transform data with just a few clicks.
- Seamless Data Loading: Quickly load your transformed data into your desired destinations, such as BigQuery.
- Transparent Pricing: Hevo offers transparent pricing with no hidden fees, allowing you to budget effectively while scaling your data integration needs.
Try Hevo and join a growing community of 2000+ data professionals who rely on us for seamless and efficient migrations.
Get Started with Hevo for FreeWhat is Tableau?

Tableau is a very efficient Data Visualization tool to perform data analysis over substantial data sets and is widely used by data analysts, scientists, etc. Tableau provides easy drag and drops features to add dimensions, metrics, charts, graphs which makes it easy for customers to analyze the data without any difficulty.
Tableau is a widely used Business Intelligence tool in the current market. Its popularity is due to its capability of handling Big Data and is relatively simple to deploy, learn and use. Tableau generates insights from the raw data and creates a visual masterpiece for businesses to make data-driven decisions.
Key Features of Tableau
Here is a list of key features of Tableau that make it such an indispensable tool:
- Tableau Dashboard: Tableau dashboard has an intuitive dashboard with self-explaining wizards, allowing non-technical users to create visualization easily. Dimensions, charts are simple drag and drop on drawing space to perform analysis.
- Collaborative Sharing: Tableau allows users to collaborate with their peers for collaborative work or review. Users can also share to the cloud, which makes the dashboard accessible from anywhere.
- Data Sources in Tableau: Tableau has more than 200+ connectors that help users connect to external data sources like RDBMS, Cloud, spreadsheet, etc., securely. Tableau also provides several monitoring features such as data connectivity, auto-refresh, etc.
- Advanced Visualizations (Chart Types): Tableau has a vast collection of advanced visualization techniques namely graphs, maps, tables, and charts.
If you wish to make more sophisticated visualizations you can leverage Tableau’s advanced methods to visualize data as follows:
- Area Chart
- Bar Chart
- Box-and-whisker Plots
- Bubble Cloud
- Bullet Graph
- Cartogram
- Dot Distribution Map
- Heat Map
Points to Consider While Deciding Between Looker and Tableau
While deciding on one data visualization from Looker vs Tableau for your organization, one should keep note of the following things listed below:
- The size of your company
- Your existing infrastructure and which from the Looker vs Tableau fits in it
- Your Data Analytics and Visualization needs
- Types of Charts, Graphs, and dashboards that suit you team to collaborate
- Types of access you need and where the data is stored, Cloud or On-premise.
Looker vs Tableau: Key Differences
Looker and Tableau are both excellent in terms of their Data Visualization capabilities. However, you can distinguish them on the basis of a few factors. Here are a few factors you can keep in mind to compare Looker vs Tableau:
- Looker vs Tableau: Features
- Looker vs Tableau: Implementation
- Looker vs Tableau: Customer Service and Support
- Looker vs Tableau: Pricing
Looker vs Tableau: Features
Looker: Looker has a language called LookML to perform data modeling, a similar yet better way to write SQL and define the query. Looker allows users to develop models that enable non-business users to scan SQL databases to analyze the data. Looker API will allow users to integrate different applications such as Google Doc, Excel, and other third-party applications. Looker has easy-to-build dashboards that are accessible from any device. However, it doesn’t support OLAP (Online Analytical Processing).
Tableau: Tableau houses hundreds of connectors to connect various sources that include OLAP, Big Data, NoSQL, and the cloud. Tableau can efficiently pull data from SQL servers for analysis. Tableau performs Data Manipulation and Data Preparation in a straightforward manner, but users need extensive training to perform these operations for the first time.
Tableau is very well supported for huge volumes of data and has various options to design, customize and develop dashboards accessible from anywhere.
Verdict: Both Tableau and Looker are very versatile in terms of dashboarding capabilities and data analysis. On doing feature analysis, we found that both tools have excellent capabilities to connect to SQL databases. However, Looker has more powerful SQL modeling capabilities and is easier to run. Users without prior experience in data analysis can easily use Looker. However, on the other hand, to use Tableau, users need to do extensive training.
Looker vs Tableau: Implementation
Looker: Looker is a browser-based development tool, and hence the deployment and implementation are much faster than other BI tools. Users with basic knowledge about performance can deploy Looker as it is available in a packaged jar file and can easily be deployed in systems by simple commands. Looker also allows users to deploy on their local systems for local development, which can be later moved to the customer’s server or Looker’s server.
Tableau: Tableau offers a variety of products with various implementation options. It comes with a quick-start option for easy deployment. However, enterprise-level deployment has to follow specific steps before making it available for users.
Verdict: Tableau can be an option for small-scale industries to take advantage of Tableau’s quick-start module. However, for more extensive deployment, Looker is easy to deploy than Tableau, which has a complicated four-step process.
Looker vs Tableau: Customer Service and Support
Looker: Looker has a comprehensive public help center containing documents, forums, and videos to help users solve most problems. It also has email support to help and provides training on its platform.
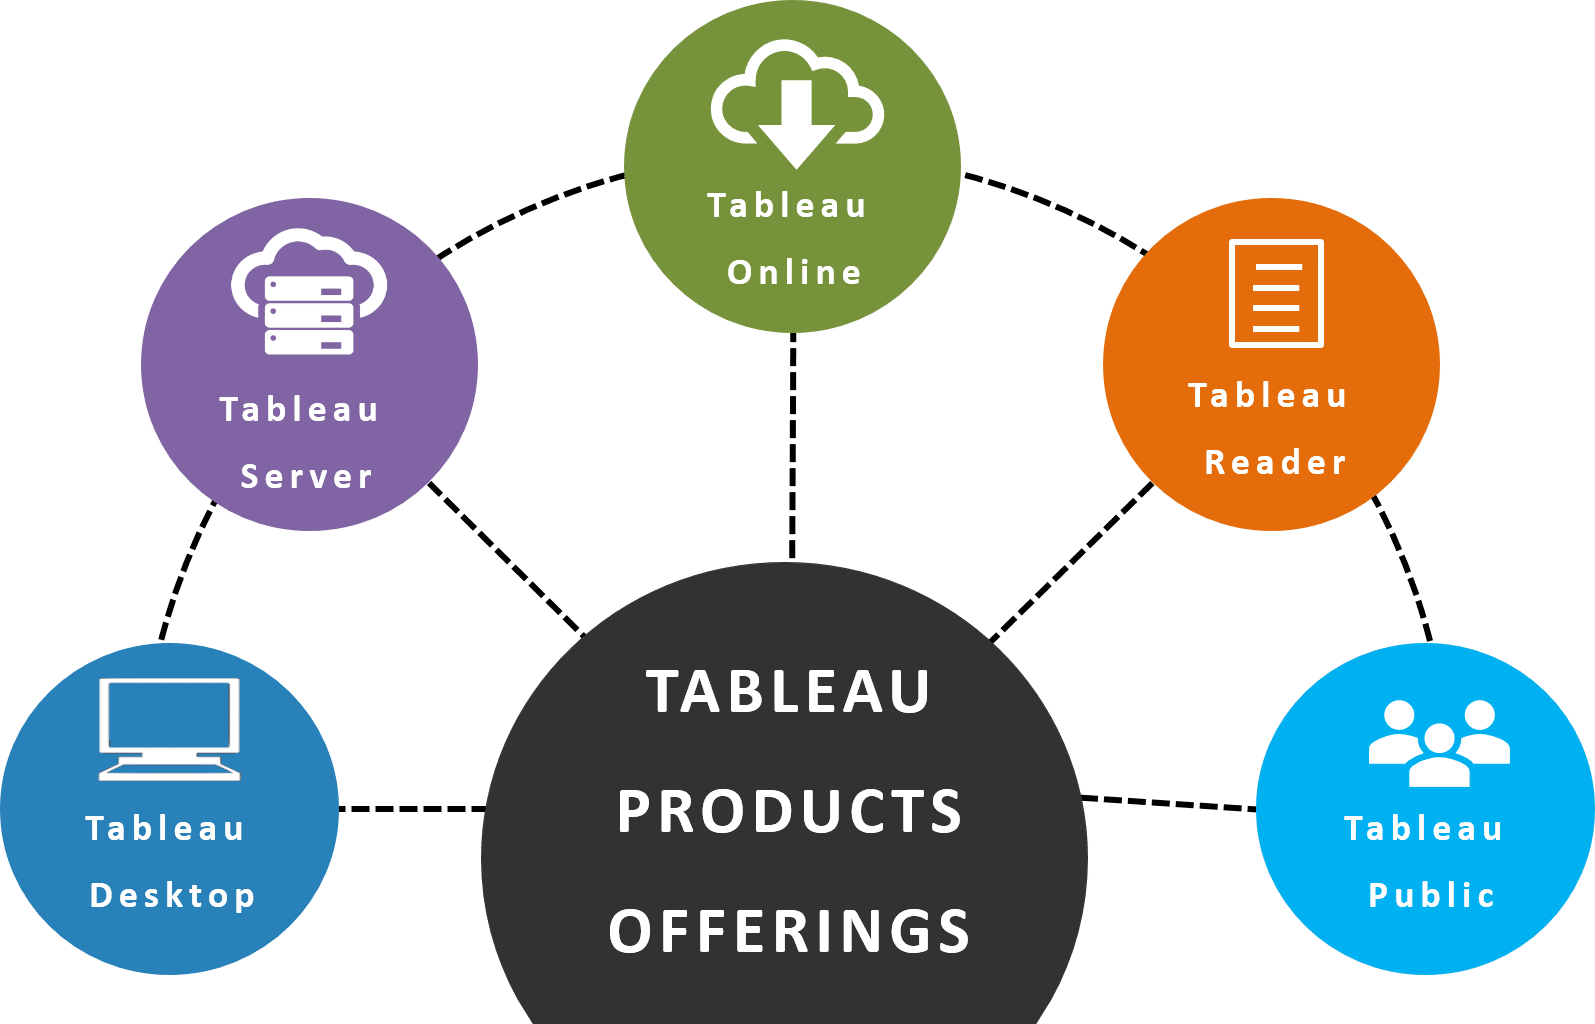
Tableau: Tableau offers a comprehensive knowledge-based category to cover its three main products: Tableau Desktop, Tableau Server, and Tableau Online. Users have to submit tickets via webform or customer portal and access support resources related to their software version. It also has a community that offers training, troubleshooting ideas, and many more.
Verdict: Both Looker and Tableau have excellent online support. However, Looker users can access technical support via chat; Tableau users need to contact private support portals for resolutions.
Looker vs Tableau: Pricing
Looker: Looker doesn’t have any standard pricing scheme; instead, it follows a customized approach. Users can discuss with Looker’s pricing specialist to discover the business requirement and offer excellent prices. Users can get a quote of pricing from here.
Tableau: Tableau has various subscription plans, and users are free to choose among them as per their needs. Prices are listed per user/month, which is then billed annually. The Creator plan, which includes full functionality, costs around $70 per user per month and can be deployed on-premise or in the cloud. You can find more information on Tableau pricing here.
Tableau offers a 14-day free trial to try and test before making a purchase.
Verdict: As Tableau has straightforward pricing plans, Looker appears to be more focused on cost customization needs and business requirements.
Here is a brief summary of the key differences between Looker vs Tableau:

Looker vs Tableau: Performance Comparison
Tableau’s appeal stems in part from its efficient use of system resources. It does not exceed the system’s memory limits and processes large amounts of data quickly.
Tableau is appealing to users for a variety of reasons, including its excellent functionality, support for large and diverse data sets, ability to handle a large number of concurrent users, and integration with virtually any infrastructure, including Windows and Macs. Tableau has a slight advantage over Looker in areas like report creation and data sharing.
Users give the Looker platform high marks for its overall functionality and performance. It is compatible with Windows, Mac OS X, and Linux. It works well with other enterprise software, such as analytics software.
Although some users complain about data load times and processing speed for ultra-large data sets, Looker generally makes good use of system resources. There have also been some reports of bugs in the dashboard and other parts of the app. The cloud BI space is one area where Looker easily outperforms Tableau. Because the application is cloud-native and specifically designed for cloud processing, it gives cloud-centric businesses more flexibility.
Looker vs Tableau: Comparing Security and Governance
The security and usage administration framework of the Tableau BI platform receives relatively high marks. Tableau offers a wide range of tools and features aimed at making security and account management easier. Control over authentication methods, various filters, and restrictions on row-level security availability are among them.
The platform also includes sandboxed extensions, network-enabled extensions, and a variety of other security features, such as encryption at rest. Tableau includes tools for defining and managing data and content in terms of governance. It can use Snowflake and Star schemas, as well as more complex multi-fact models.
The platform’s security and governance framework receive high marks from Looker’s user communities. Looker follows the security development lifecycle (SDLC), which includes static and dynamic scans as well as thorough code reviews.
Looker supports a variety of authentication methods, including two-factor authentication, LDAP, Google OAuth, and SAML. It includes IP whitelisting, AES 256-bit data encryption with TLS 1.2 between the database and the browser, filters for model-set security and user attributes, and various content security features for managing database and user security. The latter allows you to make content completely open, open with content restrictions, or completely closed. The platform also has robust governance capabilities. It complies with HIPAA regulations and offers robust support for GDPR and other data privacy laws.
Looker vs. Tableau: Ideal User Base
Both packages provide top-tier business intelligence capabilities, including broad and deep insights, rich visualisations, and robust reporting. Both BI solutions have a high level of security, support, and a large user base. Consider Tableau if your company would benefit from a highly powerful and user-friendly solution geared toward non-technical users.
Looker is likely to be more appealing if your business is more heavily focused on a data-science framework or cloud-based framework that incorporates Google (but extends outward to other services and applications).
Conclusion
In this article, two top BI tools were compared: Looker and Tableau on different aspects. Choosing a good and optimum BI tool that handles all business requirements is a callous process. However, this blog tried to make it a little bit easier for you by making the comparison between Looker vs Tableau against different factors.
Extracting complex data from a diverse set of data sources to carry out an insightful analysis can be a challenging task and this is where Hevo saves the day! Hevo offers a faster way to move data from Databases or SaaS applications into your Data Warehouse to be visualized in a BI tool such as Tableau or Looker. Hevo is fully automated and hence does not require you to code. You can try Hevo for free by signing up for a 14-day free trial. You can also have a look at the unbeatable pricing that will help you choose the right plan for your business needs.
Share it with your connections.
-
 Share To LinkedIn
-
 Share To Facebook
-
 Share To X
-
 Copy Link


