


Microsoft’s Power BI is a technology-driven Business Intelligence tool for analyzing and visualizing raw data to present actionable data. It brings together Business Analytics, Data Visualization, and best practices to assist organizations in making data-driven decisions.
The CALCULATETABLE Function switches the context in which the data is filtered and evaluates the expression in the new context. Any existing filters on each column used in a filter argument are removed and replaced with the filter used in the filter argument.
This article talks in detail about the DAX CALCULATETABLE Function and how it is used to create Power BI calculated tables. It also gives an introduction to Power BI and DAX.
Table of Contents
What is Power BI?

Power BI is a proprietary Business Intelligence tool designed for seamless Data Analytics and Data Visualization. It is a part of the Microsoft Power Platform. Power BI is one of the common tools used by organizations for analyzing their business data construct reports.
It comes with a collection of various in-built software services, apps, and connectors that deeply integrates with data sources to deliver immersive visuals, interactive reports, and generate insights. Power BI uses its advanced charts, graphs, and other visuals included with Machine Learning to easily extract valuable information out of data.
Power BI can also read data from XML files, CSV files, JSON format files, and even web pages, then convert raw data into interactive insights. It is available for Desktop, mobile, and on-premise servers. Users can create and share their reports with other Power BI users within the organization or partner companies. It can be used to create Power BI calculated tables and calculated columns.
Power BI Calculated tables were first introduced in Power BI Desktop’s September 2015 update. The name says it all: these are tables that have been calculated. Because these are in-memory tables, they are calculated using DAX. Power BI Calculated tables have numerous advantages, including the ability to use them for role-playing dimensions (for example having more than one date dimension in a model).
Free up your time by offloading routine data requests to Hevo Answers. Get instant insights, automate ad-hoc queries, and focus on high-impact analytics.
🔹 Natural Language Queries – Ask in plain English, no SQL needed
🔹 Instant AI-Powered Insights – Get accurate answers in seconds
🔹 Seamless Data Integration – Connect to Salesforce, Shopify, Google Ads & more
🔹 Enhanced Productivity – Reduce reporting workload, focus on strategy
Key Features Of Power BI
Some of the main features of Power BI are listed below:
- Supports API Integrations: Power BI allows developers to easily integrate with other applications and embed dashboards into other software using sample codes and APIs.
- Custom Visualization: Power BI offers custom visualization libraries support that allows users to visualize complex data with ease.
- AI Support: Users can easily perform Data Analytics using Artificial Intelligence. With the built-in AI support, users can prepare data, build Machine Learning models, and gain insights.
- Modeling View: With the help of Modeling View, Power BI users can slice and divide the complex data into simpler ones that help in better understanding the data, separate diagrams, and multi-select objects.
- Easy Sharing: Power BI makes it easier for users to easily share their reports within teams, or organizations ensuring full data protection.
- Hybrid Development: Power BI easily integrates with many 3rd party connectors, applications, and services widely used by organizations that allow users to connect to various data sources.
Click here to know more about Power BI.
What is DAX?
DAX (Data Analysis Expressions) is a Power BI functional language that uses a collection of Functions, operators, and constants to solve basic calculation and Data Analysis problems. Analysis Services, Power BI, and Power Pivot in Excel all use Data Analysis Expressions (DAX) as a formula expression language. In tabular data models, DAX formulas include functions, operators, and values that can be used to perform advanced calculations and queries on data in related tables and columns.
The DAX language was designed specifically for working with data models using formulas and expressions. Microsoft Power BI, Microsoft Analysis Services, and Microsoft Power Pivot for Excel are all products that use DAX. Tabular is the internal engine that runs all of these products.
Working in DAX improves the user experience by implementing functionalities such as Data Visualization, Data Importing, and Manipulation. Basic dashboard knowledge is sufficient for creating standard reports, but DAX is required to create sophisticated and insightful reports. The reports generated are highly intuitive and discerning, thanks to the numerous commands and measures that can be used under the DAX syntax. The calculated table formula in Power BI must return a table object. An existing model table can be duplicated with the simplest formula.
DAX is a formula language used in Power BI Desktop to work with relational data. DAX comes with a library of over 200 Functions, operators, and constructs, giving you a lot of freedom when it comes to creating formulas to calculate results for almost any Data Analysis task. Power BI Calculated tables are ideal for intermediate calculations and data that you want to keep in the model rather than calculating on the fly or as query results. For example, you could join two tables together using a union or a cross join.
It’s understandable to wonder why DAX is so important to master in order to work efficiently with Power BI. Well, as we’ve seen in previous tutorials, creating reports in Power BI using the data importing, transforming, and visualizing features is a breeze. To create a decent report with all of the available data, a user must have a basic understanding of Power BI Desktop. However, if you want to take your Power BI reports to the next level, you’ll need DAX. Using DAX you can create Power BI calculated tables.
Some of the Functions that either return a table or manipulate one that already exists in DAX are ADDCOLUMNS, CROSSJOIN, CURRENTGROUP, DATATABLE, EXCEPT, FILTERS, DISTINCT table, Table Constructor, UNION, VALUES, etc.
A DAX Function is a predefined formula that performs calculations on input values. A column reference, numbers, text, constants, another formula or Function, or a logical value such as TRUE or FALSE are all examples of arguments in a Function that must be in a specific order. Every Function does something different with the values in an argument. In a DAX formula, you can include multiple arguments.
To add a Power BI calculated table to your model, you can use a DAX formula. To create a new Power BI calculated table, the formula can duplicate or transform existing model data.
The majority of the time, you create tables by importing data from an external data source into your model. Power BI Calculated tables, on the other hand, allow you to create new tables based on data that has already been loaded into the model. Instead of querying and loading values into your new table’s columns from a data source, you define the table’s values using a DAX formula.
Key Features Of DAX
- Standard Functionality like Formulas in Excel: SUM, SUMIF, VLOOKUP, and other Excel formulas are familiar to most users. In Power BI, DAX provides similar formulas and additional functionality for all types of calculations. Nonetheless, Excel formulas operate on cells, whereas Power BI operates on tables and columns. For more information on each of the more than 200 Functions available in DAX.
- Simplicity: There is a learning curve to grasp the concepts and ideas of DAX, but it is doable, and after a short period, you will notice a structure and logic. It’s very simple once you’ve grasped these fundamental concepts.
- Solves Business Problems: Whenever you have a data problem in Power BI, there’s a good chance DAX will solve it. In DAX, you can perform a wide range of calculations, and you can always search for something DAX using a search engine or the Power BI community.
- Improves the Data Model: You must look after your underlying data model if you use DAX. Data Modeling is sometimes regarded as an art form, but once you grasp the fundamental concepts, such as dimensional modeling and star schemas, your data model’s maintainability will greatly improve.
- Time-intelligence Functions: These Functions aid in the creation of calculations involving calendars and dates. This allows you to make meaningful comparisons between periods (e.g. calculations of year-to-date, comparison with last period, previous month, etc.).
- Calculated Columns: Eventually, you’ll be in a situation where your data lacks a field that you require. Calculated columns can be used to define the value of a column, for example, by combining text values or calculating a numeric value from other values.
What is CALCULATETABLE FUNCTION?
CALCULATETABLE is a DAX Function that evaluates a table expression in a context that has been modified by the given filters. It returns a value table. It is used to create Power BI calculated tables. The table expression to be evaluated is expression>. It is not possible to use a measure as an expression. Power BI Calculated tables come at a price: they expand the model’s storage space and can slow down data refresh. The reason for this is that when calculated tables have formula dependencies on refreshed tables, they recalculate. External data cannot be connected to a Power BI calculated table; instead, you must use Power Query.
It uses a modified filter context to evaluate a table expression.
The following is the syntax for the CALCULATE TABLE Function:
CALCULATETABLE(<expression>[, <filter1> [, <filter2> [, …]]])The parameters are the following:
| Term | Definition |
| expression | The table expression is to be evaluated. |
| filter1, filter2,… | (Optional) Boolean expressions or table expressions that define filters, or filter modifier functions. |
A model table or a table-returning Function must be used as the first parameter.
There are several types of filters:
- Boolean filter expressions: An expression that evaluates to TRUE or FALSE is called a Boolean expression filter. They must follow the following guidelines:
- They are unable to refer to measures.
- They are unable to use a CALCULATE Function that is nested.
- They can only refer to one column at a time.
- Table filter expressions: A table expression filter works by filtering a table object. It could be a reference to a model table, but it’s more likely a table object returned by a Function. The FILTER function can be used to apply complex filter conditions that aren’t defined by a Boolean Filter expression, such as those that aren’t defined by a Boolean Filter expression.
- Filter modification Functions: You can do more with Filter Modifier Functions than just add filters. They give you more options when it comes to changing the filter context.
| Function | Purpose |
| REMOVEFILTERS | Remove all filters, or filters from one or more columns of a table, or from all columns of a single table. |
| ALL, ALLEXCEPT, ALLNOBLANKROW | Remove filters from one or more columns, or from all columns of a single table. |
| KEEPFILTERS | Add filter without removing existing filters on the same columns. |
| USERELATIONSHIP | Engage an inactive relationship between related columns, in which case the active relationship will automatically become inactive. |
| CROSSFILTER | Modify filter direction (from both to single, or from single to both) or disable a relationship. |
The ALL Function and its variants work as both filter modifiers and table-object-returning Functions. If your tool supports the REMOVEFILTERS Function, it’s preferable to use it to remove filters.
- Some of the things to consider while using CALCULATETABLE FUNCTION are:
- The CALCULATETABLE Function modifies the filter context to evaluate filter expressions when they are provided. When the filter expression is not wrapped in the KEEPFILTERS Function, there are two possible standard outcomes for each filter expression:
- In order to evaluate the expression, new filters will be added to the filter context if the columns (or tables) aren’t in the filter context.
- Existing filters will be overwritten by the new filters when evaluating the CALCULATETABLE expression if the columns (or tables) are already in the filter context.
- When used in calculated columns or Row-Level Security (RLS) rules, this Function is not supported when using DirectQuery mode.
- The CALCULATETABLE Function modifies the filter context to evaluate filter expressions when they are provided. When the filter expression is not wrapped in the KEEPFILTERS Function, there are two possible standard outcomes for each filter expression:
How to create Power BI Calculated Table?
- Basic Use of CALCULATETABLE Function
- Using CALCULATETABLE Function with Summarize Function
- Using CALCULATETABLE Function within Measures
1. Basic Use of CALCULATETABLE Function
To see the basic use of CALCULATETABLE Function to create Power BI calculated tables follow the steps:
- Step 1: You create a table called CalCtable which is a Power BI calculated table to filter the the number of churned customers between two periods defined by a dynamic [Churn Time Frame Value].
VAR CustomersPurchased = CALCULATETABLE( VALUES( Sales[Customer ID] ),
FILTER( ALL( Dates ),
Dates[Date] > MIN( Dates[Date] ) - 365 &&
Dates[Date] <= MIN( Dates[Date] ) - [Churn Time Frame Value] ) )


VAR PriorCustomers = CALCULATETABLE( VALUES( Sales[Customer ID] ),
FILTER( ALL( Dates ),
Dates[Date] > MAX( Dates[Date] ) - [Churn Time Frame Value] &&
Dates[Date] <= MAX( Dates[Date] ) ) )
RETURN
COUNTROWS( EXCEPT( CustomersPurchased, PriorCustomers ) ) * -1
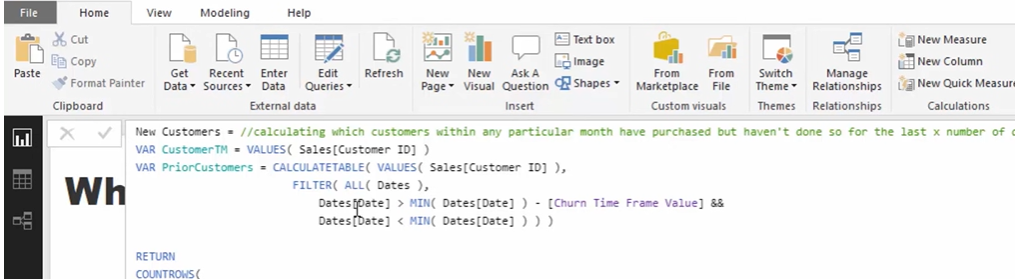
When you commit a DAX function, the data model creates a Power BI calculated table called CalCtable.
- Step 2: You must drag Table Fields into a table visual to see all customers.
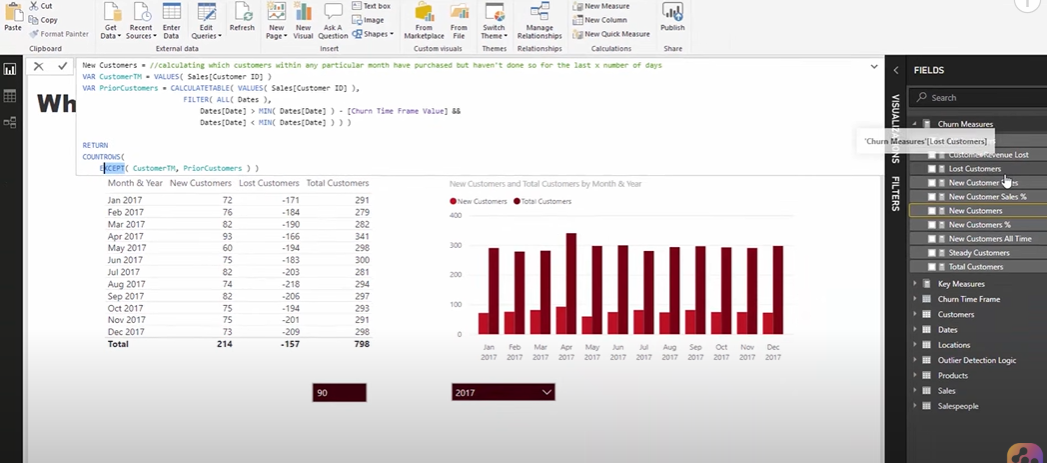
- Step 3: You can also compare the result sets of both tables; you’ll notice that CalCtable only contains products with a quantity value greater than 1.
- As a result, you can sort Power BI calculated table records using the CALCULATETABLE function based on any condition.
2. Using CALCULATETABLE Function with Summarize Function
You can create Power BI calculated tables with the use of CALCULATETABLE Function with Summarize Function. You can see this in the example below:
CALCULATETABLE returns a table based on filter conditions. It returns all columns of the base table, but if you only want to see certain columns, you can use the SUMMARIZE Function within CALCULATETABLE. Follow the steps below to see how it is done:
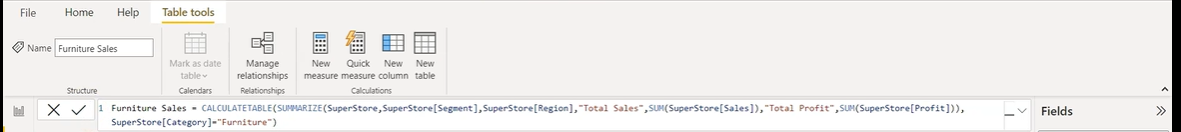
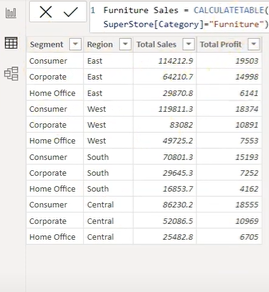
- Step 1: Modify the DAX calculation to create a summarized table called Furniture Sales, focusing on Furniture sales data from the SuperStore table. It groups the data by Segment and Region while calculating the Total Sales and Total Profit for each group.
Furniture Sales = CALCULATETABLE(SUMMARIZE(SuperStore, SuperStore[Segment], SuperStore[Region], "Total Sales", SUM(SuperStore[Sales]), "Total Profit", SUM(SuperStore[Profit])), SuperStore[Category] = "Furniture")
- Step 2: As shown below, after you commit the DAX, you will only see the columns that you want to see.
3. Using CALCULATETABLE Function within Measures
You can also create Power BI calculated tables using the CALCULATETABLE Function within a Measure , rather than creating a separate filtered table.
Measure = CALCULATETABLE([Total_Sales], ...)
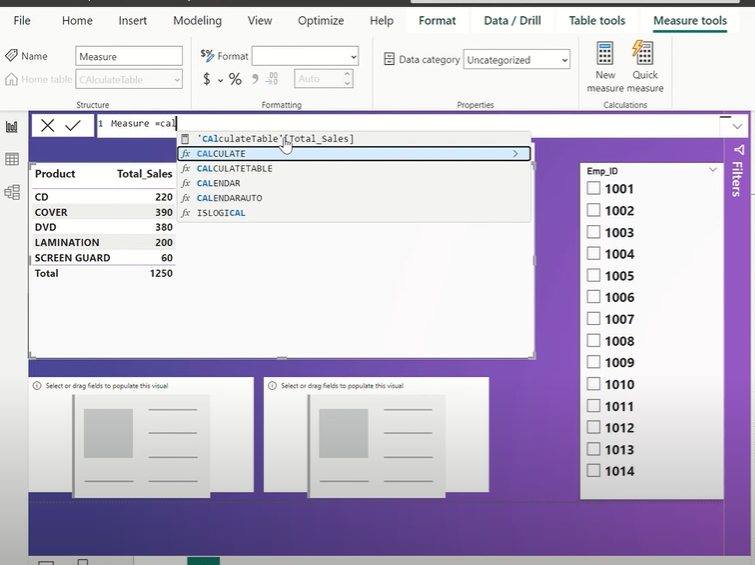
This calculates or filters Total_Sales dynamically based on additional conditions
Conclusion
This article talks about the DAX CALCULATED TABLE Function and how it is used to create Power BI Calculated Tables. It also gives a brief description of Power BI and DAX.
Power BI is a great tool for performing Data Analytics and Visualization for your business data. However, at times, you need to transfer this data from multiple sources to your PowerBI account for analysis. Building an in-house solution for this process could be an expensive and time-consuming task. Hevo Data, on the other hand, offers a No-code Data Pipeline that can automate your data transfer process, hence allowing you to focus on other aspects of your business like Analytics, Customer Management, etc.
This platform allows you to transfer data from 150+ sources to BI tools like Power BI, and Cloud-based Data Warehouses like Snowflake, Google BigQuery, Amazon Redshift, etc. It will provide you with a hassle-free experience and make your work life much easier.
FAQs
1. What is a calculated table in Power BI?
A calculated table in Power BI is a table created using a DAX expression, evaluated once when the data model is loaded or refreshed, and remains static until refreshed.
2. How do you create a table with calculated measures in Power BI?
You create a table with calculated measures by using the “New Table” feature in the Modeling tab, writing a DAX expression that defines the table, and adding calculated measures using the “New Measure” option.
3. What is the difference between a measure and a calculated table in Power BI?
A measure is a dynamic calculation that responds to filter context and returns a single value, while a calculated table is static, created once using DAX, and returns a full table of data that does not change unless the model is refreshed.
Share it with your connections.
-
 Share To LinkedIn
-
 Share To Facebook
-
 Share To X
-
 Copy Link


