


Power BI is a set of software services, apps, and connectors that work together to transform disparate data sources into logical, visually immersive, and interactive insights. Your data could be in the form of an Excel spreadsheet or a collection of hybrid data warehouses that are both cloud-based and on-premises.
COUNTIF is such a prevalent Excel function that anyone transitioning to Power BI frequently encounters the question, “How can I execute a COUNTIF in Power BI?”. In contrast to Excel, Power BI does not include cells where the COUNTIF formula can be typed. Instead, practically everything in Power BI is based on filter contexts.
In this post, you will learn how to write Power BI COUNTIF using DAX in various methods.
Table of Contents
What is Power BI?

Microsoft’s Power BI is a Business Analytics service that allows you to display data and share findings. It creates dynamic dashboards and Business Intelligence reports by converting data from many sources.
Suppose you have some sales data in an excel sheet, as you can see above. Power BI helps you see the data by allowing you to create various charts and graphs.

Key Features of Power BI
- Power BI has access to large volumes of data from various sources.
- It has interactive UX/UI features and makes things visually appealing.
- Power BI has exceptional Excel integration.
- It accelerates the Big Data preparation with Microsoft Azure by allowing you to analyze and access huge volumes of data.
- Power BI allows you to gain insights on data and changes those into actions to make data-driven decisions.
- Power BI allows you to perform Real-time Stream Analytics.
Free up your time by offloading routine data requests to Hevo Answers. Get instant insights, automate ad-hoc queries, and focus on high-impact analytics.
🔹 Natural Language Queries – Ask in plain English, no SQL needed
🔹 Instant AI-Powered Insights – Get accurate answers in seconds
🔹 Seamless Data Integration – Connect to Salesforce, Shopify, Google Ads & more
🔹 Enhanced Productivity – Reduce reporting workload, focus on strategy
What is Power BI COUNTIF Function?
COUNTIF is a logical function that counts the values in a range based on the given conditions. Because there isn’t an easy COUNTIF function in Power BI, you might not understand the logic of using it. However, we can still use the same logical function in Power BI COUNTIF. Read about COUNTIF in Tableau.
Those who have used COUNTIF in Excel might find it easy because it is a built-in function. However, Power BI does not have a built-in COUNTIF function. Users face a problem here since they must grasp at least three different DAX functions to do one task.
For example, take a look at the following data range in Excel:

Suppose you want to count how many times the country “Canada” has appeared. In this case, the criteria is the country “Canada”. Similarly, you can count values based on different criteria.
How to Apply Power BI COUNTIF Function?
Since there is no built-in COUNTIF function in Power BI, you need to apply a couple of other functions to finish the job.

The first table has a “country-wise” sales value and the second one has a unique country list. So you get the count of the unique countries from the first one.
Follow the steps given below to apply the Power BI COUNTIF function:
- Step 1: Upload the tables to Power BI.

- Step 2: Out of the two tables uploaded: Data Table and List, Right-click on List and select New Column.

- Step 3: Name the new column.
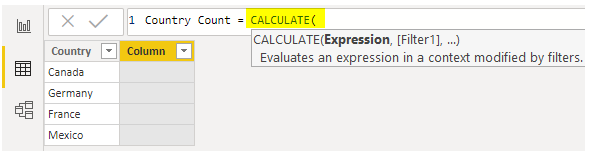
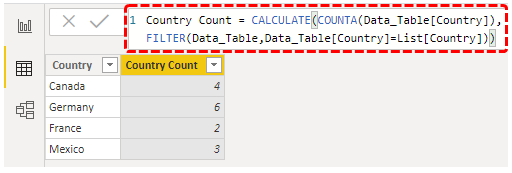
- Step 4: Open the Calculate function.
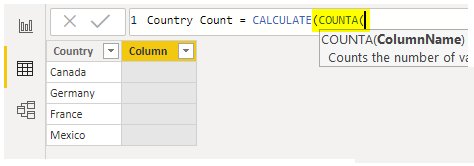
- Step 5: For the expression, open the COUNTA function.
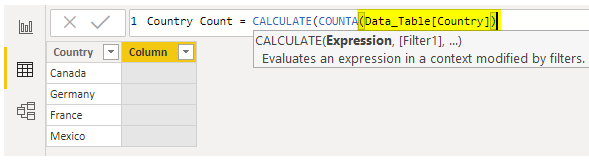
- Step 6: For the column name, choose the Country column from Data Table.
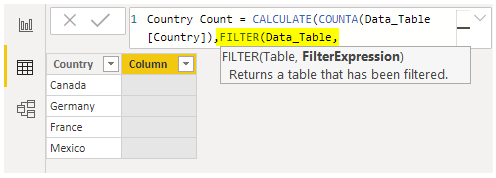
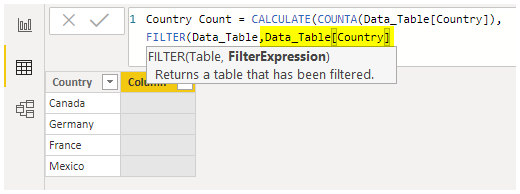
- Step 7: Close the bracket and for the next argument, open the Filter function.

- Step 8: The first argument of the Filter function is a table, so choose Data Table because you need to count the country column.
- Step 9: For Filter Expression, choose Country Column from Data Table.
- Step 10: Now, put an equal sign and choose Country from the List table. This is to count countries based on the unique list in the List Table.
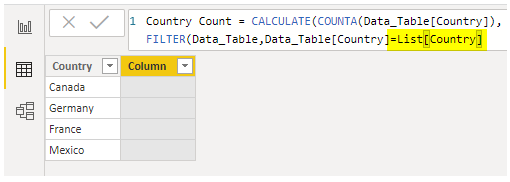
- Step 11: Close the brackets and press Enter.
Alternate Method to Apply Power BI COUNTIF Function
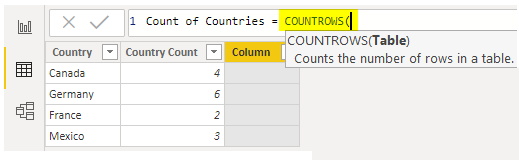
There is an alternate method to get the country count just like the COUNTIF function i.e. using the COUNT ROWS method.
- Step 1: Right-click on New Column.
- Step 2: Name the column differently than the previous time ( like in the previous method).
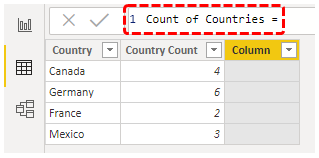
- Step 3: Open the COUNTROWS function.
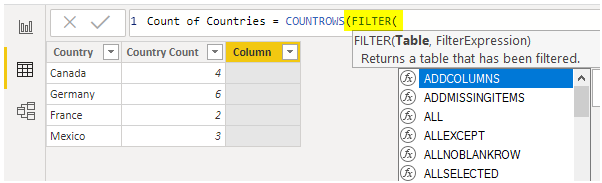
- Step 4: Open the FILTER function again.
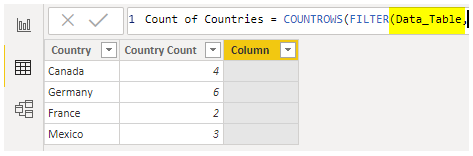
- Step 5: Choose the Data Table.
- Step 6: For Filter Expression, follow the method that you did in the previous example.
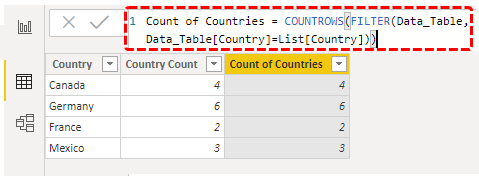
You now have the count of each country from the Data Table. Similarly, by using a combination of DAX formulas, you can replicate the Power BI COUNTIF function.
Understanding the Methods of Implementing Power BI COUNTIF Function
Here are 4 ways of implementing Power BI COUNTIF Function:
1. Using a Visual
Consider the following Sales data as sample data. It has 4 columns.

To count the number of transactions in each channel follow the given steps:
- Step 1: Make a Matrix Visual.
- Step 2: Drag the channel from the Sales Table in Rows.
- Step 3: Drag any other column from Values, change the calculation to COUNT, and change the field name.

2. Using a Measure
Dragging a column to the pivot table is looked down upon in Power BI because columns are expensive. A better method would be to create measures. Here are two measures that do the same work:
Transaction Count Measure 1 = COUNTA(Sales[Date])Transaction Count Measure 2 = COUNTROWS(Sales)In the above measures:
- COUNTROWS only counts the number of rows.
- COUNTA counts the number of values. Null values are excluded.
Since in this situation there are no null values, both measures will give the same output.
3. In a Fact Table
Consider this Sales table again:
Suppose you want to add a column to this table to count the frequency of dates. Unfortunately, you cannot do that by using =COUNTIF in PowerBI because it does not exist. But, you can use the DAX formula like the following:
COUNTIF for Duplicate Dates =
VAR __CurrentRowID = Sales[Date]
RETURN
COUNTROWS(
    FILTER(
    	ALL(Sales),
    	__CurrentRowID = Sales[Date]
	)
)- The variable
__CurrentRowIDis set to theDatevalue of the current row in theSalestable. COUNTROWScounts the rows inSalesthat meet specified conditions.FILTER(ALL(Sales), ...)retrieves all rows fromSales, ignoring any filters currently applied.- The condition
__CurrentRowID = Sales[Date]finds rows where theDatematches the date of the current row. - The formula returns the count of rows with the same date as the current row, effectively counting duplicate dates.
The above code is explained below:
- Step 1: The variable DuplicateDates captures the current row dates.
- Step 2: In the FILTER function, the whole Sales Table is expanded using ALL, and then checking how many dates match with variable.
- Step 3: Wrap the COUNTROWS function in the FILTER function.
The above piece of code gives the following output:

You can also write the DAX code differently without using variables. The code is shown below:
COUNTIF for Duplicate Dates with Variable =
COUNTROWS(
    FILTER(
    	ALL(Sales),
    	EARLIER(Sales[Date]) = Sales[Date]
    )
)COUNTROWScounts the number of rows that meet a specific condition within theSalestable.FILTER(ALL(Sales), ...)retrieves all rows from theSalestable, ignoring any existing filters.EARLIER(Sales[Date]) = Sales[Date]checks for rows where theDatecolumn matches the current row’sDate, identifying duplicate dates.- This code returns a count of how many times each date appears in the
Salestable, useful for identifying duplicates. - It helps analyze the frequency of specific dates by counting duplicate entries for each date.
This code will also give the same output. An additional complexity would be to do the Power BI COUNTIF function with two conditions. This is called COUNTIFS in Excel.
Another example would be If you wanted to rows have the same Product ID and Channel?
The logic for this is similar as the above code, the only difference being we add two conditions using the && operator. Take a look at the code:
COUNTIF for Same Prod & Channel =
COUNTROWS(
    FILTER(
    	ALL(Sales),
    	Sales[Product ID]=EARLIER(Sales[Product ID]) &&
    	Sales[Channel] = EARLIER(Sales[Channel])
    )
)COUNTROWScounts rows in theSalestable that meet a specific condition.FILTER(ALL(Sales), ...)retrieves all rows from theSalestable, ignoring any current filters.Sales[Product ID] = EARLIER(Sales[Product ID])andSales[Channel] = EARLIER(Sales[Channel])together check if theProduct IDandChannelmatch the current row’s values.- This code identifies duplicates where both
Product IDandChannelare the same as the current row. - It returns a count of rows for each unique combination of
Product IDandChannel.
The same code can also be written by making use of Variables:
COUNTIF for Same Prod & Channel using Variables =
VAR __CurrProd = Sales[Product ID]
VAR __CurrChannel = Sales[Channel]
RETURN
COUNTROWS(
    FILTER(
    	ALL(Sales),
    	Sales[Product ID]=__CurrProd &&
    	Sales[Channel] = __CurrChannel
    )
)- Two variables,
__CurrProdand__CurrChannel, are set to the current row’sProduct IDandChannelvalues, respectively. COUNTROWScounts rows in theSalestable that meet specific conditions.FILTER(ALL(Sales), ...)retrieves all rows from theSalestable, ignoring any current filters.- The condition
Sales[Product ID] = __CurrProd && Sales[Channel] = __CurrChannelchecks for rows where bothProduct IDandChannelmatch the current row’s variables. - The formula returns the count of rows with the same
Product IDandChannelas the current row.
4. In the Look-Up Table
Another method people generally try to do is writing the Power BI COUNTIF function in the Lookup Table. For example, you have another table Products which is linked to Sales Table using Product ID as a common column.

This is how the relationship between the two is set up:

Suppose you want to create a table in the Products table to find the number of products sold in the Sales Table.
Since a relationship already exists between the two tables, you can easily solve this using the RELATEDTABLE function.
Note: The RELATEDTABLE function is mostly used in the Lookup Table, but the RELATED table is used in the Fact Table.
The DAX code for the above problem statement:
COUNTIF for Prod Sold in Sales Table =
COUNTROWS(RELATEDTABLE(Sales))
Here is the explanation for the above code:
- Step 1: RELATEDTABLE function returns a Table with matching rows from Sales Table.
- Step 2: Wrap RELAREDTABLE function in COUNTROWS function.

Conclusion
In most cases, instead of establishing columns in your tables, you should create measures. However, if you need to build columns for testing or other strange calculations, you can use this guide for help. This article covered various Power BI COUNTIF Functions and the different ways to use them with suitable examples. By harnessing the COUNTIF function in Power BI through various methods such as ‘COUNTIF Power BI,’ ‘Power BI COUNTIF,’ and more, you can unlock a new level of precision in data analysis and reporting.
However, as a Developer, extracting complex data from a diverse set of data sources like Databases, CRMs, Project management Tools, Streaming Services, Marketing Platforms to Power BI can seem to be quite challenging. If you are from non-technical background or are new in the game of data warehouse and analytics, Hevo Data can help!
Want to take Hevo for a spin? Sign Up for a 14-day free trial and experience the feature-rich Hevo suite firsthand.
You can also have a look at our unbeatable pricing that will help you choose the right plan for your business needs!
FAQs
1. How do you count if a cell contains specific text in Power BI?
Use the DAX function:CALCULATE(COUNTROWS(Table), FILTER(Table, SEARCH("text", Table[Column], 1, 0) > 0)).
2. How to count a value in Power BI?
Use:COUNTAX(FILTER(Table, Table[Column] = "Value"), Table[Column]).
This counts occurrences of a specific value in a column
3. How to add countif in power query?
Create a new column:
Go to Add Column > Conditional Column for conditions.
Use Group By to count occurrences based on a condition.


Share it with your connections.
-
 Share To X
-
 Share To LinkedIn
-
 Share To Facebook
-
 Copy Link


