The advantages of Business Intelligence and Data Visualization are becoming more apparent to companies all around the world. Many of these firms utilize Power BI, a Business Intelligence tool, to deploy these valuable strategies on their business data, which is stored in the Cloud Data Warehouse and a variety of other places. Users may utilize Power BI Reports to see and analyze their data.
In this article, you will understand the basics of Power BI Joining Tables as well as implement the process. You will also get to know the different Joins which will help you in Power BI Joining Tables.
Table of Contents
What is Power BI?
Microsoft’s Power BI is a Business Intelligence tool. Users can use it to examine data from a variety of sources and create Reports and Dashboards. It can be used as a standalone desktop app or as a fully managed Cloud-based web service. While the Power BI Desktop is a free download, the Power BI Service is a subscription-based service that charges users based on their usage.
Power BI Mobile is now available from Microsoft for those who want to keep an eye on their data while on the go. Analytical features can also be included in custom web apps using Power BI. It works well with the majority of Microsoft’s enterprise products.
Power BI takes advantage of the ability to connect to the most common databases outside of the Microsoft ecosystem and create simple, Interactive Dashboards from them.
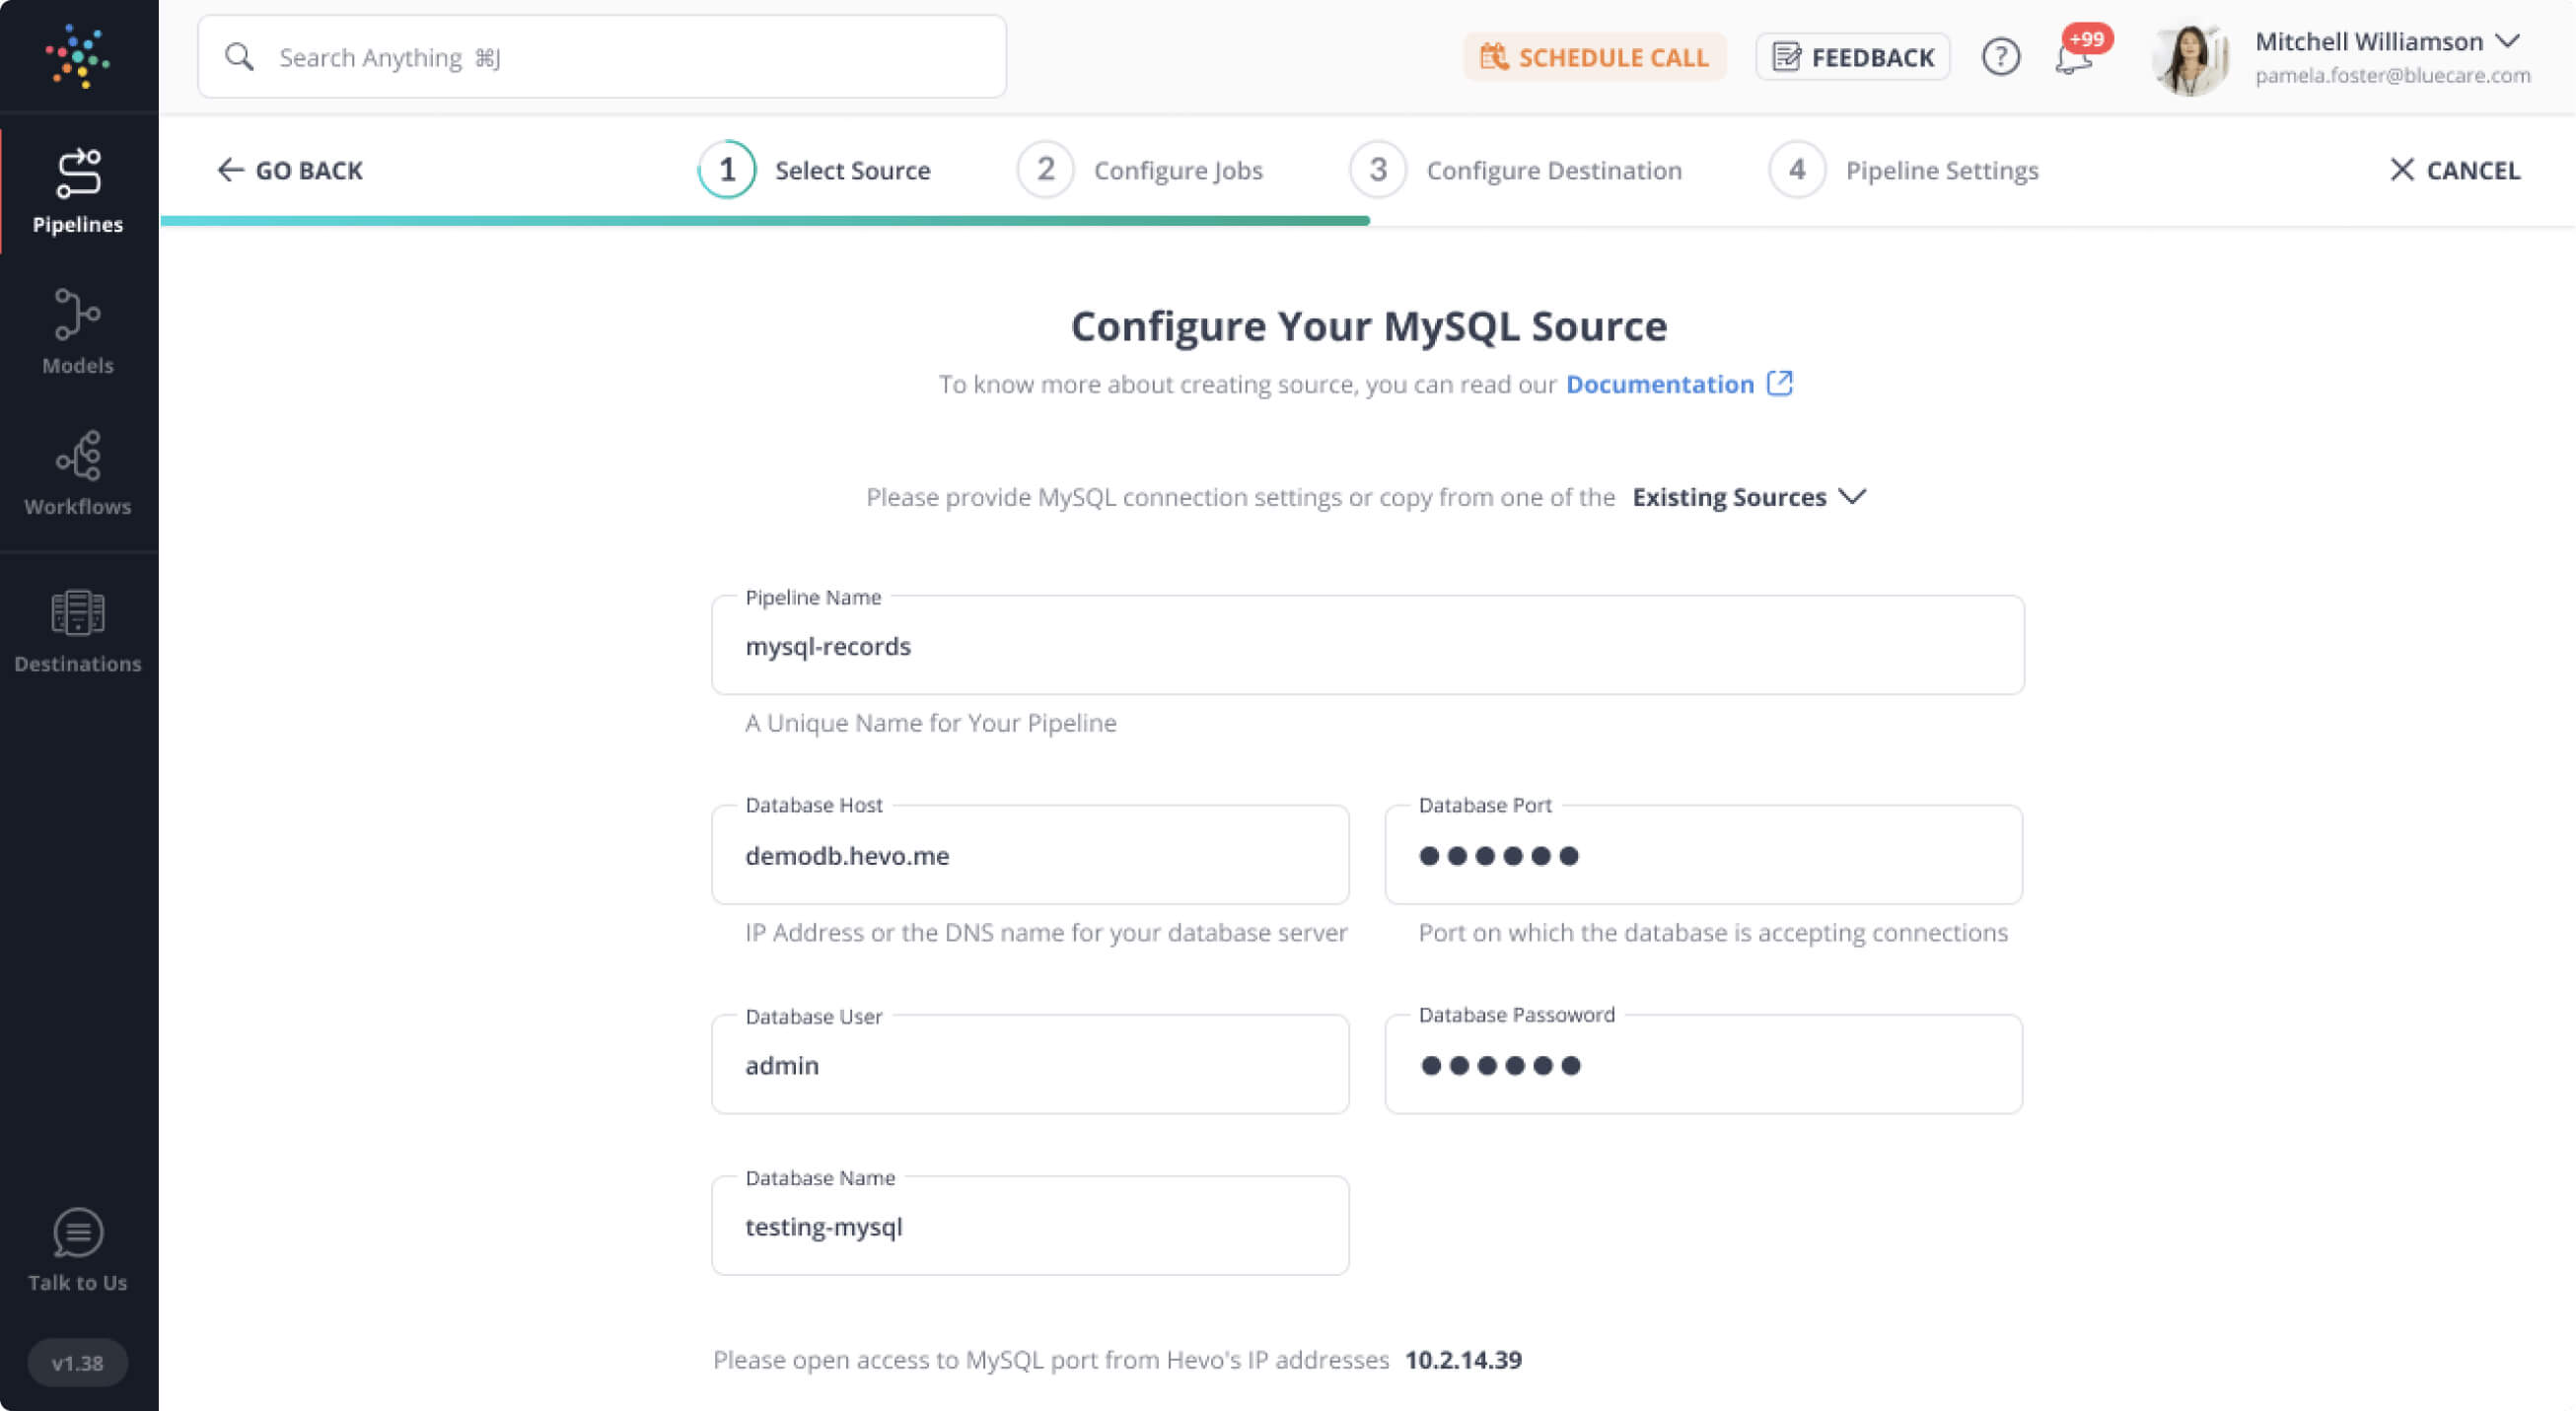
Hevo Data, a No-code Data Pipeline helps to transfer data from 150+ sources (including 60+ free sources) to a Data Warehouse/Destination of your choice and visualize it in your desired BI tool. Check out what makes Hevo amazing:
- Easy Integration: Connect and migrate data without any coding.
- Auto-Schema Mapping: Automatically map schemas to ensure smooth data transfer.
- In-Built Transformations: Transform your data on the fly with Hevo’s powerful transformation capabilities.
- Load Events in Batches: Events can be loaded in batches in certain data warehouses.
Key Features of Power BI
Power BI has a large number of capabilities that set it apart from other BI applications. The following are some of these characteristics:
- It has a large number of visually appealing Visualization Templates to pick from. To display your dataset, you can generate Reports and Dashboards using as simple or as elaborate visuals as you desire.
- Power BI features a function called “Get Data” that allows you to choose from a variety of data sources, including On-Premise, Cloud-Based, Unstructured, and Structured data, among others. Every month, new data sources are added.
- You can filter your datasets in Power BI to focus on smaller datasets first. This allows you to focus on specific data in the dataset rather than the entire dataset at once.
- You may use a range of Graphical Elements to design your Dashboards. The Dashboards can be printed and shared.
- Dashboards, Data Models, Datasets, Embedded Queries, and many other features are available in Power BI’s “Content Packs.” Instead of searching for the pieces separately, you can use the elements in the “Content Packs.”
To get further information on Power BI, you can check out the official website here.
Understanding the Basics of Power BI Joining Tables
You don’t need just one enormous “flat” table with all your data when modeling in Power BI. Power BI Joining Tables helps you build Relationships. It’s fairly simple to construct Relationships between tables with Power BI, and the software will try to detect them automatically if they exist. Though it’s best to double-check or establish the links manually so you know which columns connect two tables and that you don’t have any loops. The adventure works sample database is shown in the figure below:
This may be found in Power BI’s “Relationships View.” To go here, click the icon indicated by the red arrow. A star-like data model is a name given to this model. The Sales Table is in the middle of the Database, it can also be called the Central table. The Store table, the Customer table, the Product table, and the Date table are all linked to the Sales table. Since you have these branches (additional tables) that emerge out of a Central table, it’s called a star (in this case the Sales table). To keep things more manageable and organized, it’s a good idea to organize your data in this manner.
Power BI Joining Tables can be set up by just using select, drag, and drop commands with the common columns from each table (similar to playing connect the dots).
Combining and Shaping Data in Power BI Desktop
1) Shape Data
Shaping Data is an important aspect of Power BI Joining Tables. When you shape data in Power Query Editor, you’re giving Power Query Editor step-by-step instructions on how to alter the data as it loads and presents it. The underlying data source is unaffected; only this specific view of the data is altered.
Power Query Editor records the steps you specify (such as renaming a table, transforming a data type, or deleting a column). Power Query Editor performs those processes each time this query connects to the data source, ensuring that the data is always shaped in the way you specify. This happens every time you use Power Query Editor, as well as anybody else who uses your shared query, such as on the Power BI service. Those steps are recorded in the Query Settings window, under Applied Steps, in order. In the following paragraphs, you’ll go over each of those steps.
Let’s use the retirement data we got by connecting to a web data source from Getting Started with Power BI Desktop to bend it to match our needs. You’ll create a custom column to determine rank based on the assumption that all data is equal, and compare it to the existing Rank field.
Step A: Add Custom Column
Select Custom Column from the Add Column ribbon to create a Custom column.
Step B: Add New Rank
In the Custom Column box, type New Rank in the New column name field. Enter the following information in the Custom column formula:
([Cost of living] + [Weather] + [Health care quality] + [Crime] + [Tax] + [Culture] + [Senior] + [#"Well-being"]) / 8Step C: Checking Syntax Errors
Check to see that the status message is correct. There were no syntactic mistakes found, so click OK.
Step D: Ensuring Data Consistency
Transform the new column values to whole numbers to keep the column data consistent. To alter them, right-click the column header and choose Change Type > Whole Number from the drop-down menu.
Pick a column, hold down SHIFT, select other neighboring columns, and then right-click a column header if you need to select more than one column. You can also choose non-adjacent columns by holding down the CTRL-key.
Step E: Transforming Data
Select Data Type Text from the Transform ribbon to transform column data types, which involves changing the current data type to a different one.
Step F: Rechecking Applied Steps
The Applied Steps list in Query Settings shows any data shaping steps that have been applied. Select the X to the left of a stage to remove it from the shaping process.
The Applied Steps list in the following graphic represents the steps that have been added so far:
- Connecting to the website is the Source of this information.
- Selecting the table from the HTML table that was extracted.
- Changed column type from Text to Whole Numeric for text-based number columns.
- Adding a custom column to the table.
- Changed Type1 refers to the most recent action.
2) Combine Data
Combining Data is another aspect of Power BI Joining Tables. The information on various states is intriguing, and it will be valuable for further study and queries. However, there is a flaw: most data utilizes a two-letter abbreviation for state codes rather than the entire name of the state. You need a mean to link State Abbreviations to their Names.
You’re in luck: there’s another public data source that offers just that, though it’ll need some work to connect it to the retirement table. Follow these steps to shape the data:
Step A: Connecting State Abbreviation Website
Select New Source > Web from the Home ribbon in Power Query Editor. Select Connect after entering the URL for the state abbreviations webpage of US state abbreviations. The website’s content is displayed in the Navigator.
Choose your Abbreviations and Codes.
Step B: Removing Undesired Data
The top row should be removed. You don’t need it because it’s a result of the way the table on the web page was generated. Select Remove Rows > Remove Top Rows from the Home ribbon.
The Remove Top Rows window displays, allowing you to specify the number of rows to remove.
Remove the lowest 26 rows of the table. You don’t need to add these rows because they are US territories. Select Remove Rows > Remove Bottom Rows from the Home ribbon.
You need to remove Washington DC from your list because the RetirementStats table does not include data for it. Clear the tick beside Federal district after selecting Region Status from the drop-down menu.
Remove a few columns that are no longer needed. You can delete multiple columns because you just require the mapping of each state to its official two-letter abbreviation. Pick a column first, then select each of the remaining columns while holding down the CTRL-key. Select Remove Columns > Remove Button from the Home tab on the ribbon.
Step C: Renaming Columns
Change the names of the columns and the table. There are several options for renaming a Column. To rename a column, first, pick it, then choose Rename from the Transform tab on the ribbon or right-click and choose Rename. There are arrows pointing to both alternatives in the accompanying image; you only need to choose one.
The columns should be renamed to State Name and State Code. In the Query Settings window, type a new name for the table. StateCodes is the name of the table.
3) Adjust Data
The next key pointer in Power BI Joining Tables is Adjusting data. You need to make a few changes to this query’s data before we can work with it:
- Remove a column from the rankings to make them more accurate: If you’ve decided in an Expense Table that the Cost of Living has no bearing on your desired outcomes but you will discover that the data remained intact after eliminating this column.
- Correct a few flaws: You need to alter your calculations in the New Rank column because you eliminated a column, which requires changing a formula.
- Sort the Information: The New Rank and Rank columns are used to sort the data.
- Replace the Information: You’ll go over how to replace a specific value and why an Applied Step is necessary.
- Change the name of the table: You’ll modify the table’s name if a Table isn’t a helpful descriptor.
Step A: Removing Undesired Columns
Let’s assume you want to remove the Cost of Living column. To delete the Cost of Living column, select it, then go to the ribbon’s Home tab and select Remove Columns.
Due to the sequencing of the steps, the New Rank values haven’t altered. You can move each Applied Step up or down in the sequence because Power Query Editor captures the steps sequentially but individually.
Step B: Editing Columns
Select a step by right-clicking it. The Power Query Editor menu allows you to perform the following tasks:
- Rename: You can rename the step.
- Delete: Remove the step from the process.
- Delete Until End: Remove the current step, as well as any of those that follow it.
- Move before: Move the step up in the list.
- Move after: Move the step down in the list.
Step C: Adding Custom Steps
Removed Columns, the last step, should now be directly above Added Custom.
Choose the Added Custom option. It’s worth noting that the data now displays Error, which is something that needs to be fixed.
There are a few options for obtaining additional information about each problem. Power Query Editor displays the Error details if you pick the cell without clicking on the term Error.
When you pick the term Mistake in the Query Settings pane, Power Query Editor creates an Applied Step and provides details about the error.
Select Cancel since you don’t need to see information about the problems.
Step D: Fixing Errors
To correct the problems, click the New Rank column, then choose the Formula Bar checkbox from the View tab to reveal the column’s data formula.
By altering the formula as follows, you can remove the Cost of Living component and decrease the divisor:
Table.AddColumn(#"Removed Columns", "New Rank", each ([Weather] + [Health care quality] + [Crime] + [Tax] + [Culture] + [Senior] + [#"Well-being"]) / 7)Select the green checkmark to the left of the formula box or press Enter.
4) Combine Queries
The final step in Power BI Joining Tables is to Combine Queries. Let’s integrate the two tables or queries, now that you’ve customized the StateCodes data to your liking. The tables you now have are often referred to as queries because they are the outcome of the queries you ran on the data. Merging and Appending are the two main methods for combining queries.
- You combine queries when you have one or more columns that you’d like to add to another query.
- When you want to add more rows of data to an existing query, you append it.
Let’s combine the queries in this scenario. To do so, take the following steps:
Step A: Merge Queries
Select the query into which you want the other query to combine from the left pane of Power Query Editor. It’s RetirementStats in this situation. From the Home tab of the ribbon, go to Merge Queries > Merge Queries.
You may be asked to specify the privacy levels so that the data is integrated without including or sending data you don’t want. The Merge window will open. It asks you to choose the table you want to combine into the selected table, as well as the matching columns to use in the merge.
Step B: Matching Columns
From the RetirementStats table, choose State, then the StateCodes query. The OK button becomes active once you’ve selected the relevant matching columns.
Choose OK. The contents of the table (query) that was merged with the previous query are stored in a new column created by Power Query Editor at the end of the query. The column has all columns from the combined query, however, you can Expand the table and include whatever columns you desire.
Select the Expand icon to expand the merged table and choose which columns to include (Expand icon). The Expand window is displayed.
Step C: Applying Changes
You simply need the State Code column in this scenario. Clear the column by selecting it. Select OK after using the original column name as a prefix. If the selection for Use original column name as prefix had been selected, the merged column would have been titled NewColumn.StateCode.
You now have a single query (table) that combines two data sources, each shaped to match your requirements. This query can be used to connect to a variety of other data sources, such as Housing Cost Figures, Demographics, or Job Openings in any state.
Select Close & Apply from the Home ribbon option to apply your changes and close Power Query Editor.
The modified dataset is now available in Power BI Desktop, ready for report creation.
Power BI Joining Tables with Power Query
Let’s understand different types of Power BI Joining Tables. Assume you work for a bike company and have two tables in the data warehouse: one with a list of items and prices, and another with a list of products that are currently in stock. You have more things in stock than you have made yourselves, and this list comprises the full inventory. Here’s how the tables appear:
The rows that match on both tables are shown by the green rows. Let’s put those tables together using the various joins offered in Power BI:
1) Inner Join
Let’s assume you were asked to provide a list of products that are currently in stock by the planning department. They don’t want to see any additional items because they aren’t intended to be available. You’ll use an Inner Join in this scenario.
Only the matched rows from table A and table B are used in an inner join. The result of an inner join is a table containing all matching records and nothing else.
2) Right Outer Join
Someone from the warehouse has inquired as to which things they manufacture themselves. You’d do a Right Outer Join in such a situation.
You take all the rows from table B and the matched ones from table A when you conduct a Right Outer. Only the products that are present in table B will be returned by the right outer from table A.
3) Left Outer Join
Let’s assume that someone from the manufacturing industry wants to know what motorcycles they have on hand. Left Outer Join is suitable in that situation.
When you conduct a Left Outer, you take all of the rows from table A and match them up with the rows from table B. Only the products that are present in table A will be returned from table B by the left outer.
4) Full Outer Join
Suppose you were asked to provide a list of all products available for purchase by the product management department. You’ll do a Full Outer Join in this situation.
You take all the rows from table A and all the rows from table B when you execute a Full Outer. Full outer will yield a table containing all records that match those in both tables.
5) Right Anti Join
The logistics department is requesting a list of products that are currently in stock, but they do not manufacture those products. Right Anti Join will take care of it this time.
You take all the rows from B that don’t have a match in table A when you execute a Right Anti. All rows from table B that do not have a match on table A will be returned by the right anti.
6) Left Anti Join
Product management has called again, this time requesting a list of products that are currently out of stock so that they may evaluate their approach. That’s not a problem; in this situation, Left Anti Join will suffice.
When you execute a Left Anti, you take all the rows from table A that don’t match anything in table B. All rows from table A that do not have a match on table B will be returned by left anti.
How to Change Power BI Joining Tables Types In using M Script?
By going to the Advanced Editor and altering the M Script as shown below, you can apply any change in Power BI Joining Tables. Navigate to the View tab and select Advanced Editor:
The M Script that creates the result set in Power BI Joining Tables can be seen in the Advanced Editor query window. Change the JoinKind of the join function.
JoinKind is a type of enumeration that can have the following values:
- JoinKind.Inner=0
- JoinKind.LeftOuter=1
- JoinKind.RightOuter=2
- JoinKind.FullOuter=3
- JoinKind.LeftAnti=4
- JoinKind.RightAnti=5
As a result, you can alter it whenever you wish.
What is the Best Way to Join Tables in Power BI?
The best way to join tables in Power BI depends on your data and what you’re trying to achieve. Here are some common methods:
- Using Relationships: This is the recommended approach for joining tables. You can create relationships between tables based on common columns (keys) in the Data Model view. Power BI automatically detects and suggests relationships, and this method is best for handling large datasets.
- Merge Queries in Power Query: If you want to combine data before loading it into the model, use the “Merge Queries” option in Power Query. This allows you to join tables directly within the query editor and is useful when you need to clean or transform data before analysis.
- DAX Functions: If you need more control over how the tables are joined or need to create dynamic relationships, you can use DAX functions like
RELATED,RELATEDTABLE, orLOOKUPVALUEto join tables in calculated columns or measures.
Each method has its own benefits depending on the complexity of your data model and the transformations required. For most scenarios, using relationships in the Data Model is the most efficient and scalable way to join tables in Power BI.
Use Cases for Joining Tables in Power BI
Joining tables in Power BI is useful in many scenarios. Here are some common use cases:
- Combining Sales and Product Data: If you have one table with sales data and another with product details (like name and price), you can join them to analyze sales performance by product category or region.
- Customer Segmentation: When you have customer data in one table (e.g., customer details) and transaction data in another (e.g., sales history), joining these tables allows you to segment customers based on their purchase behavior.
- Tracking Performance Across Time: If you have data from different time periods (like monthly sales figures), you can join these tables to compare performance over time, identify trends, and create time-based reports.
- Combining Financial and Operational Data: By joining financial data (like expenses and revenue) with operational data (like employee or resource usage), you can gain a deeper understanding of how business activities impact financial outcomes.
- Analyzing Marketing Campaigns: If you have marketing campaign data in one table and sales data in another, joining them helps track the success of marketing efforts and understand how campaigns drive revenue.
Conclusion
This article teaches about Power BI Joining Tables. It provides in-depth knowledge about the concepts behind every step to help you understand and implement them efficiently. You can integrate many such platforms using Hevo.
Hevo Data, a No-code Data Pipeline can seamlessly transfer data from a vast sea of 150+ sources to a Data Warehouse, BI Tool like Power BI, or a Destination of your choice. It is a reliable, completely automated, and secure service that doesn’t require you to write any code!
If you are using Power BI as your Data Analytics & Business Intelligence platform and searching for a no-fuss alternative to Manual Data Integration, then Hevo can effortlessly automate this for you. Hevo, with its strong integration with 150+ sources and BI tools (Including 60+ Free Sources), allows you to not only export & load data but also transform & enrich your data & make it analysis-ready in a jiffy.
Want to take Hevo for a ride?
Sign up for a 14-day free trial and simplify your data integration process. Check out the pricing details to understand which plan fulfills all your business needs.
Frequently Asked Questions
1. How do you join two tables together in Power BI?
To join two tables in Power BI, use relationships. Go to the “Model” view, drag a field from one table and drop it onto a related field in the other table to create the join.
2. How do I connect between tables in Power BI?
You connect tables in Power BI by creating relationships between them using fields that link the data. This allows you to combine and analyze data from multiple tables together.
3. Can you join tables in DAX?
Yes, you can join tables in DAX using functions like RELATED, RELATEDTABLE, and LOOKUPVALUE to fetch data from related tables based on common fields.


