Key Takeaways
Follow any of the methods below to set up a Power BI JSON connection:
Load Local JSON in Power BI Desktop: Use the Get Data wizard to import a local JSON file, drill into records, convert to table, split columns, and create visualizations.
Import via REST API Calls: In Power BI Desktop, select Web as the source, enter the JSON API endpoint, convert the returned JSON list to a table, expand columns, and build your report.
Load Local JSON in Power Query Online: In Power BI service, choose JSON as a data source, point to your local file through a data gateway, then use Power Query Online to transform and load the data.
Extracting meaningful insights from the millions of rows of data collected in real-time is always a huge challenge for organizations globally. Data Visualisations Tools like Power BI allow business teams to build visually stunning and informative dashboards & reports to keep a tab on their goals & objectives. Power BI provides a collection of features that simplifies the decision-making process.
One of the important sources of data today is the web. JSON is a common format in which the data is read from the data server and displayed on a web page. You can easily set up the Power BI JSON connection and start building your reports.
In this article, you will learn how to effectively set up the Power BI JSON connection using 3 different methods.
Table of Contents
Methods to Establish Power BI JSON Connection
You can set up the Power BI JSON Connection using the following methods:
- Power BI JSON Connection Method 1: Load a Local JSON File from the Power BI Desktop
- Power BI JSON Connection Method 2: Importing JSON data with Power BI Rest API Calls
- Power BI JSON Connection Method 3: Load a Local JSON File from Power Query Online
By utilizing Hevo’s Data Pipeline, you can significantly reduce your JSON Data Modeling time and effort. Hevo is the only real-time ELT No-code Data Pipeline platform that cost-effectively automates data pipelines from sources that are flexible to your needs. Here’s what Hevo Data offers to you:
- Schema Management: Hevo takes away the tedious task of schema management & automatically detects the schema of incoming data and maps it to the schema of your Data Warehouse or Database.
- Incremental Data Load: Hevo allows the transfer of data that has been modified in real-time. This ensures efficient utilization of bandwidth on both ends.
- Live Support: The Hevo team is available round the clock to extend exceptional support to its customers through chat, email, and support calls.
Power BI JSON Connection Method 1: Load a Local JSON File from Power BI Desktop
In this Power BI JSON Connection example, a sample JSON file is used that is sourced from the NASDAQ stock exchange. To download this file, you can visit the NASDAQ’s On-Demand Data page. This sample file contains NASDAQ stocks-related data in attribute-value pairs. The red box highlights some of these attributes and values such as StartTime of 06/15/2011 09:29:05.698 or an AskQuantity of 100.
Follow the simple instructions given below to set up the Power BI JSON connection:
- Step 1: Start the Get Data Wizard
- Step 2: Select the Data Source and Desired JSON File
- Step 3: Link and Transform the File using Power BI Query Editor
- Step 4: Drilldown to Records and Convert Rows
- Step 5: Split into Columns
- Step 6: Create Visualization
Step 1: Start the Get Data Wizard
- To connect Power BI JSON locally, open up Power BI Desktop. To import your local JSON file to Power BI, you need to start the Get Data Wizard. You can do that in 2 ways:
- Click on the Get Data Splash screen option.

- Click on the Get Data tab from the top menu and then click on the More… option.

Learn to convert data from Power BI JSON to table to easily analyze and visualize data by creating interactive charts, reports, and dashboards.
Step 2: Select the Data Source and Desired JSON File
- Step 1: Now, a Get Data dialog box will pop up on your screen. Select JSON as your data source and click on the Connect button.

- Step 2: Browse to the location where you have saved your JSON Data file and select it. Click on the Open button to start your Power BI JSON connection.

- Step 3: You also import JSON files directly from the web by entering the required URL.

Free up your time by offloading routine data requests to Hevo Answers. Get instant insights, automate ad-hoc queries, and focus on high-impact analytics.
🔹 Natural Language Queries – Ask in plain English, no SQL needed
🔹 Instant AI-Powered Insights – Get accurate answers in seconds
🔹 Seamless Data Integration – Connect to Salesforce, Shopify, Google Ads & more
🔹 Enhanced Productivity – Reduce reporting workload, focus on strategy
Step 3: Link and Transform the File using Power BI Query Editor
Starting the Power BI Connection will automatically launch the Power BI Query Editor. You will notice a Record is stated under the List column. Often, Power BI recognizes a set of Record links in the initial stage when you import the JSON Data. By clicking on these records, you can drill down further into the JSON file structure.

Step 4: Drilldown to Records and Convert Rows
- Step 1: Click on the Record link and notice that Power BI will present you with the highest level of details within the JSON file.

- Step 2: Among various details such as Start Time, End Time, etc, observe that the Quotes row has a hyperlinked “Links” option. Hover over it, and you will notice a list of records. Finally, click on this option to view the records.
- Step 3: Now, you can convert this list of records into the rows of a table. Click on the To Table option present in the top left corner.
- Step 4: You can specify the delimiters used in your data and how Power BI should handle the extra columns. Click on the OK button once you are done.

Step 5: Split into Columns
- Step 1: Once you have converted your records, a single column will appear. Click on the Split Columns button present on the column header.
- Step 2: A list of possible columns is displayed. Select the columns according to your use case and click on the OK button. To set the current column as the prefix, check the box next to the “Use original column name as prefix” option.

- Step 3: A table containing the desired columns will appear. You can also see the list of steps you applied to get to this stage on the Applied Steps feature present on the right-side vertical menu. By clicking on the X option you can also undo the steps you don’t like and again set up your table.

- Step 4: Finally, click on the Close & Apply option available on the top left corner of your screen. This will return your data to the main Data Visualisation Window.
Step 6: Create Visualization
After setting up your Power BI JSON connection, you will now land upon the Reports View. Using various Filters, Charts & Graphs, and Value Fields you can create visually stunning reports based on your JSON data.


Power BI JSON Connection Method 2: Importing JSON data with Power BI Rest API Calls
You can also set up a Power BI JSON Connection using the RESTful API Calls. You can easily extract data from Websites that allow Restful APIs for data access and use that data in several formats, such as JSON and CSV. For this Power BI JSON Connection example, data about the eight different houses from the TV Show Game of Thrones is extracted from the Anapioficeandfire Website.
- Step 1: Click on the above link and you will observe the following in your browser window.

This website provides an API to access a collection of books, characters, and houses from the novel series: A Song Of Ice And Fire.
- Step 2: Go to Power BI Desktop and click on the Get Data option present on the top ribbon. Click on the More… option.
- Step 3: Type “Web” in the search box and select web as your data source. Click on the Connect button to start your Power BI JSON connection.

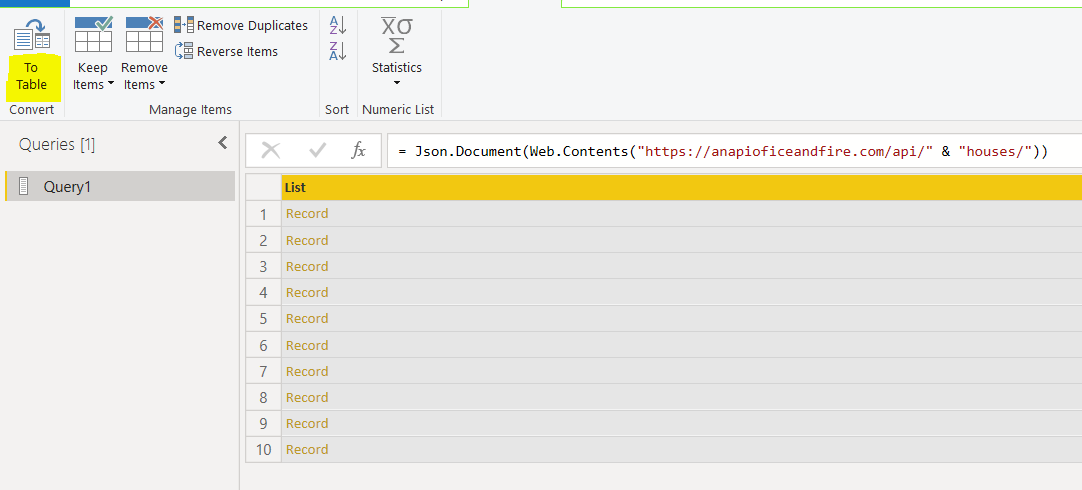
- Step 4: A From Web dialogue box will appear on your screen. Enter the URL https://anapioficeandfire.com/api/ as the first part and “houses/” as the second part. The URL preview should be https://anapioficeandfire.com/api/houses/. Once done, click on the OK button.

- Step 5: This will automatically open up the Power Bi Query Editor containing the data set in the form of a JSON file having 10 records. Each of these records describes one of the houses in the novel series. Similar to locally setting the Power BI JSON connection, click on the To Table option present on the top left corner.
- Step 6: Click on the “<->” symbol present alongside the Column Name to split the columns.

- Step 7: Select the column you desire to be placed in the table and click on the OK button.

- Step 8: After expanding the columns, notice that the “titles” and “seats” columns still need to be expanded further. To do that, click on the “<->” button at the top right of the column name as shown below:

After expanding both the “title” and the “seats” column, your table should look like this:

You can also observe several duplicate records appear when you expand the “title” and “seats” columns. This is possible as one house can have multiple titles and seats.
- Step 9: Click on the “Close & Apply” button available on the top left corner to open this dataset in the Query window.
- Step 10: After the Power BI JSON connection is set up, you can now start creating visualizations. In this Power BI JSON connection example, a simple pie chart displaying the distribution of ancestral weapons by region is created. To do this, click on the “pie” chart option from visualizations. Now, in the “Legend” field, add “region” and in the values field, add “Count of ancestral Weapons”.

The following pie chart shows that almost 50% of the ancestral weapons belong to the region “The Vale”. Similarly, 11.1% of weapons belong to each of the “The Reach” and “The North” regions.

This completes the Power BI JSON connection via the REST API calls.
Power BI JSON Connection Method 3: Load a Local JSON File from Power Query Online
Apart from the Power BI Desktop version, you can also import the Local JSON file using the Power Query Online version. You can easily set up the Power BI JSON connection via Power BI Online by following the simple steps given below:
- Step 1: Go to the Data Sources page and select JSON.
- Step 2: In the Connection Settings, enter the location of the local JSON file stored on your computer.

- Step 3: From Data Gateway, choose your on-premise data gateway.
- Step 4: Enter your credentials when asked for authorization and click the Next button. This will launch the Power Query Editor automatically. You can now follow the steps discussed in the above two methods to set up your table and create the desired visualizations.
Why Connect Power BI to JSON?
Power BI allows you to work with a broader range of datasets in various formats such as Excel, CSV, JSON, etc. JSON has become a popular data format as it is supported by most browsers and backend technologies. Its easy creation and manipulation allow JSON to gain JSON momentum in the programming of API code and web services. Hence, you may find yourself extracting JSON data from the web for your business analysis. Similar to XML, JSON is self-describing and uses a tagging method “to tell” about the data. However, it is focused on providing a flexible yet organized method of exchanging data.
How to Troubleshoot Power BI JSON Connections?
While working with the Power BI JSON connection, you may get the following error message if the file is invalid. It could happen if it’s not really a JSON file, or is malformed. Another case might be that you are trying to load a JSON Lines file.

For cases when you are loading a JSON Lines file, the following sample M code converts all JSON Lines input to a single flattened table automatically:
let
    // Read the file into a list of lines
    Source = Table.FromColumns({Lines.FromBinary(File.Contents("C:json-lines-example.json"), null, null)}),
    // Transform each line using Json.Document
    #"Transformed Column" = Table.TransformColumns(Source, {"Column1", Json.Document})
in
    #"Transformed Column"
Note that you will be required to use an Expand operation to combine the lines together.
Conclusion
In this article, you have learned how to effectively set up the Power BI JSON connection using 3 different methods. Power BI allows you to work with data in several formats such as CSV, Excel, and JSON. JSON is a common format when extracting data from the web. Both Power BI Desktop & Power BI Query Online supports the Power BI JSON connection. Besides importing your locally stored JSON files, Power BI also allows you to extract data from the web via RESTful API calls.
As you collect and manage your data across several applications and databases in your business, it is important to consolidate it for complete performance analysis of your business. To achieve this, you need to assign a portion of your engineering bandwidth to Integrate data from all sources, Clean and transform it, and finally, Load it to a Cloud Data Warehouse, BI Tool like Power BI, or a destination of your choice for further Business Analytics. All of these challenges can be comfortably solved by a Cloud-based ETL tool such as Hevo Data.
Hevo Data, a No-code Data Pipeline, can seamlessly transfer data from a vast sea of 100+ sources to a Data Warehouse, a BI Tool like Power BI, or a Destination of your choice. It is a reliable, completely automated, and secure service that doesn’t require you to write any code!
Want to take Hevo for a ride? Sign Up for a 14-day free trial and simplify your Data Integration process. Do check out the pricing details to understand which plan fulfills all your business needs.
Frequently Asked Questions
1. How do you import JSON data into Power BI?
To import JSON data into Power BI, follow these steps:
-Open Power BI Desktop.
-Click on Home > Get Data > JSON.
-Browse and select your JSON file.
-Power BI will load the JSON file, and you can then transform it in Power Query before loading it into your report.
2. Can Power BI handle large JSON datasets?
Yes, but performance may slow down with large files. Optimizing the dataset can help.
3. How do you refresh JSON data in Power BI?
Use Refresh in Power BI Desktop or set up a scheduled refresh in Power BI Service.
Share it with your connections.
-
 Share To LinkedIn
-
 Share To Facebook
-
 Share To X
-
 Copy Link