


JSON (JavaScript Object Notation) is a text-based data format that machines use to communicate with each other. JSON is presented in well-structured data formats like key-value pairs and nested arrays, which allows machines or applications to understand it easily. However, it is difficult for developers to analyze and generate insights out of the nested data and make data-driven decisions.
To eliminate such complexities, JSON files can be converted into tables using BI tools like Power BI and many others. Using Power BI JSON to table conversion, developers can easily analyze and visualize their data by creating interactive charts, reports, and dashboards.
In this article, you will learn about the JSON file format, Power BI Business Intelligence application, and the steps required to convert your JSON data into Power BI tables. Let’s begin.
Table of Contents
Prerequisites for Using Power BI JSON to Table Conversion
You would require a fundamental understanding of the following for converting your data from Power BI JSON to table:
- JSON file formats, and
- Power BI reports and dashboard.
If you are completely new to Microsoft Power BI application, you can refer to our beginner’s guide on Power BI here- Understanding Microsoft Power BI: A Comprehensive Guide.
What is JSON File Format?
JSON or JavaScript Object Notation is a lightweight and text-based format used for data interchange between machines and processes. Since it is well-structured in the form of key-value pairs and arrays, a JSON file is easy for humans to read and write, as well as for machines to parse and generate information.
Even though it resembles JavaScript object literal syntax, JSON can be used across several programming environments other than JavaScript, making it programming language independent. Furthermore, JSON is similar to XML (Extensible Markup Language) in terms of its self-describing and easily understandable features. However, JSON is better than XML in several ways because JSON can be processed or parsed with a JavaScript parser that is included by default in most of the web-browsers, whereas XML requires the use of a separate XML parser to extract information.
If you store and upload JSON files to a cloud-based data warehouse like Redshift or Google BigQuery, you can extract the most value from your JSON data using Redshift JSON Functions and Google BigQuery JSON Functions. Find more information on these from the links below:
- Redshift JSON Functions 101: Key Types, Syntax, and Example Queries Simplified
- Google BigQuery JSON Functions Simplified 101
Free up your time by offloading routine data requests to Hevo Answers. Get instant insights, automate ad-hoc queries, and focus on high-impact analytics.
🔹 Natural Language Queries – Ask in plain English, no SQL needed
🔹 Instant AI-Powered Insights – Get accurate answers in seconds
🔹 Seamless Data Integration – Connect to Salesforce, Shopify, Google Ads & more
🔹 Enhanced Productivity – Reduce reporting workload, focus on strategy
What is Power BI?
Power BI is a business analytics tool developed by Microsoft that enables users to visualize data, share insights, and create interactive reports and dashboards. It integrates seamlessly with various data sources, offering robust data modeling, real-time analytics, and collaboration features, making it ideal for data-driven decision-making.According to a report from Knowledge Junction, 97 percent of Fortune 500 companies use Power BI because of its rich set of features and functionalities.
You can find more information on Power BI visualizations for creating engaging dashboards and reports here- Understanding Microsoft Power BI Visualizations Simplified. If you would like to connect your Microsoft Apps like Microsoft Excel to Power BI, we have a separate guide for you here- Power BI Excel Connection: 5 Easy Steps.
What are the Steps to Convert Data from Power BI JSON to Table?
Part 1: Prepare JSON Data
Before converting JSON data into Power BI tables, you should have your JSON file, which contains data in the form of key-value pairs and nested objects. You should also have Power BI pre-installed and configured on your local machine.
In this case, the JSON data, which we are about to convert into a Power BI table, contains 100 fictional records of various individuals. However, you can use your own JSON data or download JSON sample files from this website.
In the image given below, you can see the sample of the first five records in JSON format. The JSON file contains four properties such as “Person_Id,” “Person_Name,” “Person_Age,” “Person_Gender,” which are tagged within nested brackets.
Make sure that you know the location or file path where your JSON file is present in your local machine for uploading it to your Power BI dashboard.
Part 2: Prepare Power BI JSON to Table Conversion via Local File
To convert Power BI JSON to table, follow the steps mentioned below:
Step 1: Open your Power BI desktop and click on “Get data” in the Home ribbon section. You can find a list of external data sources, which can be connected with Power BI.
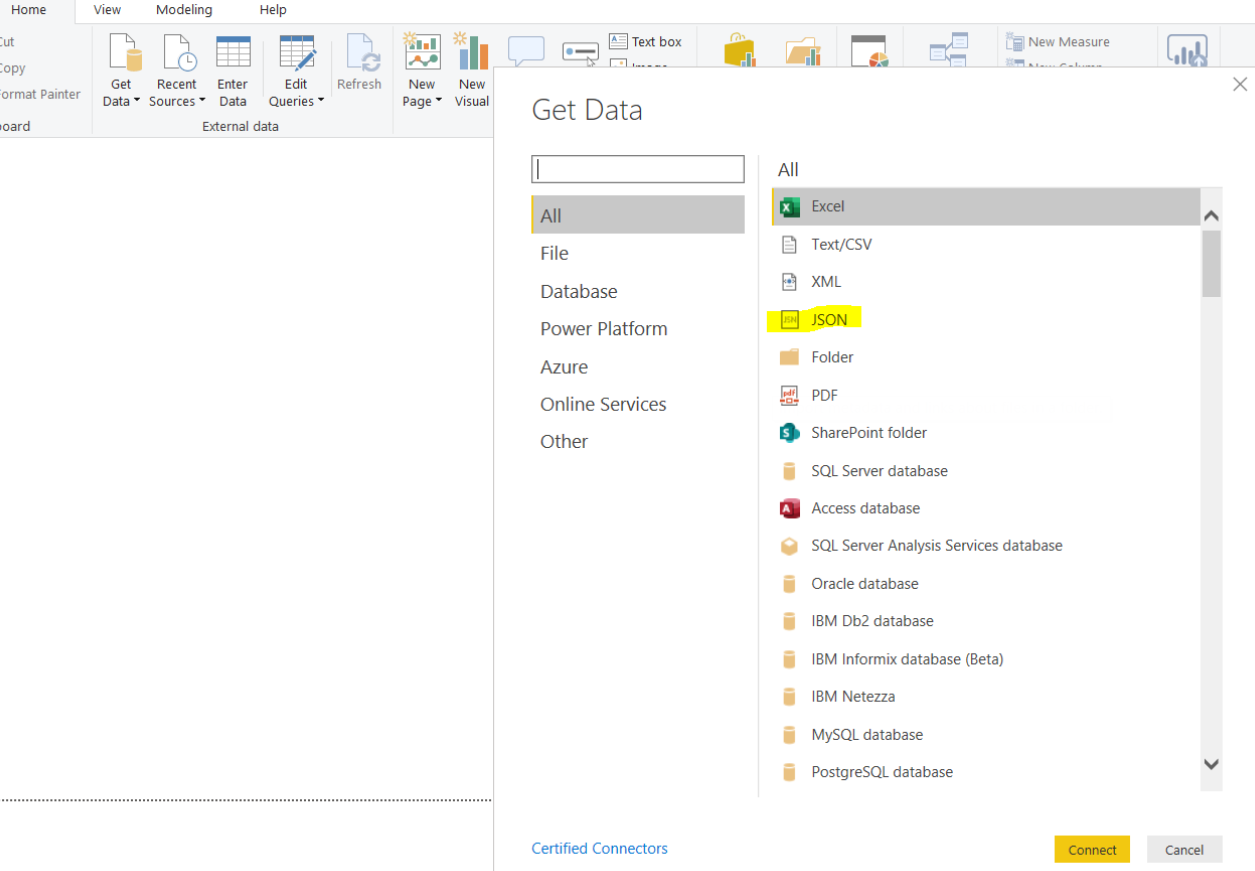
Step 2: Select JSON option under the “All” menu and click on the “Connect” button. Then, you are prompted to upload your JSON file.
Step 3: After uploading your JSON file, you will be directed to the Power Query Editor window, which contains a list of hundred records, as shown in the image below.
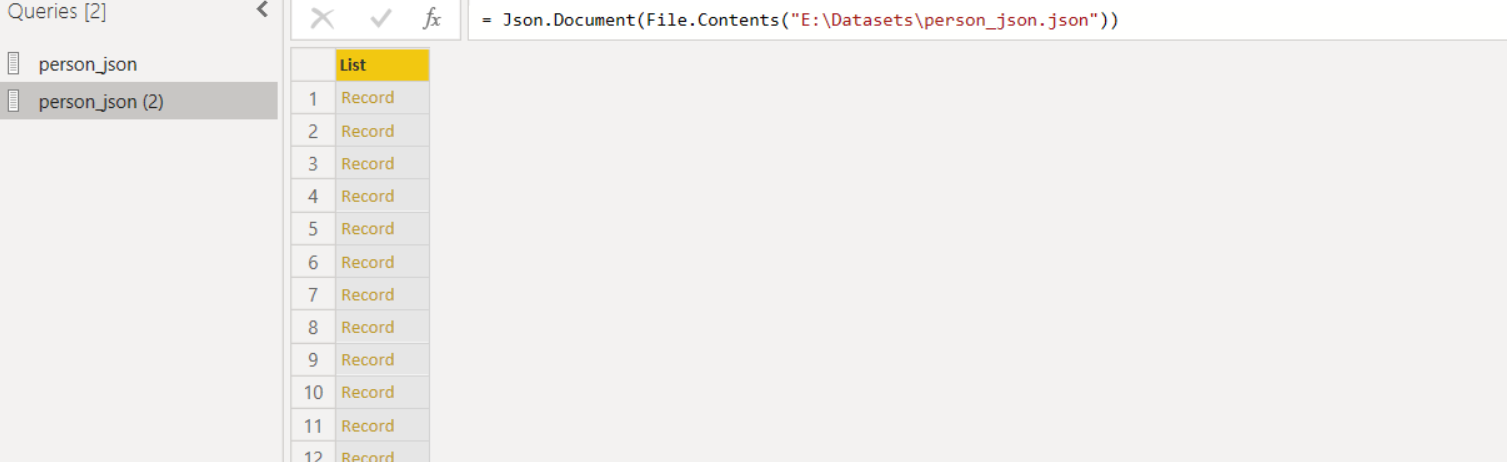
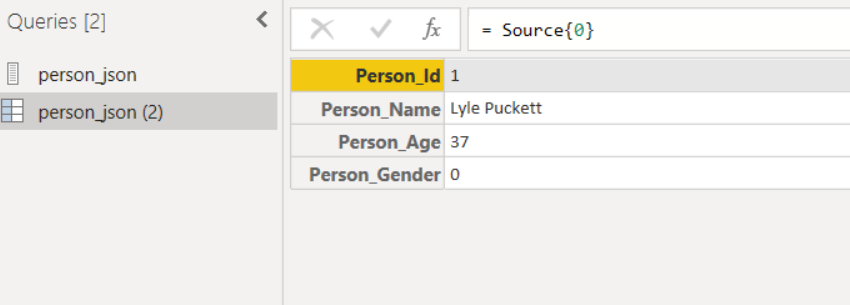
On clicking the records that are present in the form of separate rows, you can see the properties such as “Person_Id,” “Person_Name,” “Person_Age,” “Person_Gender,” which are tagged in your JSON file by default.
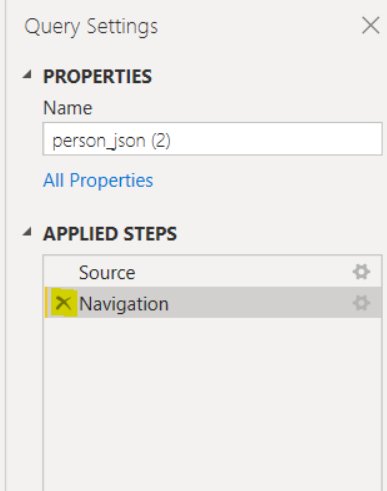
To revert to the previous tab, click on the “X Navigation” option on the right-hand side or remove “X Navigation” from the “Applied Steps” menu.
Now, you are all set to convert your data from Power BI JSON to tables. To do so, follow the steps as described in the next section.


Part 3: Convert Data From Power BI JSON to Table
Step 4: Click on the “To Table” icon in the Convert tab.
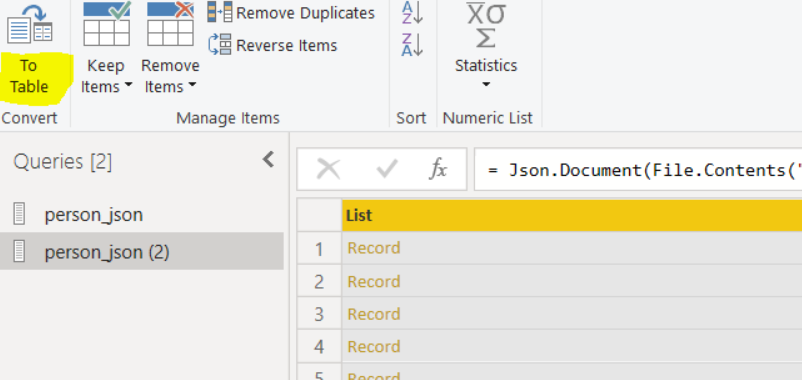
Step 5: The “To Table” dialog box will appear prompting you to enter delimiter in your JSON data and to specify option to handle extra columns. After filling in the fields, click on OK.
With this, your list of records is converted into tables with only one column, as shown in the image below. The column named “Column 1” contains one record person where each record has four parameters such as Person’s ID, Name, Age, and Gender.
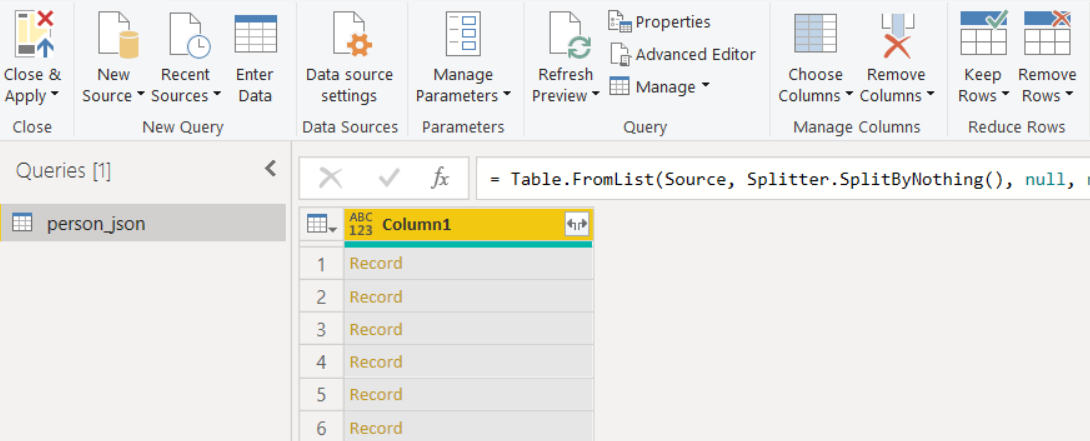
Step 6: You will have to create four columns that contain parameters, such as ID, Name, Age, and Gender, respectively.
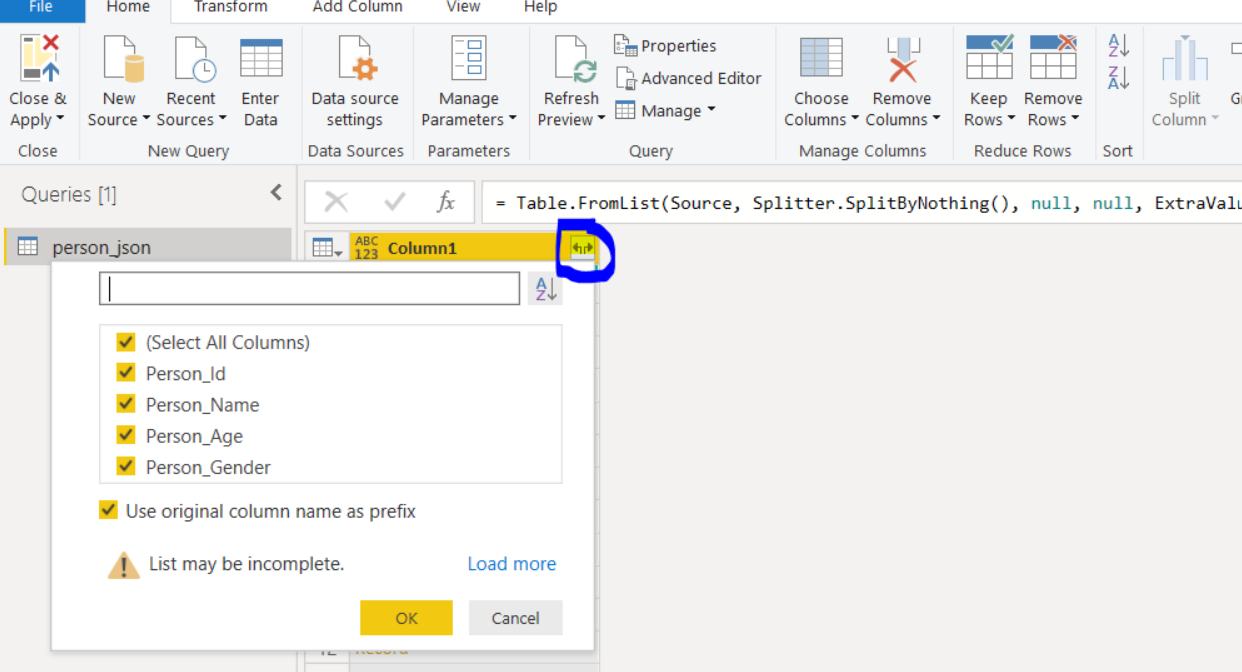
For creating four separate columns, click on the split column icon present next to “Column 1,” as shown in the image below. You can see a new dialogue box where you can uncheck the column that you do not want to include in your Power BI table.
In the same dialogue box, you can check or uncheck the option “Use original column name as prefix” to add the existing column name as a prefix, for example, Column1_Person_Id. After filling in the required fields, click on the “OK” button.
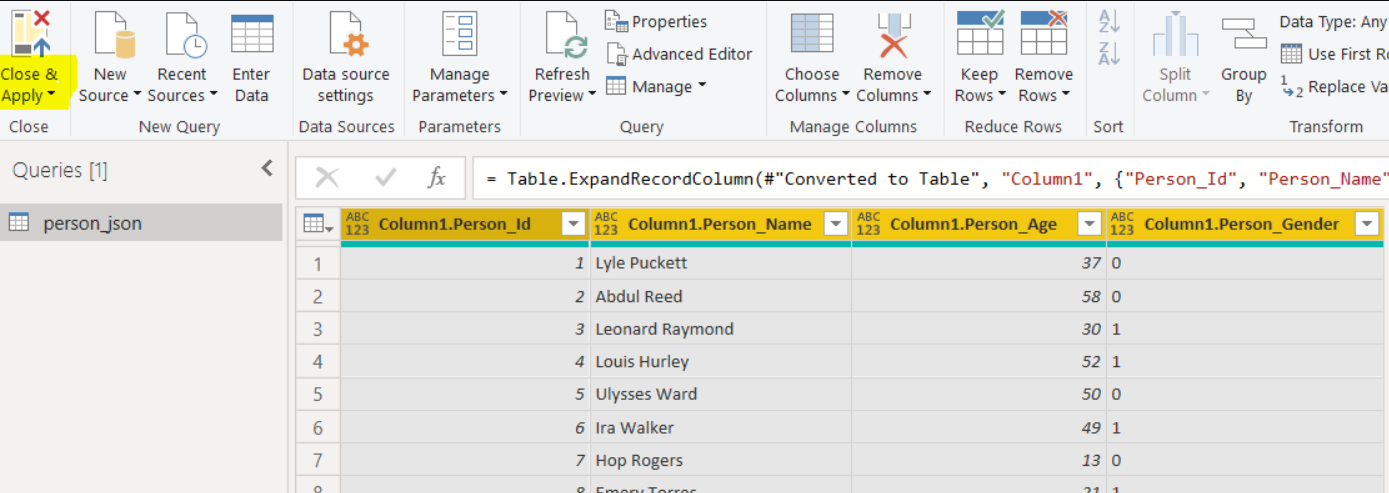
Step 7: Your JSON data is successfully converted into Power BI tables. In the image below, you can find that the Power BI table has four columns, such as “Column1_Person_Id,” “Column1_Person_Name,” “Column1_Person_Age,” “Column1_Person_Gender,” all of which point to properties and values in your JSON file.
Step 8: Now click on “Close & Apply” on the Home ribbon to save the your Power BI JSON to table. You will be redirected to the reports view, where you can create reports and dashboards based on the newly created Power BI table.
Step 9: As shown in the image below, select the “Clustered Column Chart” icon from the visualizations field.
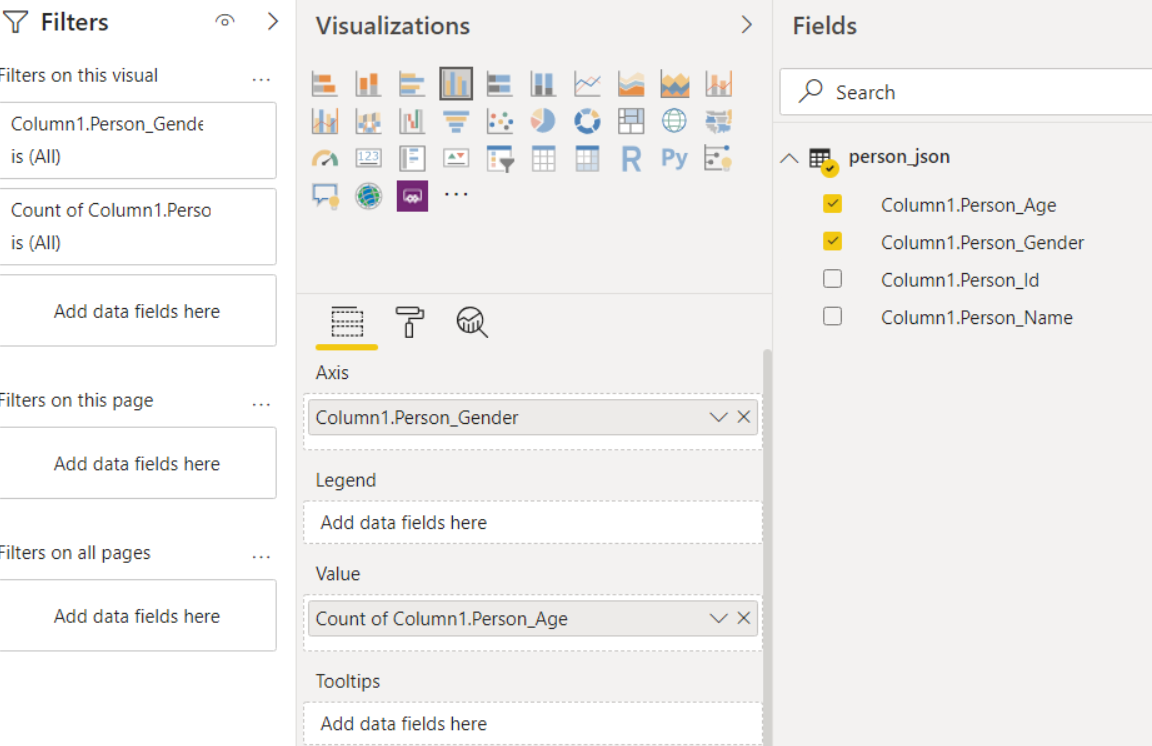
Step 10: Now, add the count of “Person Gender” and “Person Age” column to the Axis field and the Value field under the visualizations menu, respectively.
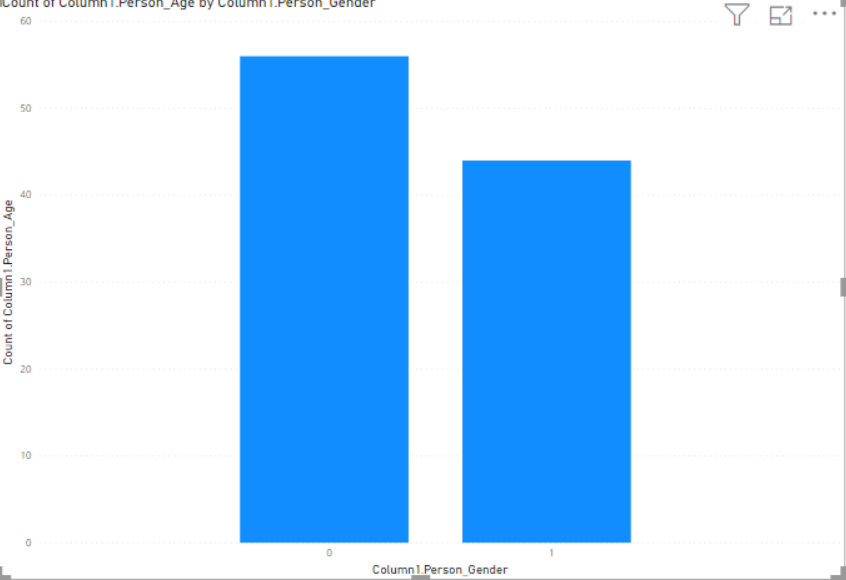
After configuring the fields, you will get the output that resembles the image below. A clustered column chart is created according to the gender and age of the person, which shows that the number of people with gender id 0 is higher than the number of people with gender id 1.
On following the above steps, you successfully converted your Power BI JSON to table.
Alternative Method: Convert Data From Power JSON to Tables via Rest API Calls
There’s one more method using which you can import data from websites that provide Restful APIs for accessing data via Power BI Rest API calls. Once you’ve imported the data, you can treat it as any other data source like JSON or CSV.
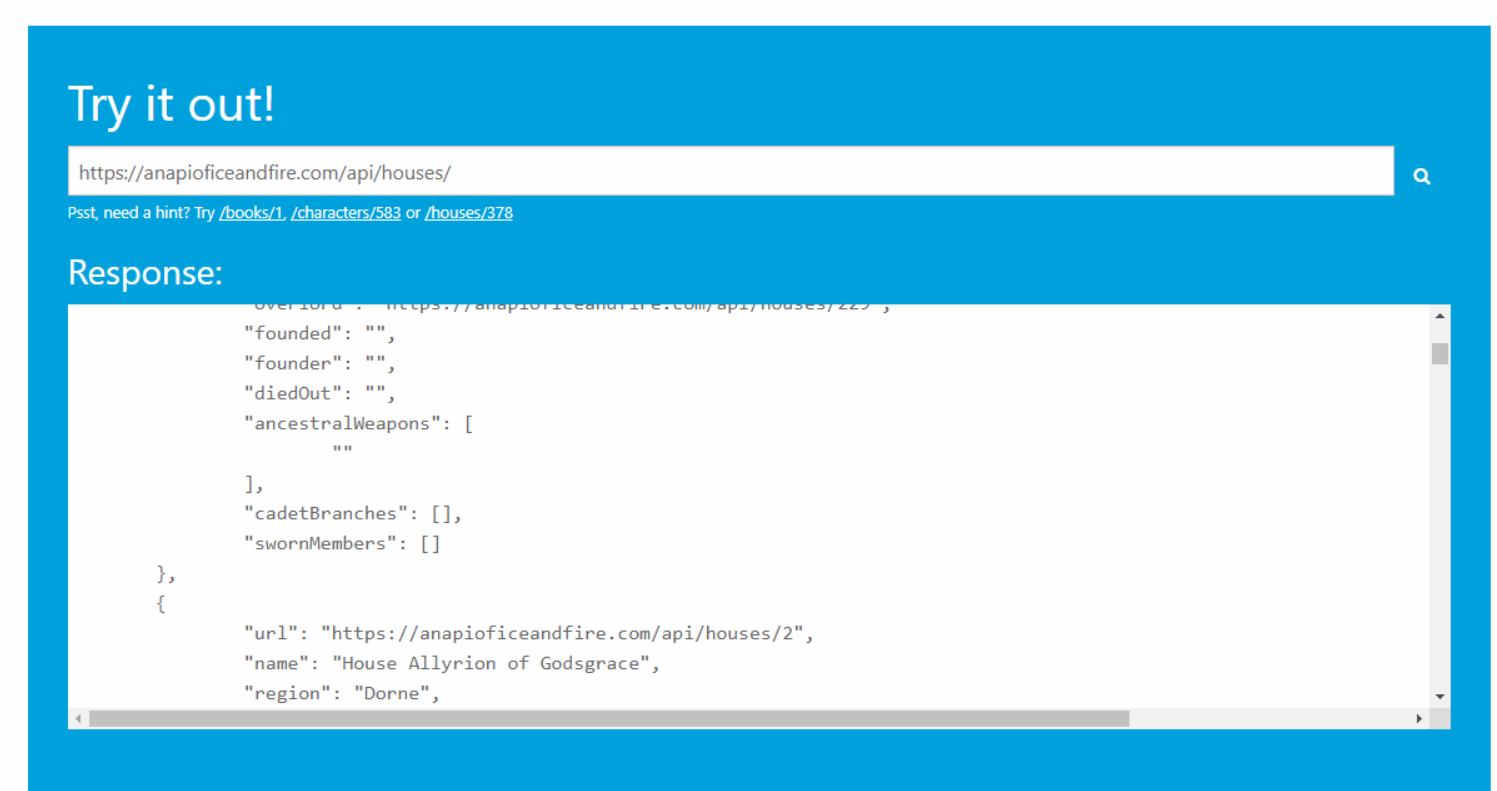
For instance, you can import JSON data from the following website. This website gives you REST API access to enable data connection between web and Power BI.
On visiting the website, you can find the JSON data, as shown in the image below.
Step 1: Now, click on “Get data” in your Power BI Home ribbon section.
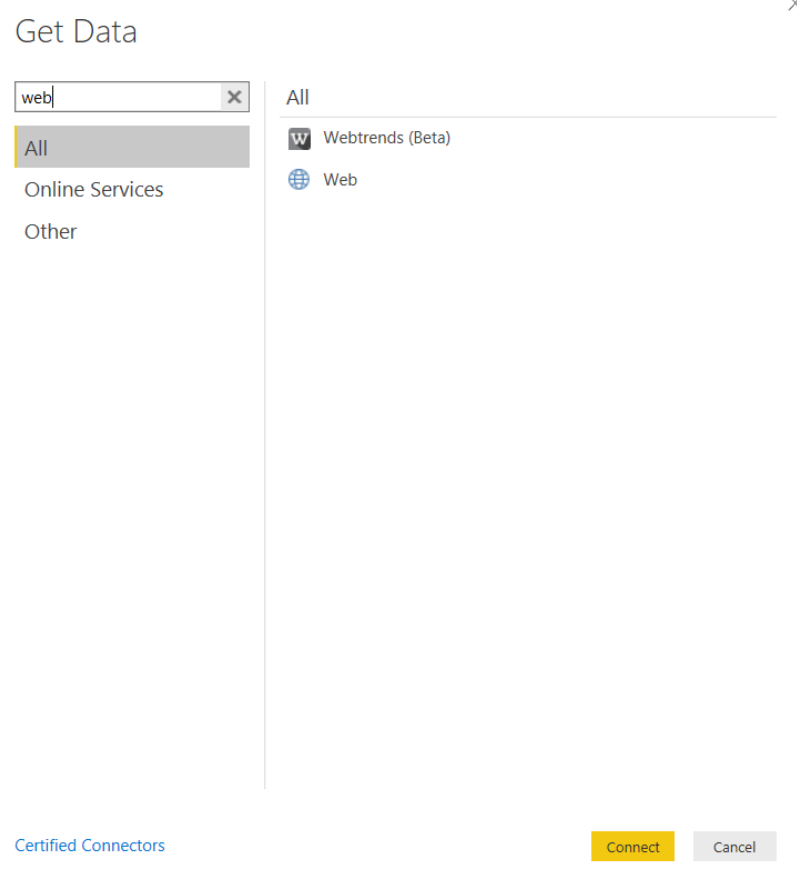
For accessing data from the website via Power BI Rest API calls, you need to search for the Web option. Select the Web option and click on the “Connect” button.
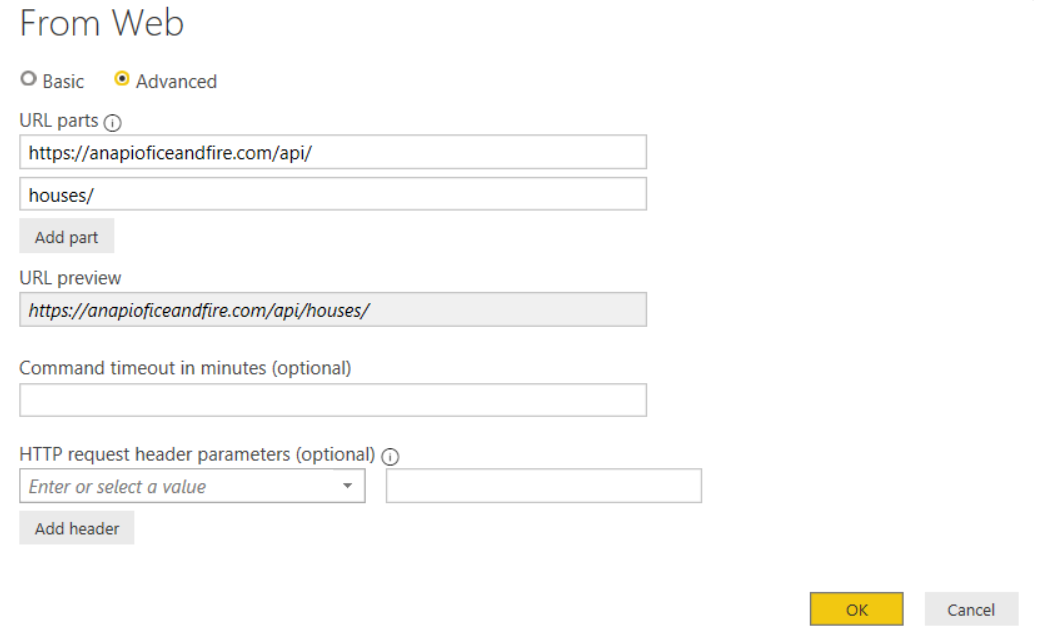
Step 2: In the “From Web” dialog box, fill in the necessary fields.
In our case, we are entering “https://anapioficeandfire.com/api/” in the first URL part, and “houses/” in the second part. In the URL preview field you will see both parts of the URL field combined.
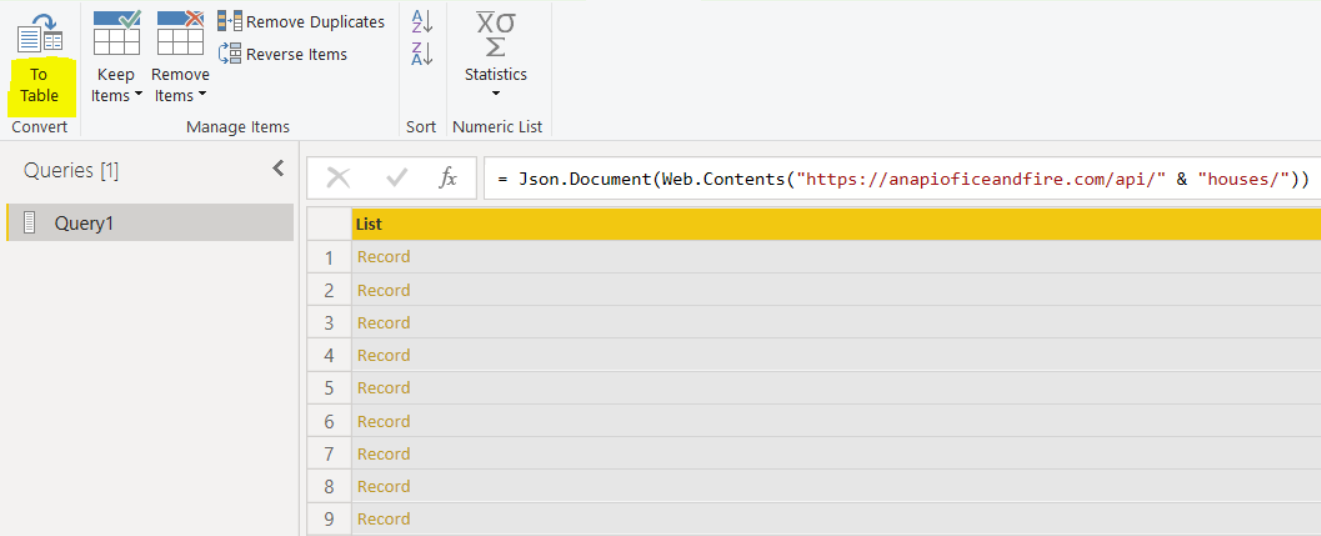
Step 3: After specifying the necessary information, click on the “OK” button. Now, the dataset is imported to Power BI.
In the Power BI Query Editor, you can find the JSON file with ten records containing other specific information.
The further process is similar to what you did in the previous method. You can follow the same steps to expand records into tables and create attractive visualizations using your JSON data, which is now converted into Power BI tables.
With the above-mentioned steps, you have successfully converted a web-based Power BI JSON to table via REST API.
Conclusion
In this article, you learned about the JSON file format, Power BI, and how Power BI convert JSON to tables using local file and Rest API calls. While this article mainly focused on converting Power BI JSON to tables in Power BI, you can also convert data sources like CSV, XML, XLS, and XLSX to Power BI tables. The process of importing such data sources follows the same process as mentioned in this article. You just have to select your data source from the “Get data” menu, and the rest of the “raw data to table” conversion process remains the same regardless of the data source.
If you are struggling to integrate your data sources through a single reliable ETL channel, Hevo Data can be of immense benefit to you.
Hevo Data, a No-code Data Pipeline provides you with a consistent and reliable solution to manage data transfer between a variety of sources and a wide variety of Desired Destinations with a few clicks.
Hevo Data with its strong integration with 150+ Data Sources (including 40+ Free Sources) such as Power BI, allows you to not only export data from your desired data sources & load it to the destination of your choice but also transform & enrich your data to make it analysis-ready. Hevo also allows integrating data from non-native sources using Hevo’s in-built REST API & Webhooks Connector. You can then focus on your key business needs and perform insightful analysis using BI tools.
Want to give Hevo a try? Sign up for a 14-day free trial and experience the feature-rich Hevo suite first hand. You may also have a look at our unbeatable pricing, which will assist you in selecting the best plan for your requirements.
FAQ on Power BI JSON to Table
How to convert JSON data to a table?
Open Power Query Editor
Load JSON File
Convert JSON to Table
Transform Data
Load Data into Excel
How to load JSON data into PowerBI?
Open Power BI Desktop
Load JSON File
Transform Data
Load the Data
How to convert JSON into Database?
Install MongoDB
Prepare the JSON Data
Import the JSON Data
Have questions to ask about Power BI JSON to table conversion? Let us know in the comment box below. We’d be happy to help.
Share it with your connections.
-
 Share To LinkedIn
-
 Share To Facebook
-
 Share To X
-
 Copy Link


