

Thanks to QuickBooks Reporting, accounting software that can help your business to achieve all this. With QuickBooks, you can create a dashboard to help you manage and monitor your business revenues and expenses.
You can also generate reports from such dashboards. In this article, you will be looking at QuickBooks Reporting and Dashboarding in depth.
Table of Contents
Introduction to QuickBooks

QuickBooks (QB) is a software that assists businesses with Bookkeeping, Accounting, Payroll, Inventory Management, and other financial processes. You can create financial statements and reports using QuickBooks. Intuit, a California-based corporation, designed QB to help automate common operations, saving time for bookkeeping and paperwork.
For creating charts, business plans, invoices, and spreadsheets, QB provides ready-to-use templates. It can also save time and effort for business owners by automating their signatures on business checks (which are scanned and uploaded for usage). QB also has a lot of advantages in terms of integration with other applications. Learn to set up the QuickBooks Import Excel and CSV Toolkit in the simplest manner possible.
Effortlessly migrate your data from QuickBooks. Hevo elevates your data migration game with its no-code platform. Ensure seamless data migration using features like:
- Seamless integration with your desired data warehouse, such as BigQuery or Redshift.
- Transform and map data easily with drag-and-drop features.
- Real-time data migration to leverage AI/ML features of BigQuery and Synapse.
Still not sure? See how Postman, the world’s leading API platform, used Hevo to save 30-40 hours of developer efforts monthly and found a one-stop solution for all its data integration needs.
Get Started with Hevo for FreeHere are a few useful features of QuickBooks
- With QuickBooks Accounting Software, you get powerful invoicing features such as Payment Reminders and Invoice Tracking at your fingertips.
- You can also access dozens of reports to help you manage your expenses. You can also use the mobile app to manage your business on the go.
- QuickBooks Accounting software also allows you to enter bills from vendors, and pay them only when they are due.
- Recurring payments can also be scheduled to save time.
- QuickBooks Accounting Software further houses free unlimited support to provide answers and useful information on running your business.
- QuickBooks allows you to get a real-time view of your cash flow.
- You can connect your bank account to automatically categorize and import transactions.
- You can also seamlessly integrate and sync with popular apps to easily snap photos of your receipts. You can store these receipts with QuickBooks Mobile.
You can also take a look at how you can setup QuickBooks for your Personal Use and how you can set up Profit and Loss Statement in QuickBooks.
Prerequisites
This is what you need for this article:
Understanding the Key Aspects of QuickBooks Reporting
QuickBooks Reporting Tools: QuickBooks Dashboards
When you log into QuickBooks, you will be taken to the dashboard.

The type of information shown on the QuickBooks dashboard will depend on your level of access.
At the top of the dashboard are the company name and the logo.
To see the account settings, click the company logo. This will open the “Account and Settings” page.
You will see 5 tabs under this page as shown below:
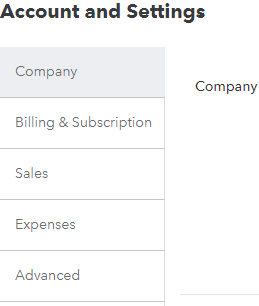
To edit the basic details of the company like the name and type, click the “Company” tab. To update your billing information, click the “Billing & Subscription” tab.
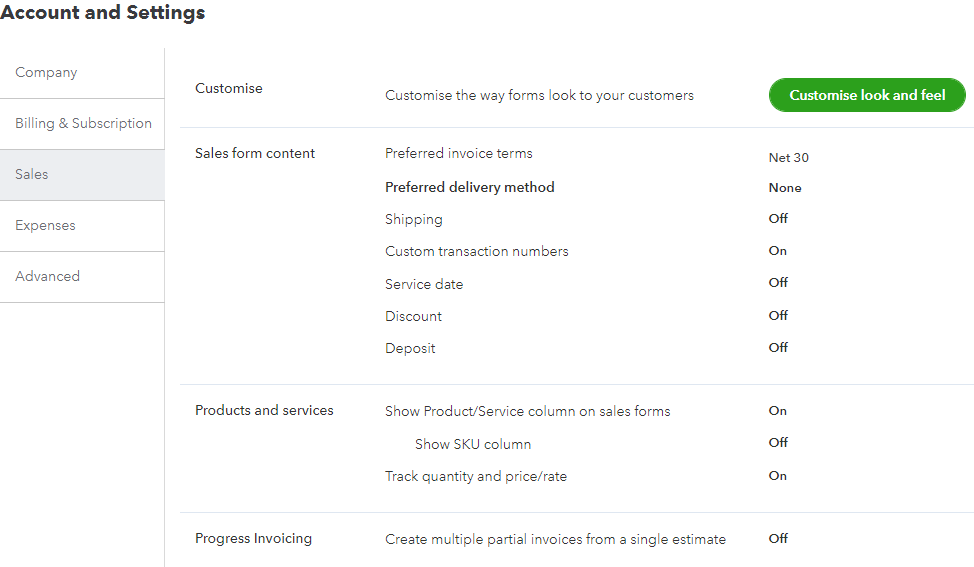
To customize the way sales pages will look and feel to the customers, click the “Sales” tab. Here, you can set form details like Sales form content, products and services, progress invoicing, messages, reminders, and more. To edit, you simply have to click the edit pen on the right.
To set up bills, expenses, and purchase orders, open the “Expenses” tab.
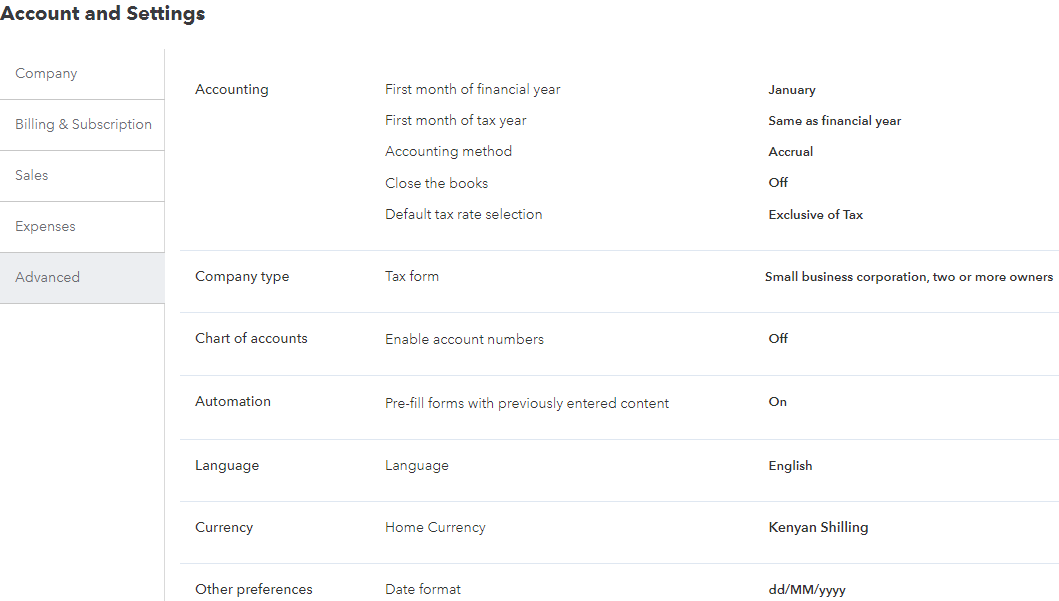
You can also find advanced settings in the “Advanced” tab and make necessary edits.
Once done with making changes, click the “Done” button at the bottom and you will be taken back to the main dashboard.
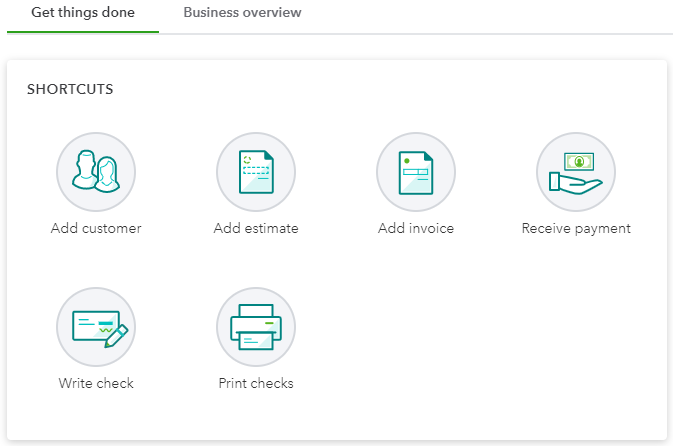
The main dashboard also has two tabs namely “Get things done” and “Business overview”.
The “Get things done” tab has shortcuts to various activities. You can use the shortcuts to create a new customer, add an invoice, write a check, etc.
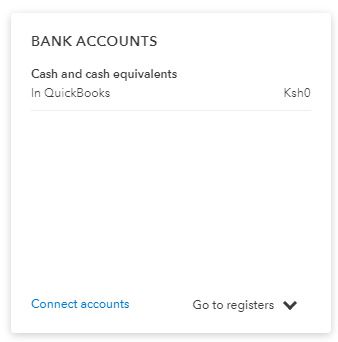
To connect to financial accounts such as your bank accounts, click the “Connect accounts” option shown within the “Bank Accounts” box.
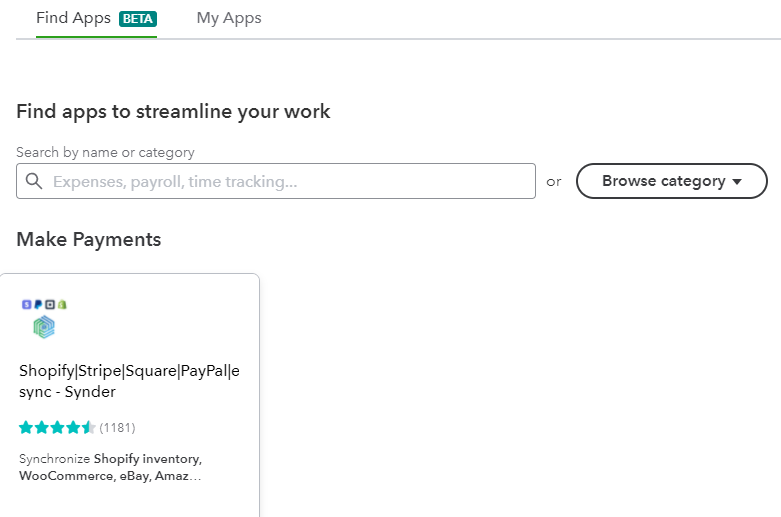
QuickBooks also supports integration with various apps like eBay, Shopify, and others to make your life easier. To integrate with these apps, click the “Discover More” box. You will be taken to a page with the list of supported apps that you can connect to.
To hide or show your financial info, you can use the Privacy toggle button shown at the top.

The “Business overview” shows information about your business in the form of visualizations. The information shown under this tab includes profit and loss, expenses, bank accounts, income, and sales.
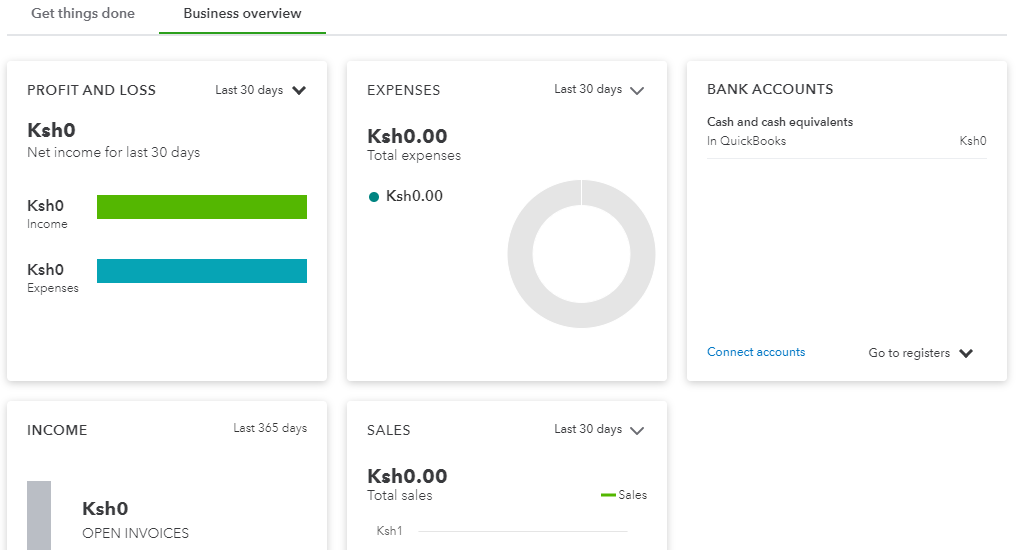
You can hide and show this information by turning the privacy toggle button on or off.
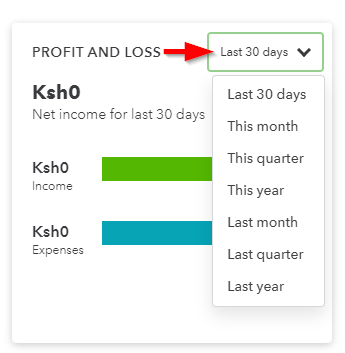
Under every widget, you will find a drop-down button that you can use to change the time shown on the visualization.
QuickBooks Reporting Tools: QuickBooks Reports
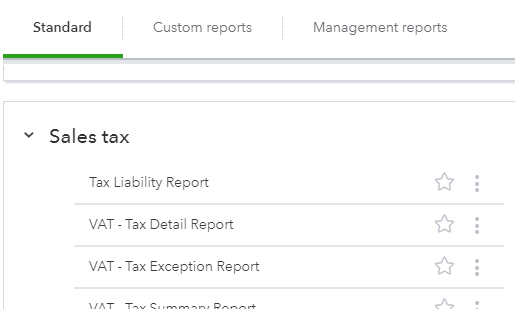
- QuickBooks reports are found under the “Reports” page which can be accessed by clicking the “Reports” .
- The reports on this page are put into three categories namely Standard, Custom reports, and Management reports.
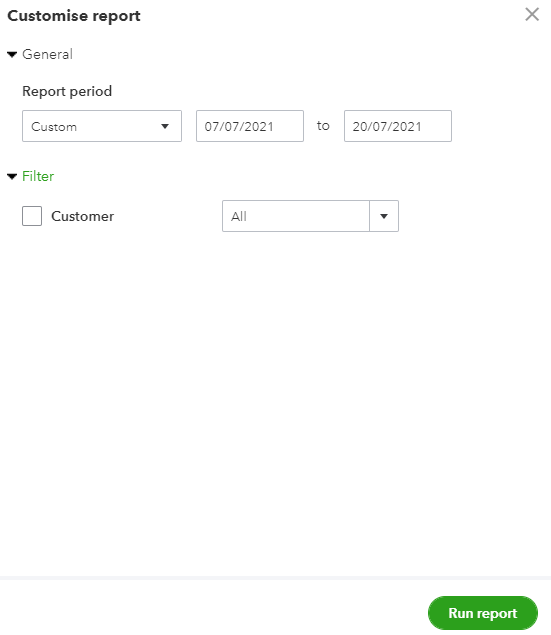
Once you open a report, you will see the “Customize” button that you can click to get options for customizing the report. You can change the time represented in the report, the title of the report, the report’s headers and footers, etc. Once you have made the changes, click the “Save Customisation” button.
QuickBooks Reporting also provides a search bar that you can use to search for the report that you are interested in.
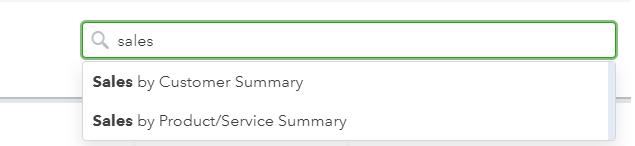
As you can see in the above image, you will get auto-suggestions as you type the name of the report.
Once the report is opened, you can make customizations, run, and save it.
After making changes, save the customizations.
How to Run a Report in QuickBooks
- Open QuickBooks: Start by logging into your QuickBooks account.
- Go to Reports: On the left-hand menu, click on the “Reports” option.
- Choose a Report: Select a report from the available list or search for a specific report using the search bar.
- Customize Your Report: Adjust the date range, filters, and other settings to match your needs.
- Run the Report: Once you’ve customized the report, click “Run Report” to view the results.
- Export or Print: If needed, you can export the report to Excel or PDF, or print it directly.
What are QuickBooks Reporting Tools
QuickBooks offers a range of reporting tools that help businesses track their financial performance. These tools allow you to generate various reports like profit and loss, balance sheets, and tax reports, all customizable to fit your needs. QuickBooks also includes features for analyzing sales, expenses, and cash flow, helping you gain valuable insights into your business. With these tools, you can automate reporting, save time, and make more informed decisions based on real-time data.
Why Use QuickBooks for Reporting
- Ease of Use: QuickBooks offers an easy-to-navigate interface, making it simple to generate and customize reports.
- Real-Time Data: Reports are updated in real-time, ensuring that you always have access to the most current financial information.
- Variety of Reports: QuickBooks provides a wide range of customizable reports, including profit and loss, balance sheets, and sales reports.
- Time-Saving: Automating report generation saves time compared to manual data collection and analysis.
- Better Decision Making: QuickBooks’ reports provide clear insights into your business’s financial health, helping you make informed decisions.
Conclusion
This blog talks about the two critical aspects of QuickBooks Reporting in great detail highlighting the QuickBooks Reports and QuickBooks Dashboards.
Extracting complex data from a diverse set of data sources like CRMs, Project management Tools, Streaming Services, Marketing Platforms can be quite challenging. This is where a simpler alternative like Hevo can save your day!
Sign up for a 14-day free trial and simplify your data integration process. Check out the pricing details to understand which plan fulfills all your business needs.
Frequently Asked Questions
1. Does QuickBooks have reporting?
Yes, QuickBooks has built-in reporting features that help you track and analyze your business finances.
2. What are the two major types of reports in QuickBooks?
The two major types of reports in QuickBooks are financial reports (like profit and loss) and tax reports (like sales tax reports).
3. What are the 4 key reporting types in QuickBooks Online?
The four key reporting types in QuickBooks Online are Profit and Loss, Balance Sheet, Cash Flow, and Sales Reports.
Share it with your connections.
-
 Share To LinkedIn
-
 Share To Facebook
-
 Share To X
-
 Copy Link


