You’re in the right place if you want to connect QuickBooks to BigQuery for better data analysis. I know how crucial it is to have your financial data in one place, ready for insightful reporting and decision-making.
In this blog, I’ll walk you through two methods to sync your QuickBooks data with BigQuery: manually and using Hevo, a powerful automation tool. Whether you prefer hands-on control or want an easy, automated solution, I’ve got you covered! Let’s dive into both options and see which one works best for you.
Table of Contents
What is Quickbooks?

QuickBooks is one of the most popular accounting software options. It is used by small and medium-sized businesses to monitor their financial situation and manage their revenue and expenses. It can be used to monitor cash flow, manage invoices, settle accounts, generate reports, and file taxes. Utilize this tool to keep track of your clients, vendors, consumers, inventory, and finances.
With the Report Center, you can monitor aspects of your company, such as sales, income, costs, and overall growth. QuickBooks automates business management tasks such as sales tax calculation and product tracking, and it automatically updates transactions in your customer/vendor, item, and report sections. Both the on-premises and cloud-based editions of QuickBooks are accessible.
Key Features of Quickbooks
- You may easily produce and modify reports to track your company’s performance.
- Quickbooks can be customized to accommodate a person’s unique needs and tastes, making them suitable for various businesses.
What is BigQuery?

Google offers BigQuery, a fully managed Cloud data warehousing platform that provides a high level of abstraction. As a fully managed warehouse, businesses do not need to maintain any physical infrastructure or database administrators. Because of its pay-as-you-go pricing model, users only have to pay for the queries they run.
Key Features of BigQuery
- Storage: You can be sure it will automatically scale in response to shifting data requirements by saying “scaling on demand.” Thanks to this system’s Colossus (Google Global Storage System) base and columnar data storage, users can work immediately on compressed data without decompressing files on the fly.
- Real-time Analytics: Google BigQuery distributes any quantity of resources optimally to achieve the best performance and outcomes. Thus, you can produce business reports as needed while staying updated with real-time data transfers and faster analytics.
- ML Capabilities: Using conventional SQL commands, you can design and build data models with machine learning capabilities using Google BigQuery ML. This makes less of a need for technical machine learning expertise and makes it possible for your data analysts to assess ML models directly.
What is the need for QuickBooks- BigQuery Connection?
- Centralized Data Storage: Store all QuickBooks data in a single, centralized location, improving data accessibility and reducing data silos.
- Deeper Insights: BigQuery’s powerful SQL capabilities and advanced analytics features allow for complex queries and in-depth analysis of QuickBooks data.
- Customized Reports: Create highly customized reports tailored to specific business needs.
- Data-Driven Decisions: Leverage analyzed data to make informed business decisions regarding budgeting, forecasting, and resource allocation.
Leverage BigQuery’s features like machine learning, search, geospatial analysis, and business intelligence by migrating your data to it using Hevo. Skip long and tedious manual setup and choose Hevo’s no-code platform to:
- Migrate your data to BigQuery to visualize and analyze it using BigQuery analytics.
- Transform and map data easily with drag-and-drop features.
- Real-time data migration to leverage AI/ML features of BigQuery.
Try Hevo and discover why 2000+ customers like Ebury have chosen Hevo over tools like Fivetran and Stitch to upgrade to a modern data stack.
Get Started with Hevo for FreeWhat are the Methods to Connect Quickbooks with BigQuery?
Method 1: Using an Automated Data Pipeline Like Hevo
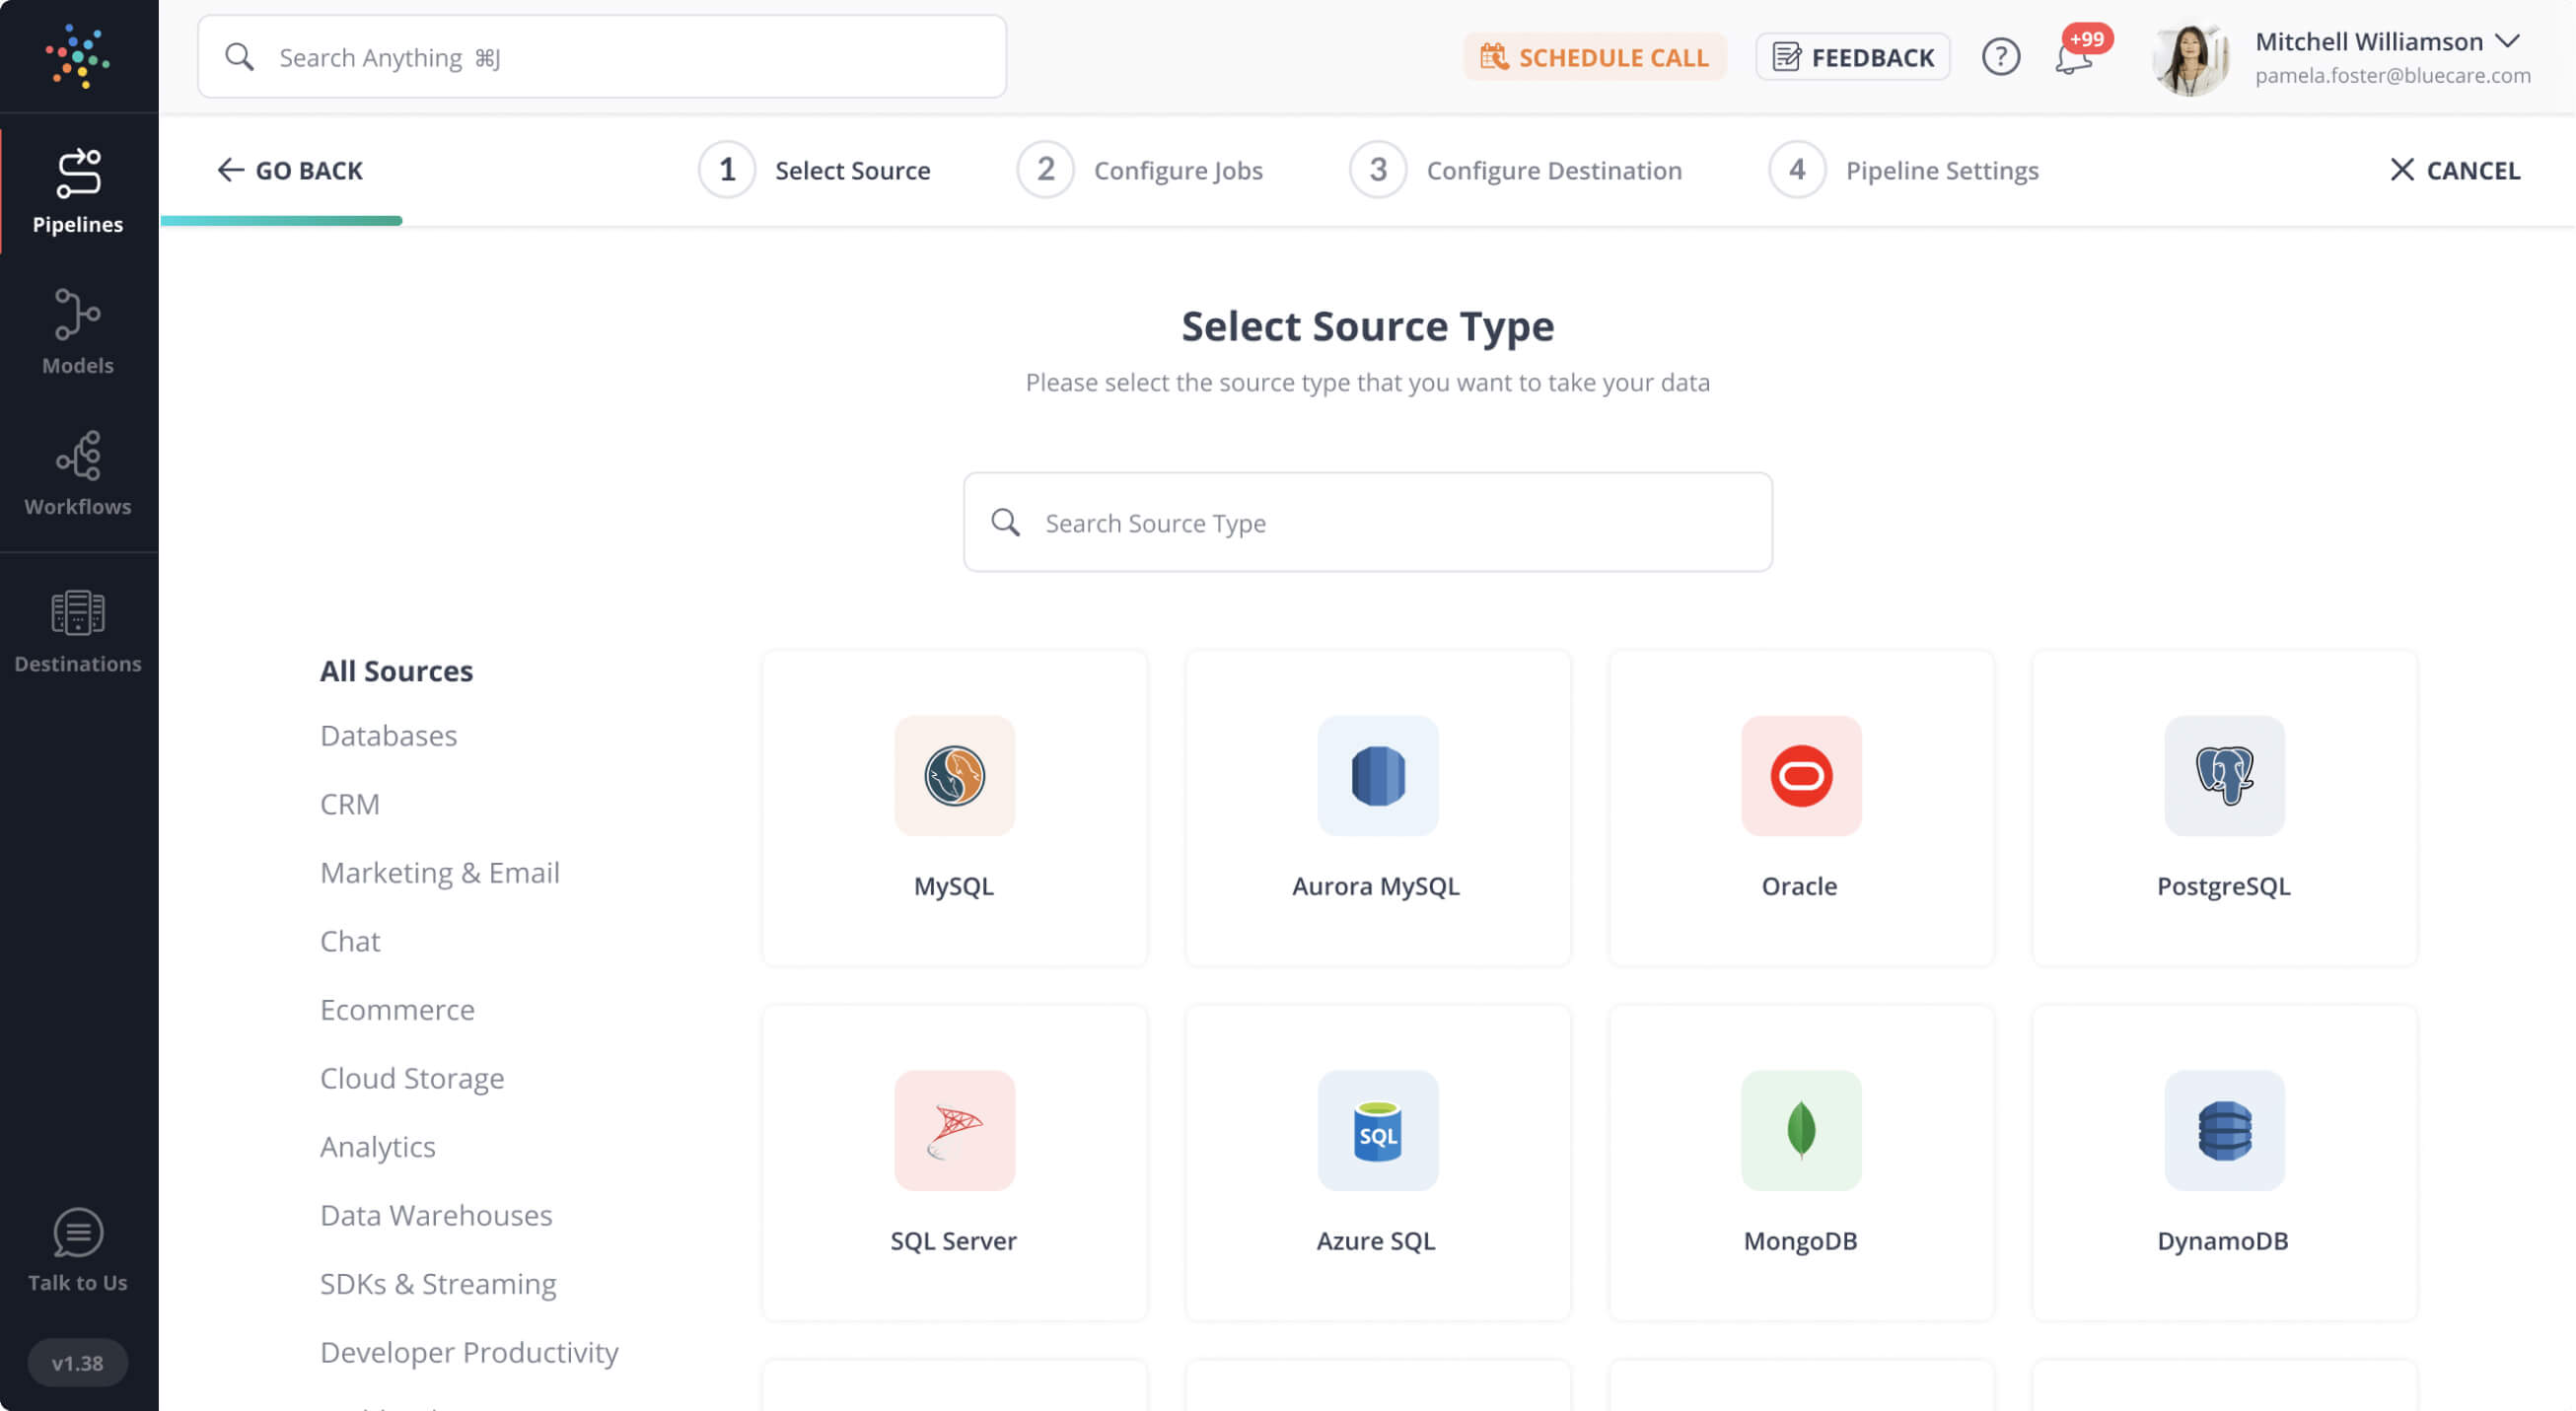
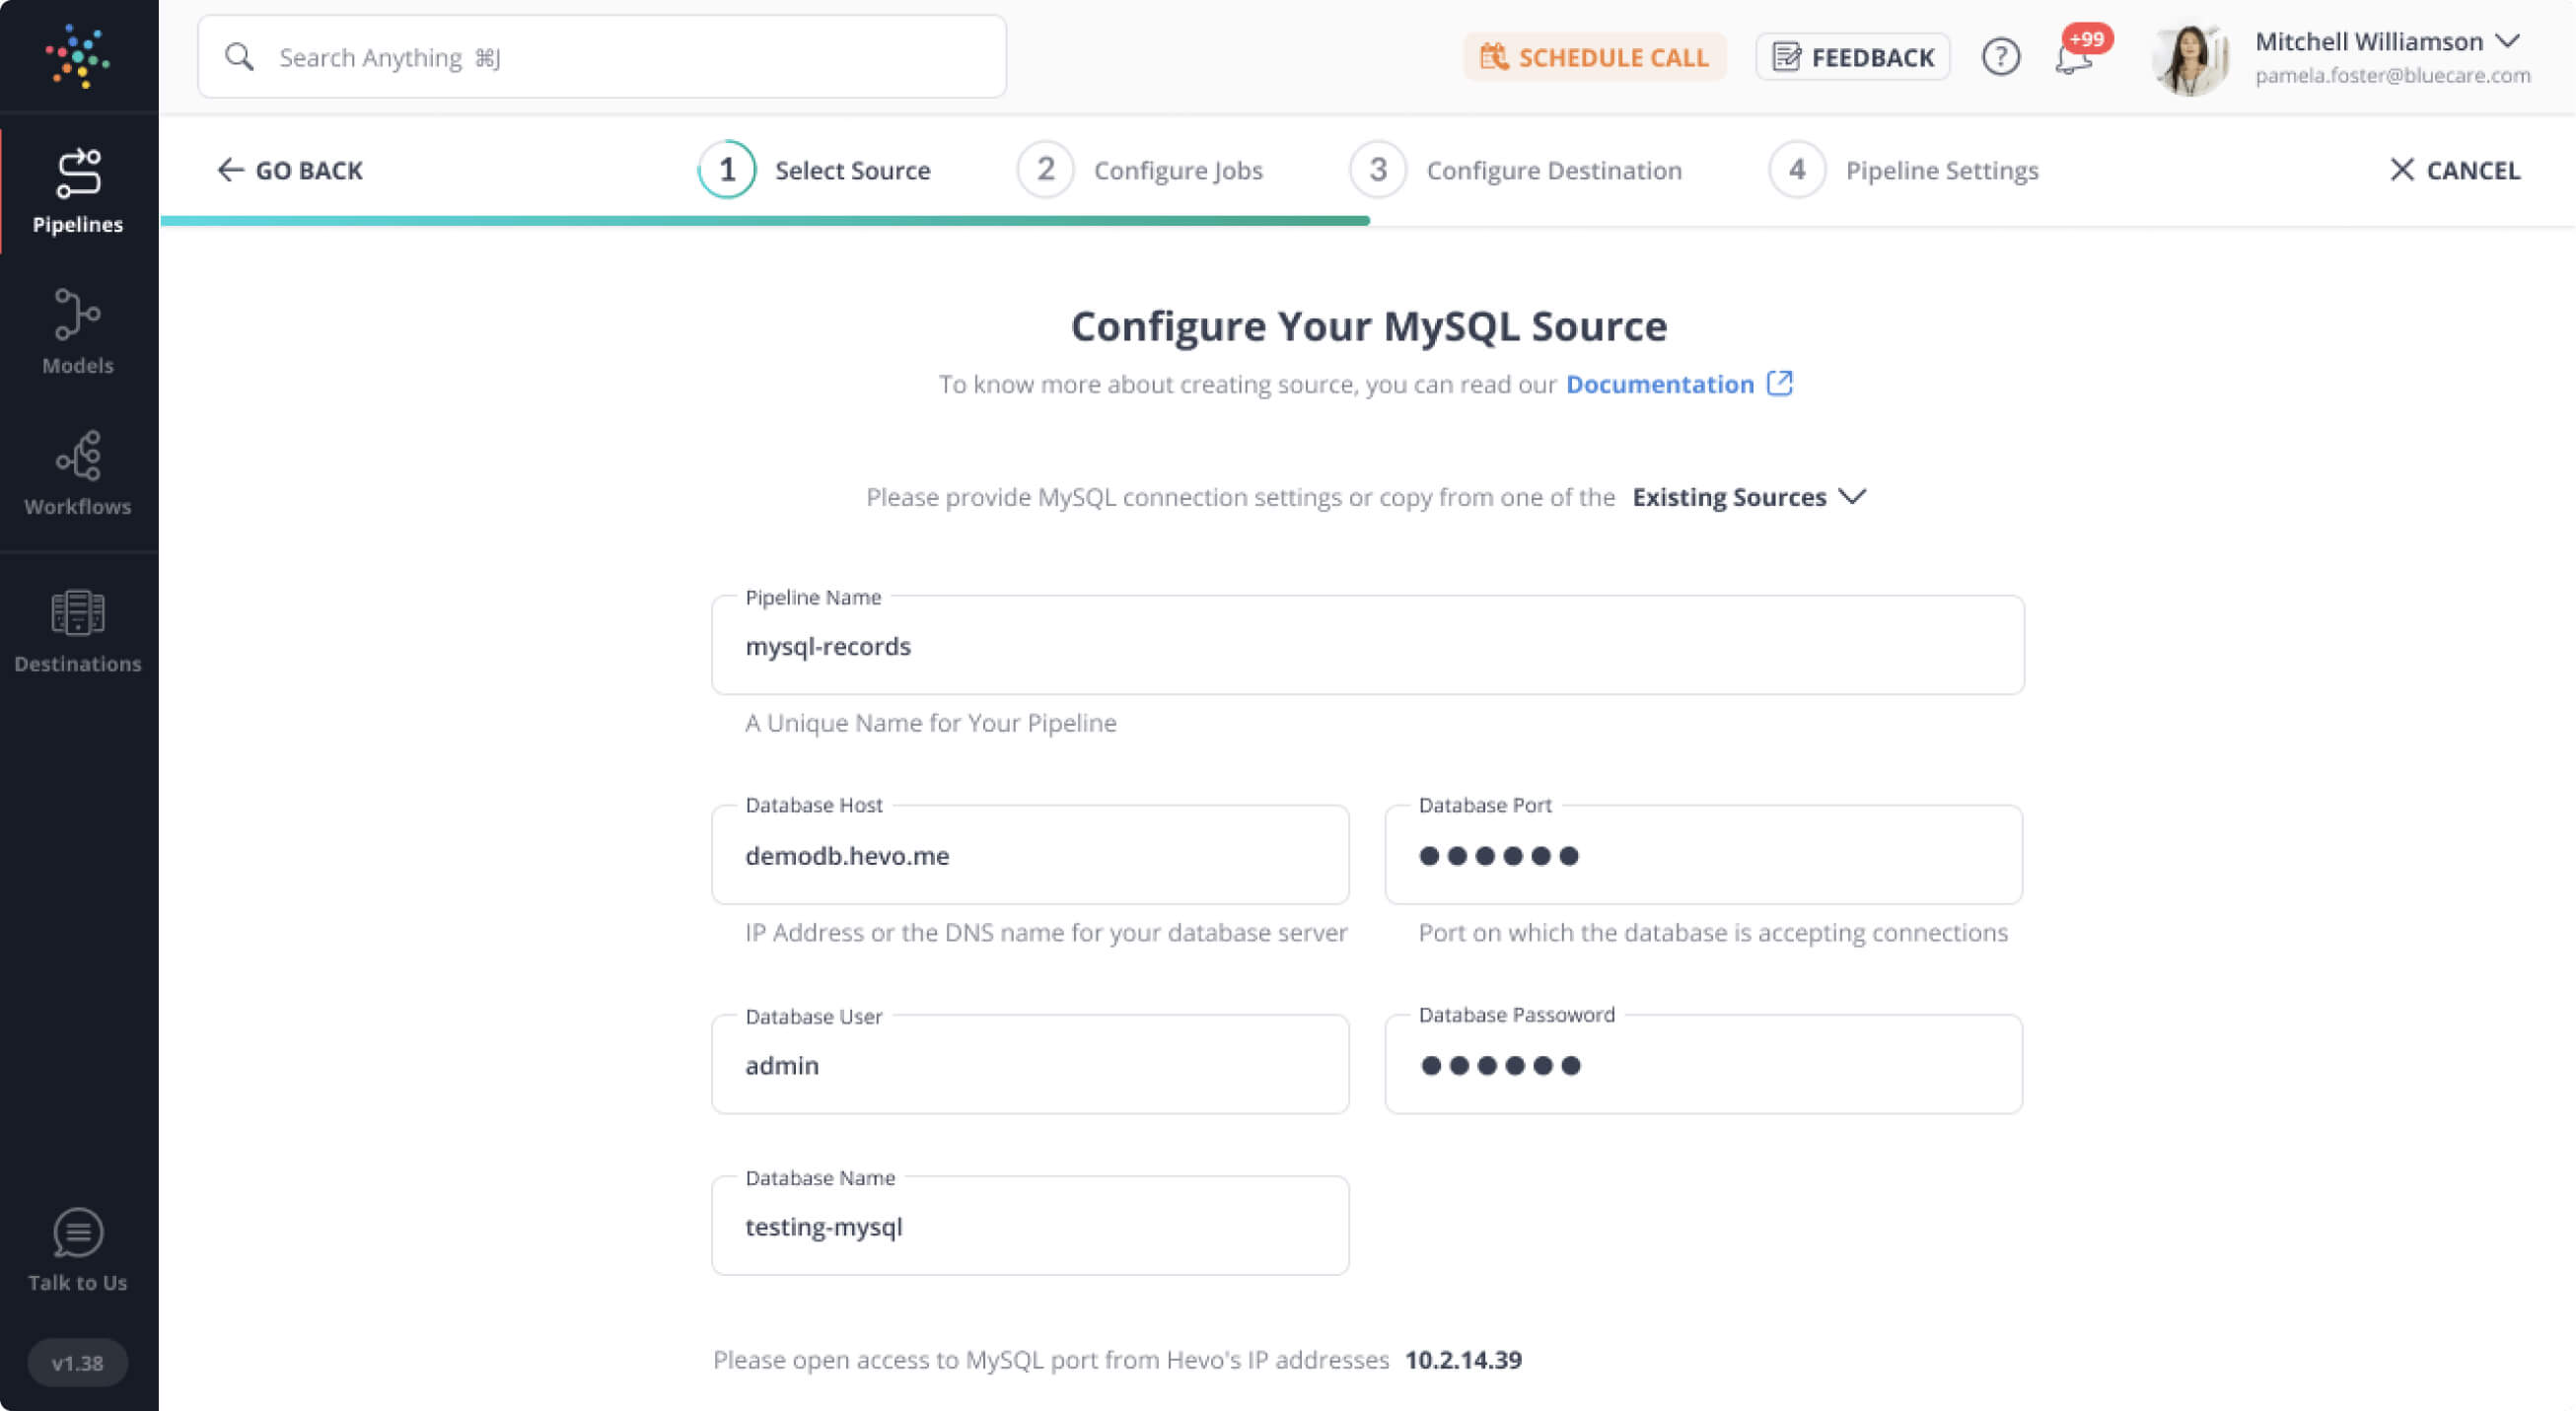
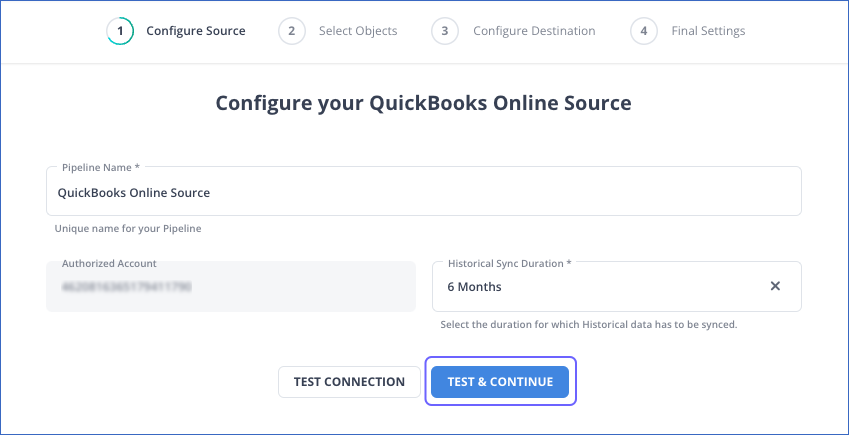
Step 1: Configure Quickbooks as a Source
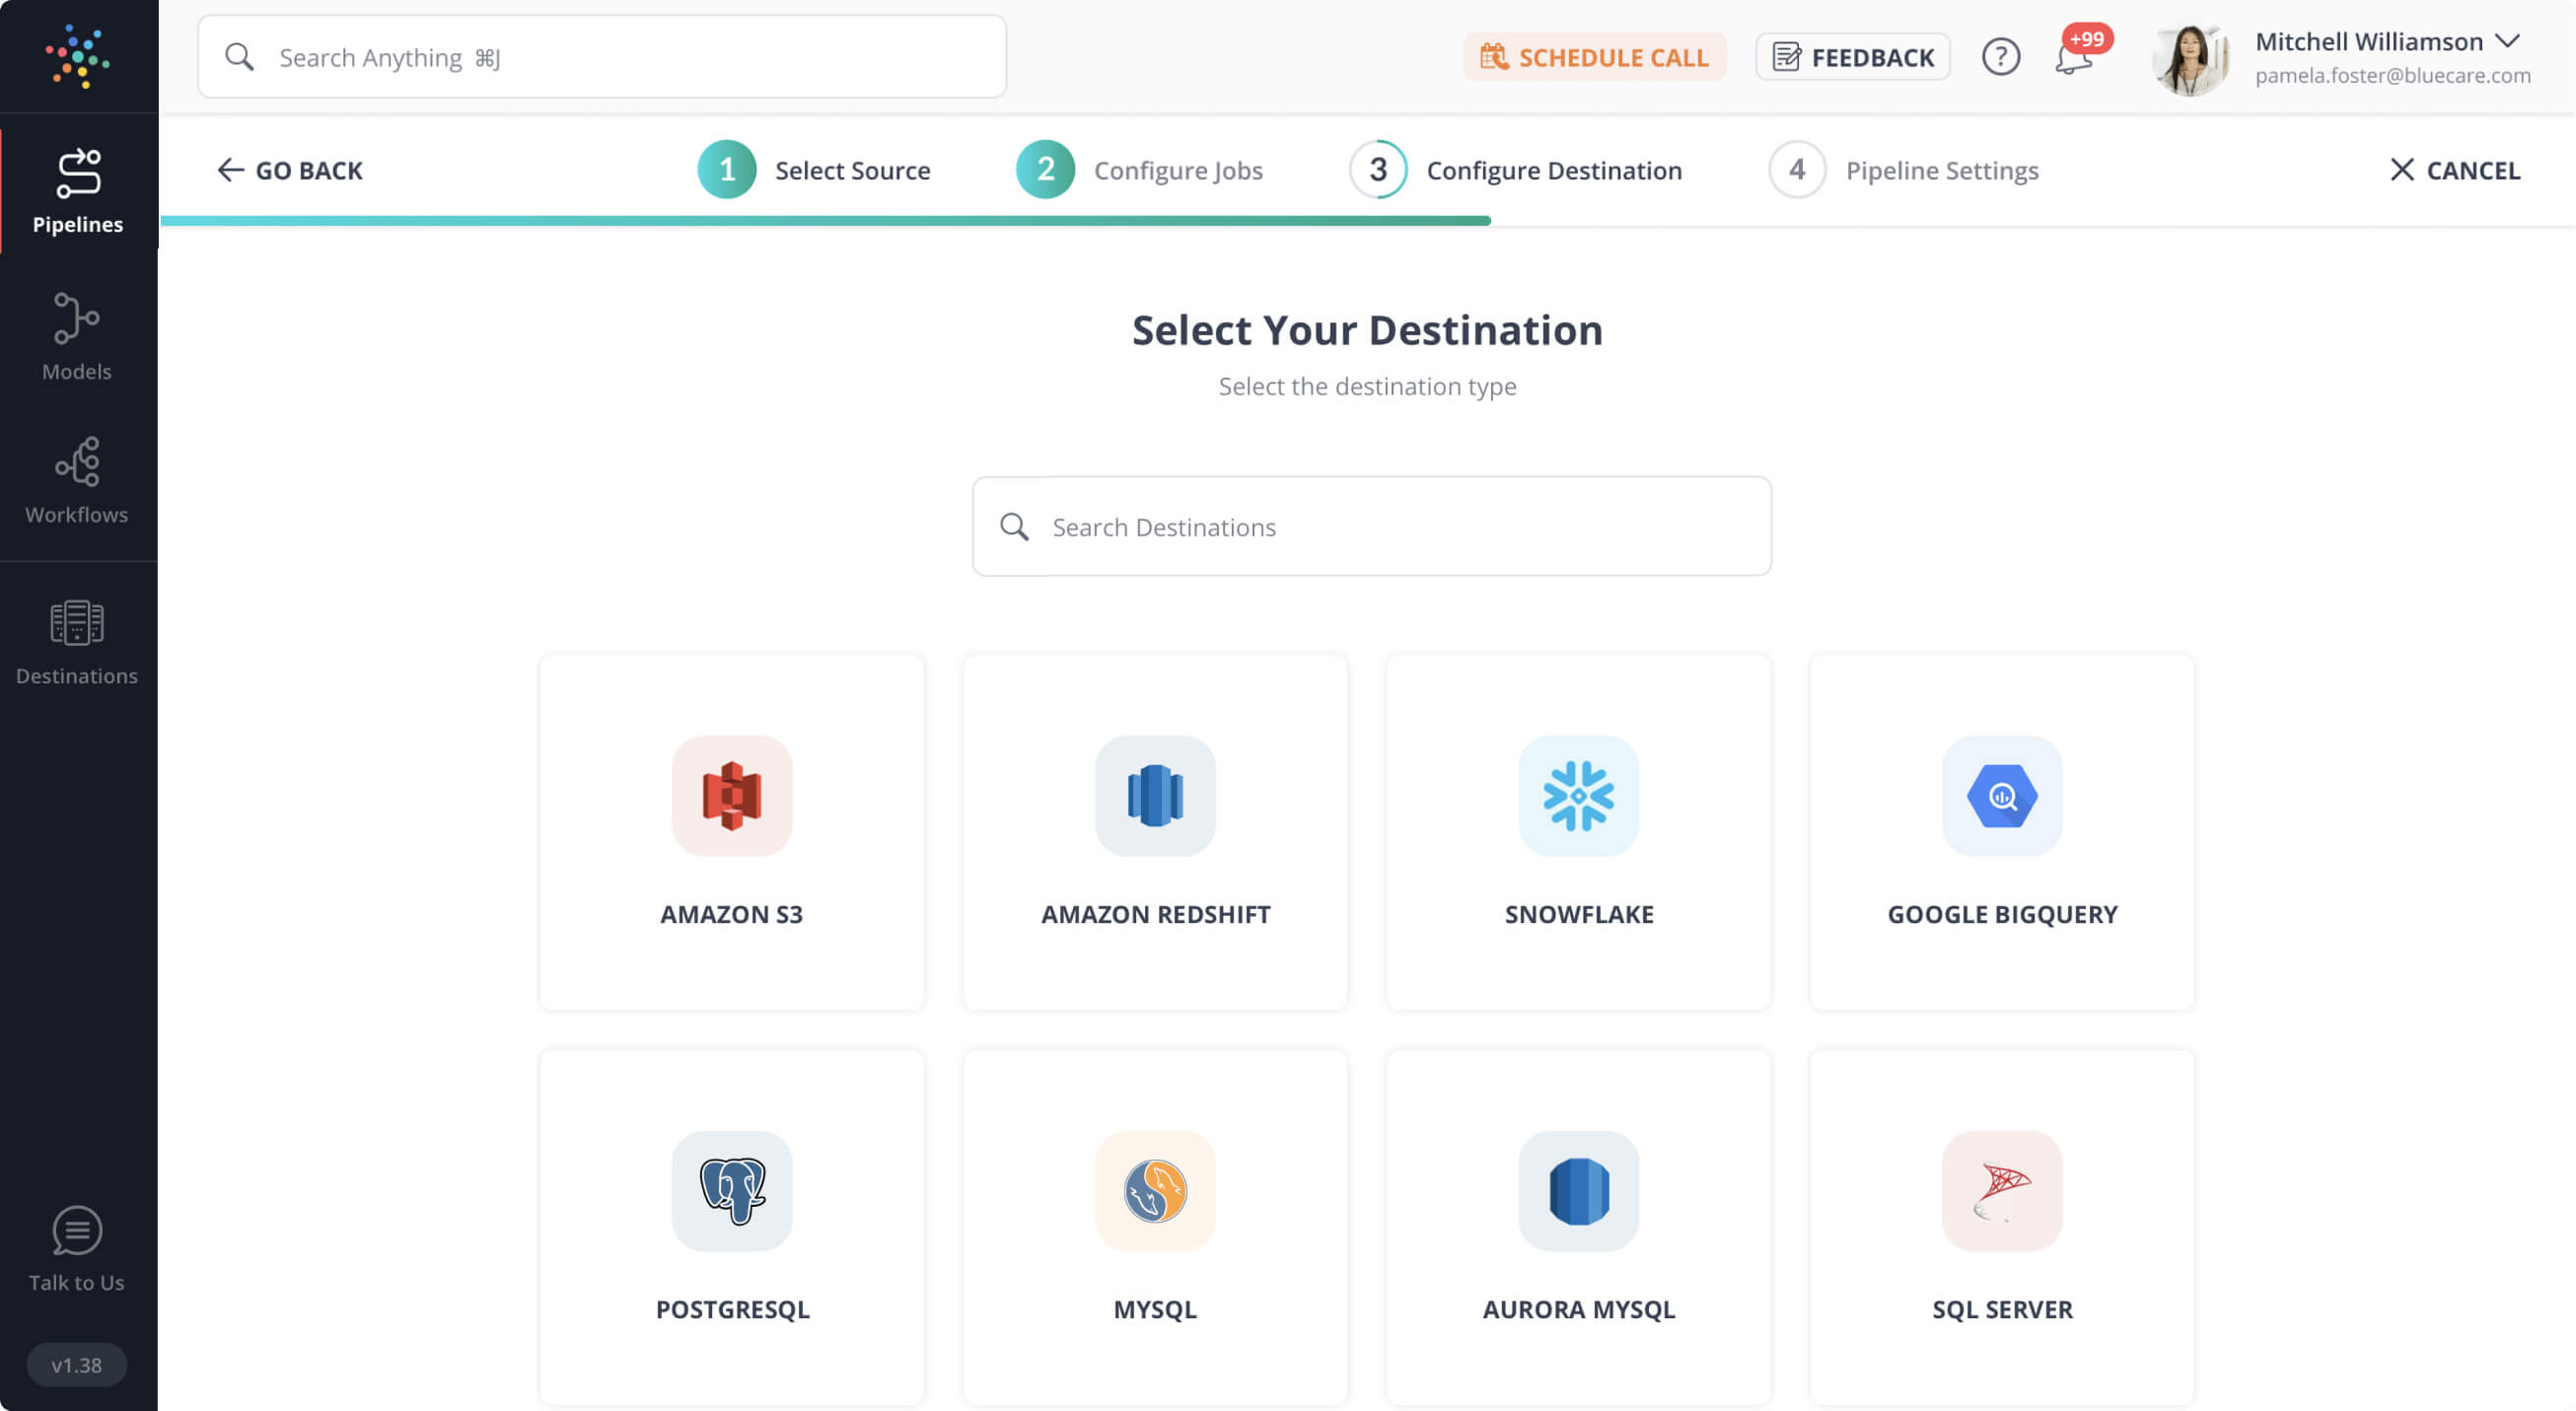
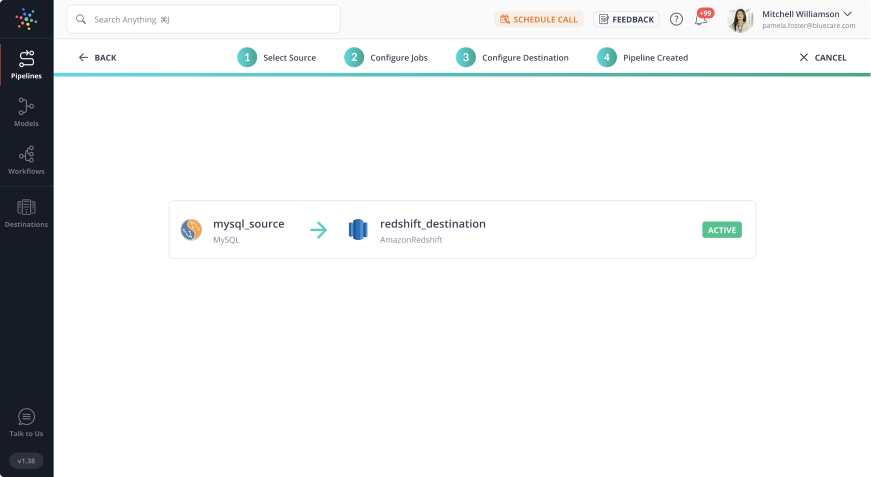
Step 2: Configure BigQuery as a Destination

To learn more about the steps, visit Quickbooks connector details and Hevo’s Google BigQuery documentation.
Method 2: Manually using CSV Files
You cannot directly export the data from Quickbooks into BigQuery. You first have to export data from Quickbooks as a CSV file and then load the CSV file into BigQuery.
Step 1: Export Data from Quickbooks as CSV
The first step is to export data from QuickBooks as CSV files. In Quickbooks, you can have CSV files for Customers/Vendors, Items, and Reports.
Customers/Vendors
- Activate the Customer/Vendor Center.
- Choose the Excel drop-down and then select:
- If you want to export customer/vendor data, including name, balances, and contact details, select Export Customer/Vendor List.
- If you want to export transactions, select Export Transactions (either by name or transaction type).
- Select “Create comma-separated values (.csv) file” from the Export window.
- Choose Export and then choose where you wish to save the file after giving it a name.
Item
- Item List can be found under the Lists menu.
- Export all items that are available after using the Excel drop-down.
- Select Create comma-separated values (.csv) file from the Export window.
- Choose Export and then choose where you wish to save the file after giving it a name.
Report
- Check out the report, choose “Excel” from the drop-down menu at the report’s top, and select “Create a New Worksheet.”
- “Create a comma-separated value (.csv)” file by selecting it on the Send Report to Excel window.
- Choose Export and then choose the location where you wish to save the file after giving it a name.

Step 2: Load CSV Data into BigQuery
The following steps can be used to load CSV data into BigQuery’s basic Web UI:
Click “Create table” and “Create table from” on your Web console. Now you have successfully exported Quickbooks data into BigQuery.

- The CSV file that will serve as the source for your new table can then be specified.

- The “Source” option allows you to choose from a wide range of sources, including cloud storage.
- Choose CSV under “File format.”
- Give your table a name, then choose a database.

- You may provide a sample JSON or select “auto-detect” in the schema specification to specify the schema.
- Additional adjustable settings include the field delimiter, skipping header rows, the number of permissible errors, jagged rows, and other variables.
- By selecting “Create Table,” you may retrieve your CSV, choose the table’s schema, build it, and add CSV data to it.
Limitations of Manual Method
- Data can only be moved from Quickbooks to BigQuery in one direction. Two-way sync is required to maintain and update both tools.
- The manual process takes time because the records need to be updated often. This wastes time and resources that could be used for more crucial company duties.
- Some users may find the engineering bandwidth needed to maintain workflows across numerous platforms and update current data bothersome.
- No transformation is possible during data transport. This could be a big problem for businesses that wish to edit their data before moving it from Quickbooks.
Method 3: Using API
QuickBooks API Rate Limits:
API Request Limits: The QuickBooks API allows 500 API requests per realm/company per user per minute.
BigQuery API Rate Limits:
API Request Limits: BigQuery API enforces a per-project rate limit, which varies depending on the type of API request (queries, load jobs, etc.).
Step 1: Extract data from QuickBooks
Let’s discuss how to access and extract data through the QuickBooks web API. The API is designed around the groups of resources below.
1. Transaction resources.
2. Name list resources.
3. Report resources
4. Supporting resources.
Note: Report resources include all the reports that QuickBooks also offers. Their data model is different from that of other resources. Other resources contain entities defined by QuickBooks. Each has a different data model serialized in JSON.
Bonus tips to keep in mind while dealing with QuickBooks API:
1. Be aware of the API limits while using.
2. API keys are used to authenticate on QuickBooks.
Step 2: Prepare data by modifying
You need to perform transformation based on how you want to modify your data. The factors considered are,
- Any limitation your database has when data is loaded.
- The end goal of the data integration (analysis you want to perform)
The system has limitations regarding the supported data types and data structures. Suppose you want to move data to Google BigQuery. Because of its capability, you can directly send nested data like JSON. However, when your data store is in tabular format, like Microsoft SQL Server, you must flatten your data before moving it to the database.
You need to select the right data types based on the destination and the data types the API exposes. Because these limit the ability to perform queries and what analysts can do directly on the database.
QuickBooks’s data model is rich. Therefore, you need to flatten the resources you can access and divide them into multiple tables.
QuickBooks resources, specifically the reports, are organized in a nested tabular format similar to a spreadsheet. To ensure compatibility with a database data model, you must redesign, parse, and convert these reports into a standard tabular database storage structure.
You can use the access token to make API requests to fetch data from QuickBooks, such as invoices, customers, or transactions.
# QuickBooks API endpoint and headers

api_endpoint = 'https://quickbooks.api.intuit.com/v3/company/{realm_id}/query'

headers = {

    'Authorization': f'Bearer {access_token}',

    'Accept': 'application/json',

}

# Example query to fetch invoices

query = "SELECT * FROM Invoice"

params = {

    'query': query,

}

response = requests.get(api_endpoint, headers=headers, params=params)

invoices_data = response.json()['QueryResponse']['Invoice']
Step 3: Move data to Google BigQuery
Use any of the following supported data sources for this.
1. Google Cloud Storage (You can do this by using the console directly)
2. A POST request (JSON APIs can help you with not only extraction but also the loading of data into our data warehouse. You can do an HTTP POST request using CURL or Postman.)
3. Google Cloud Datastore Backup
4. Streaming insert
Once your data is in Google Cloud Storage, create a Load Job for BigQuery to load the data. Provide source URIs to point the job to the source data in Cloud Storage that you want to import.
Use the BigQuery API to insert fetched data from QuickBooks into a BigQuery dataset and table.
from google.cloud import bigquery
# Initialize BigQuery client

client = bigquery.Client()

# Specify BigQuery dataset and table

dataset_id = 'your_dataset_id'

table_id = 'your_table_id'

# Insert data into BigQuery

job_config = bigquery.LoadJobConfig()

job_config.autodetect = True  # Automatically infer schema

job_config.write_disposition = 'WRITE_TRUNCATE'  # Replace existing table data

table_ref = client.dataset(dataset_id).table(table_id)

job = client.load_table_from_json(invoices_data, table_ref, job_config=job_config)

job.result()  # Wait for the job to complete
Limitation of using API
- When you are dealing with a large volume of data, using API will be difficult. There will be restrictions in pulling data due to API rate limits.
Use Cases of Integrating Quickbooks to Google BigQuery:
- Data Analytics: This integration enables you to run complex analytical queries on large volumes of data. You can also perform real-time analysis on streaming data sources.
- IoT: Connecting Quickbooks to Google Sheets can help Internet of Things (IoT) devices analyze large volumes of data and derive meaningful insights.
- Business Intelligence (BI): Building interactive dashboards and reports can make your decisions data-driven. To achieve this, you can migrate from Quickbooks to Google BigQuery. It also helps to do better financial analysis by facilitating forecasting, budgeting, and performance analysis.
Conclusion
In conclusion, connecting QuickBooks and BigQuery can greatly enhance your data analysis. The manual method offers flexibility but requires more data extraction and maintenance effort. It’s best suited for businesses with infrequent data transfers or smaller volumes. Alternatively, using Hevo automates the entire process, saving time, minimizing errors, and ensuring up-to-date data with minimal maintenance.
Hevo’s no-code interface streamlines data integration, making it ideal for businesses looking for efficiency and scalability. Ultimately, the choice depends on your specific needs—prioritizing control or seeking an automated, hassle-free solution. Start using Hevo today and simplify your QuickBooks-BigQuery integration! Learn how to transfer data from QuickBooks to Redshift to enhance your data integration.
FAQs
1. Does QuickBooks integrate with Google?
Yes, QuickBooks integrates with Google through various methods and applications.
2. What is ODBC in QuickBooks?
In QuickBooks, ODBC (Open Database Connectivity) refers to a standard interface that allows applications to access data in QuickBooks databases using SQL queries.
3. Can the IRS access QuickBooks?
The IRS (Internal Revenue Service) does not have direct access to QuickBooks or any other accounting software of individual taxpayers or businesses.
4. Can you integrate QuickBooks with Google Sheets?
Yes, it is possible to integrate QuickBooks with Google Sheets.

Share it with your connections.
-
 Share To X
-
 Share To LinkedIn
-
 Share To Facebook
-
 Copy Link