

Data Analysis help organization extract meaningful insights from their business data. The raw data in multiple data sources can be analyzed, visualized, and used to make smarter data-driven business decisions. Several Business Intelligence tools are available in the market helping companies perform Data Analysis and create reports.
Tableau is a widely used Data Visualization tool used by organizations for Data Analysis and Reporting. Creating attractive dashboards filled with multiple charts, graphs and KPIs enhanced the user experience and help them keep track of business activities. One of the widely used charts is Tableau Waterfall Chart.
Tableau Waterfall Chart comes with many customizations that help users understand data better. In this blog, you will learn how to create Waterfall Chart in Tableau and 3 simple ways to create an attractive Tableau Waterfall Chart.
Table of Contents
What is Tableau?

Tableau is a Data Analytics and Data Visualization tool for Business Intelligence. It helps companies to visualize and understand the raw data. Business professionals across organizations use Tableau to make their work easier for analyzing data, creating reports, and monitoring dashboards.
Tableau is currently headquartered in Washington and was acquired by Salesforce in 2019 for $15.9 billion. Even non-technical users can easily create attractive dashboards and simplify their Data Analysis. With the help of Tableau, users can schedule jobs for dashboards and reports, monitor data, and provide debussing information.
Looking for the best ETL tools to connect your data sources? Rest assured, Hevo’s no-code platform helps streamline your ETL process. Try Hevo and equip your team to:
- Integrate data from 150+ sources(60+ free sources).
- Utilize drag-and-drop and custom Python script features to transform your data.
- Risk management and security framework for cloud-based systems with SOC2 Compliance.
Try Hevo and discover why 2000+ customers have chosen Hevo over tools like AWS DMS to upgrade to a modern data stack.
Get Started with Hevo for FreeKey Features of Tableau
Some of the main features of Tableau are listed below:
- Predictive Analysis: Tableau allows users to use Machine Learning in their Data Analysis to save time and drill deeper into the data to predict future trends.
- Robust Security: Tableau follows all the security protocols to ensure the protection of data and provide various authentication and data access controls to users.
- Bridge Multi-Pool: Tableau comes with multi-network connectivity support using online schedules that allow companies to access and analyze their private data in Tableau Online.
- Live and In-Memory Data: Tableau comes with live connectivity support with data sources and allows users to extract data from external sources as in-memory data.
What is Waterfall Chart?
A particular kind of bar chart called a waterfall chart explains the reasoning behind the net change in a value between two points. A waterfall chart breaks down and displays each individual element that made up the net change, rather than just showing the initial value in one bar and the ending value in another. The following illustration uses statistics to tell a tale.
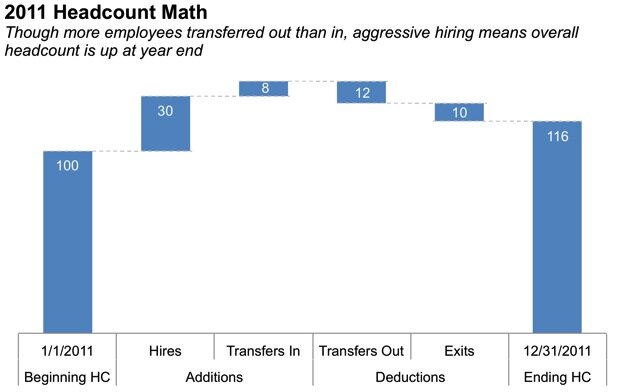
From its shape, the waterfall chart receives its name. In a waterfall chart, the first bar typically starts at zero and reflects the initial value of the measure under consideration. One last bar, which represents the ultimate quantity of our chosen measure and (like the first bar) begins from the zero baseline of our x-axis, follows a sequence of smaller bars that appear to be floating in space (frequently rising to a peak and then dropping towards the baseline).
Benefits of Using Waterfall Chart in Tableau:
- Improves Communication: Facilitates easy storytelling and presentation of data to non-technical audiences.
- Clear Visual Representation: Effectively shows incremental changes over time or between stages.
- Simplifies Complex Data: Breaks down data into manageable segments for better understanding.
- Highlights Key Changes: Easily identifies major increases or decreases within data.
- Supports Decision-Making: Helps stakeholders quickly assess data impact and trends.
- Interactive Analysis: Allows for filtering and customization to focus on specific data points.
- Versatile Application: Suitable for financial analysis, sales performance, and project tracking.
Prerequisites
- Basic knowledge of Tableau.
Steps to Create Tableau Waterfall Chart
For creating a Tableau Waterfall Chart, the Superstore dataset that is Tableau’s sample dataset will be used in this tutorial. Using this the users will have the custom options to choose the dimension member, highlight the selections and even show the percentage contribution of each data point on a bar chart.
Step 1: Importing Data in Tableau
First, import the Superstore dataset from the sample datasets in Tableau. Then define the measure of interest onto the Rows Shelf and your dimension of interest onto the Columns Shelf. Using the data, by default, Tableau will create the bar chart.

To make the bars compare not only by the sizes of each mark but also along with their ranks going from left to right, you need to sort the bars in descending order.
Step 2: Adding Numbers in the Chart
Now, right-click on the measure of interest on the Rows Shelf and hover over or select the “Quick Table Calculation” option and then click on the “Running Total” option. It will add the Running Total table calculation to the Sales measure.


Step 3: Creating Gantt Bars
Next, you need to change the “Marks” type from automatic to Automatic (Bar) to Gantt Bar by clicking in the drop-down menu under the Marks section located at the left-hand side toolbar.
Also, click on the “Size” card under the Marks section and then place the measure of interest to Sales for this specific tutorial to Tableau Waterfall Chart based on the dataset.

Step 4: Standardizing the Chart
Now, you will see that the blocks in the chart are of the correct size, but the problem is they are starting from the location of each Gantt mark and going in the Up direction because the values of the Sales are positive.
To correct this and make each block place from where the last block left off the value, you have to reverse the Sales values to negative. You can do this by clicking on the Sales card from the Marks section. Then, select the Sales option and add the negative (-) operator before the SUM([Sales]) in the text field. Hit the Enter button.


Step 5: Waterfall Chart Showing Positive and Negative Value
Notice that the chart is now upside down compared to the initial Tableau Waterfall Chart because you have sorted the Marks in descending order and changed the sum of Sales values to negative. These configurations have put the worst performer at first.
You can reverse this to place the worst performer in the last by going to the Columns Shelf, then right-click and select the “Sort” option. Next, change the “Field Name” drop-down option back to the original measure.

You can also perform various optional steps such as Adding Colors and Add Filters to the chart. That’s it! You have successfully created a fundamental Tableau Waterfall Chart.
3 Ways to Create Actionable Tableau Waterfall Charts
In this section, you will learn 3 simple ways to create Tableau Waterfall Chart. You can work on the previous chart read about in the previous section. Here, you will go through steps to make an engaging Tableau Waterfall Chart. The 3 ways to make a wonderful Tableau Waterfall Chart are listed below.
- Highlighting the Tableau Waterfall Chart Using User Selections
- Making Custom Visualization for Tableau Waterfall Chart Totals
- Creating Custom Range Highlighters Using the Reference Bands
1. Highlighting the Tableau Waterfall Chart Using User Selections
Highlighting the Tableau Waterfall Chart dimensions depending on the parameter selection provides a single parameter control. The 3 prominent benefits of highlighting the Tableau Waterfall Chart are listed below:
- You can add color to the dimension on waterfall chart tableau.
- It helps to show the performance labels for the selected dimensions.
- You can highlight the same dimension member across multiple sheets on a dashboard.
In this tutorial to Tableau Waterfall Chart, the previous chart is used that you have just created in the previous section.
First, right-click on the dimension that you want to highlight. Then, hover over the “Create” option and select the “Parameter” option. Using this, a parameter is automatically created with the correct data type and prepopulates a list of the dimensions.
Also, it is recommended to add an allowable value option to “All” that will provide an option not to highlight a specific dimension member.
Now, click on the Color card under the Marks section. Here, create a field with the formula as [Ship Mode] = [Ship Mode Parameter].

The Ship Mode dimension can be replaced based on the data source. You can also see access the Parameter Control by choosing the “Ship Mode” parameter and selecting the “Show Parameter” option.
Now, notice that the Tableau Waterfall Chart is broken by the cascading waterfall effect because Waterfall Chart is being used to generate the Waterfall Chart that is computed from left to right.
As there are multiple dimensions on the view, you need to modify the table calculation by selecting Rows Shelf with delta symbol then clicking on the “Edit Table Calculation” option.
You can also dynamically display a label only for the selected Marks by using the parameter selections. To do this, click on the “Label” card from the “Marks” section then you can create a calculated field with formula IIF([Ship Mode] = [Ship Mode Parameter],[Sales], NULL) for displaying the Sales contribution of the selected block. Now the label will be shown only on the highlighted block.

2. Making Custom Visualization for Tableau Waterfall Chart Totals
Now let’s add the total bar at the end of the Tableau Waterfall Chart so you can easily view the running total at the end of the chart following the ups and downs across the dimension members.
For this, navigate to the Analytics pane. Here, you will see the “Totals” feature. Drag the “Totals” feature onto the view and then drop it onto the “Row Grands Totals“. But this simple way to create Tableau Waterfall Charts have 2 drawbacks, listed below:
- The highlighted selection we applied on the chart in the previous section always moves on the top. It prevents the highlighted block from lining up from left to right.
- The built-in total added to the Tableau Waterfall Chart is not separate, so you are not left with much flexibility in encoding the Marks.
To fix this, you can also create a stacked bar chart to show the Waterfall chart totals. First, create a new sheet and from the Tableau Waterfall Chart, pick up the measure used for Waterfall Chart and place them onto the Rows Shelf.
Similarly, place the dimension measure onto the “Details” card from the Marks section and place the Highlighter field onto the “Color” card from Marks. Also, you don’t require the repetitive y-axis, so remove it. To do this, just right-click on the axis and deselect the “Show Header” option.
Now, drag the dimension on the “Detail” card in the Marks section above the dimension on the “Color” card. Next, in the “Detail” card, right-click on the dimension and click on the “Sort” option to sort the dimension to ascending order by a measure that you are using. This will ensure that the stacked bars in total are lined up with their respective blocks in the Tableau Waterfall Chart.
Next, in the dynamic lables use the folrmula IIF(ATTR([Ship Mode]) = [Ship Mode Parameter],SUM([Sales]) / TOTAL(SUM([Sales])),NULL) to display the percentage of the selected Sales instaed of their Dollar value.

The main Tableau Waterfall Chart is showing the original Sales value, whereas the Totals visualization is showing the percent of Sales.
Also, provide a column header to the total block. Select the Columns Shelf and type “Totals” or text of your choice, then hit Enter key.
Now, all you need to do is line up both the dashboards together with the same height.
3. Creating Custom Range Highlighters Using the Reference Bands
The last thing to add for making an attractive Tableau Waterfall Chart is creating a selection across both the dashboards.
Create a new calculated field that will draw the bottom of the highlight using the formula given below.
IF ATTR([Ship Mode]) = [Ship Mode Parameter]
THEN RUNNING_SUM(SUM([Sales])) – SUM([Sales])
END)
In the above formula, the running sum of Sales across the entire Waterfall chart is subtracted with the sum of Sales of the highlighted dimension member. This ensures that the highlight always lines up at the bottom of the block.
Similarly, drawing the top of the highlight can be done using the formula given below.
IF ATTR([Ship Mode]) = [Ship Mode Parameter]
THEN RUNNING_SUM(SUM([Sales]))
END

Now, place both these calculated fields onto the “Detail” card in the Marks section of the main Tableau Waterfall Chart.
Next, right-click on any option from both the dashboards having the delta symbol. Click on the “Edit Table Calculation” and choose the “Specific Dimensions” option.

Here, right-click on the y-axis and select the “Edit Table Calculation” option. The other configurations for the reference band are shown below.
As main Waterfall chart has table calculation whereas the stacked bar chart does not. This makes it difficult to add the same reference band to the Totals dashboard. One way to achieve it is to duplicate the Waterfall chart, drag the dimensions from the Columns Shelf to the “Detail” card in the Marks section. Then, sort the negative Sales in ascending order. Also, keep all the calculations in place on the new dashboard.

Again add the column header as “Totals” and formula to show percentage. Line up the new Totals dashboard with the main Waterfall Chart and remove the header.

Also, changing the parameter control will change the color of the selected block. Also, again add the dynamic labels and draw highlights across multiple dashboards.
You can also take a look at how you can easily create Stacked Bar Charts in Tableau step-by-step.
Tips & Tricks After Creating Your Waterfall Chart in Tableau
- Customize Colors: Use contrasting colors for positive and negative values to improve clarity and readability.
- Add Totals and Subtotals: Highlight cumulative totals to provide better context for your chart’s data.
- Sort Categories: Arrange dimensions logically (e.g., by size or importance) for a clearer narrative.
- Label Key Values: Add dynamic labels to the most critical data points for better insights.
- Optimize Tooltips: Customize tooltips to include relevant details, helping viewers understand the chart effortlessly.
Conclusion
In this blog, you learnt about Tableau, the steps to make a basic Tableau Waterfall Chart, and 3 ways to create wonderful Tableau Waterfall Charts. Waterfall Charts help users keep track of positive and negative values over time and how they made a total value. The most common use case of the Tableau Waterfall Chart is for analyzing Sales data.
Companies need to analyze their business data stored in multiple data sources. The data needs to be loaded to the Data Warehouse to get a holistic view of the data. Hevo Data is a No-code Data Pipeline solution that helps to transfer data from 150+ data sources such as Tableau to desired Data Warehouse. It fully automates the process of transforming and transferring data to a destination without writing a single line of code.
Sign up for a 14-day free trial and simplify your data integration process. Check out the pricing details to understand which plan fulfills all your business needs.
FAQ on Creating a Tableau Waterfall Chart
1. Can Tableau do a waterfall chart?
Yes, Tableau can create waterfall charts
2. What are waterfall charts used for?
Waterfall charts are used to illustrate how an initial value is affected by a series of positive or negative changes (additions or subtractions)
3. What is an alternative to the waterfall chart?
Marimekko Chart and Funnel Chart
4. What is the advantage of waterfall chart in Tableau?
Clarity, Interactivity and Integration
5. How to create a simple waterfall chart?
1. In Tableau, connect to your data source and create a new worksheet.
2. Drag the dimension or measure representing your categories (e.g., stages, months) to the Columns shelf.
3. Drag the measure representing your values (e.g., amounts, changes) to the Rows shelf.
4. Change the mark type to Gantt Bar.
5. Add another instance of your measure to the Size shelf to control the width of the bars.
6. Adjust formatting, labels, and colors to emphasize positive and negative changes.
Share it with your connections.
-
 Share To LinkedIn
-
 Share To Facebook
-
 Share To X
-
 Copy Link


