When managing data across platforms, efficiently connecting Airtable to Snowflake is crucial for seamless data analysis and reporting. Whether you need a quick one-time solution or a long-term automated integration, we’ve got you covered:
- Export CSV files for a fast, simple connection.
- Automate and manage data transfers with no-code tools for ongoing syncs.
In this guide, you’ll learn step-by-step how to connect Airtable to Snowflake and streamline your data workflows. Although Hevo Data doesn’t support Airtable as a source yet, this feature will be available soon.
Table of Contents
Overview of Airtable
- Airtable is a Web Application that allows you to create various types of spreadsheets without writing any code. You can seamlessly organize your data into Tables by simply dragging and dropping rows and columns.
- Moreover, Airtable offers multiple features like File Storage, Document Management, Task Lists, Calendar Views, and much more that allow you to generate engaging spreadsheets.
- Airtable is also the leading mobile app builder with an integrated CRM solution. It makes it easy to build beautiful mobile apps and also provides powerful features such as form validation, user management, data persistence, and real-time collaboration.
Hevo is a No-Code Data Pipeline. It can efficiently load data in Snowflake in a few simple steps. It is a fully automated platform and it completely automates the process of data migration.
Let’s see some unbeatable features of Hevo Data:
- Fully Managed: Hevo Data is a fully managed service and is straightforward to set up.
- Schema Management: Hevo Data automatically maps the source schema to perform analysis without worrying about the changing schema.
- Real-Time: Hevo Data works on the batch as well as real-time data transfer so that your data is analysis-ready always.
- Live Support: With 24/5 support, Hevo provides customer-centric solutions to the business use case.
Overview of Snowflake

- Snowflake is a cloud data warehouse built on top of AWS (Amazon Web Services) to help companies store and analyze massive amounts of data. It is a Software-as-a-Service (SaaS) platform, which means you don’t need hardware to select, install, configure, or manage it.
- Snowflake handles all software updates, maintenance, management, upgrades, and tuning. It separates computation and storage and charges for the service independently.
- Snowflake is highly scalable, allowing users to easily scale up and down computation and storage to satisfy their business needs.
- It delivers faster query performance and can handle terabytes of data with its help, which involves virtual compute instances.
Replicate Data from Airtable to Snowflake Using CSV
To start replicating data from Airtable to Snowflake, firstly, you need to export data as CSV files from Airtable. Then, import the CSV files into Snowflake and modify your data according to your needs.
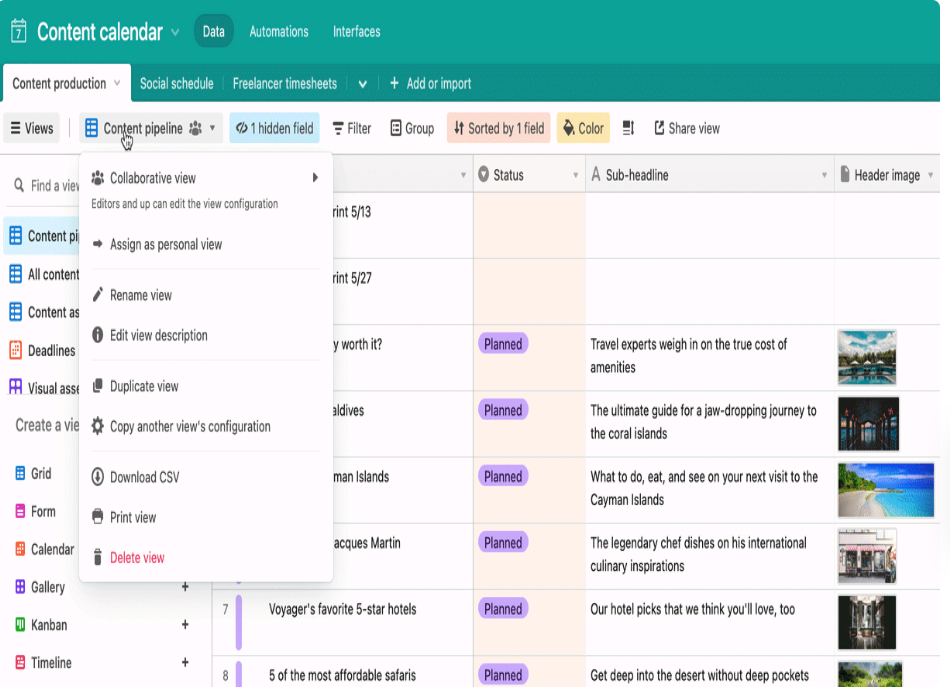
- Step 1: In the Airtable dashboard, you need to select the three-dot menu against the view that you want to export. You will have the option to click Download CSV. The CSV file of your view will be automatically downloaded in the default location of your local system.
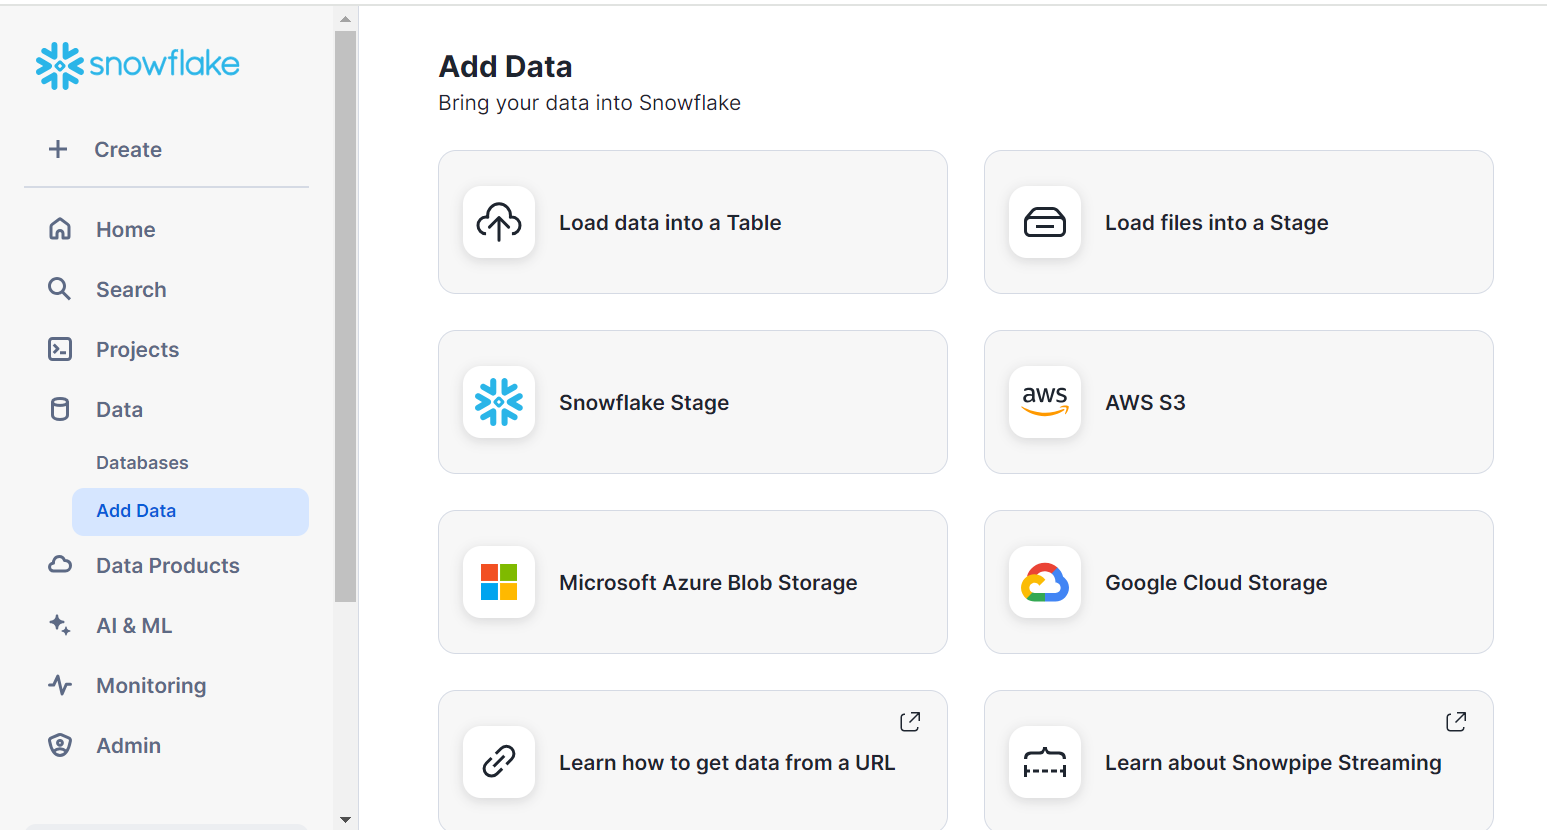
- Step 2: You can upload the CSV file to Snowflake using the data loading wizard present in the Snowflake Web Interface. Using the Snowflake Web UI, you can easily load data into Snowflake by selecting the table you wish to load, followed by clicking the LOAD button. The staging and data loading processes are merged into a single operation by deleting all staged files immediately after loading them into the data warehouse.
You can explore ways of loading data as CSV files.
This 2-step process using CSV files is a great way to replicate data from Airtable to Snowflake effectively.
Advantages of Manually Connecting Airtable to Snowflake
- One-Time Data Replication: When your marketing team needs the Airtable data only once in a long period of time.
- No Data Transformation Required: This method is ideal if there is a negligible need for data transformation and your data is standardized.
- Small Amount of Data: If the amount of data is small, then this method is a good fit as it the accuracy of data replication would be high.
Limitations of Manually Connecting Airtable to Snowflake
- Data Mapping: Only basic data can be moved. Complex configurations cannot take place. There is no distinction between text, numeric values, and null and quoted values.
- Two-way Synchronization: To achieve two-way synchronization, the entire process must be run frequently to access updated data on the destination.
- Time Consuming: If you plan to export your data frequently, the CSV method might not be the best choice since it takes time to recreate the data using CSV files.


Automate the Data Replication process using a No-Code Tool
Load Data into Snowflake using Hevo Data
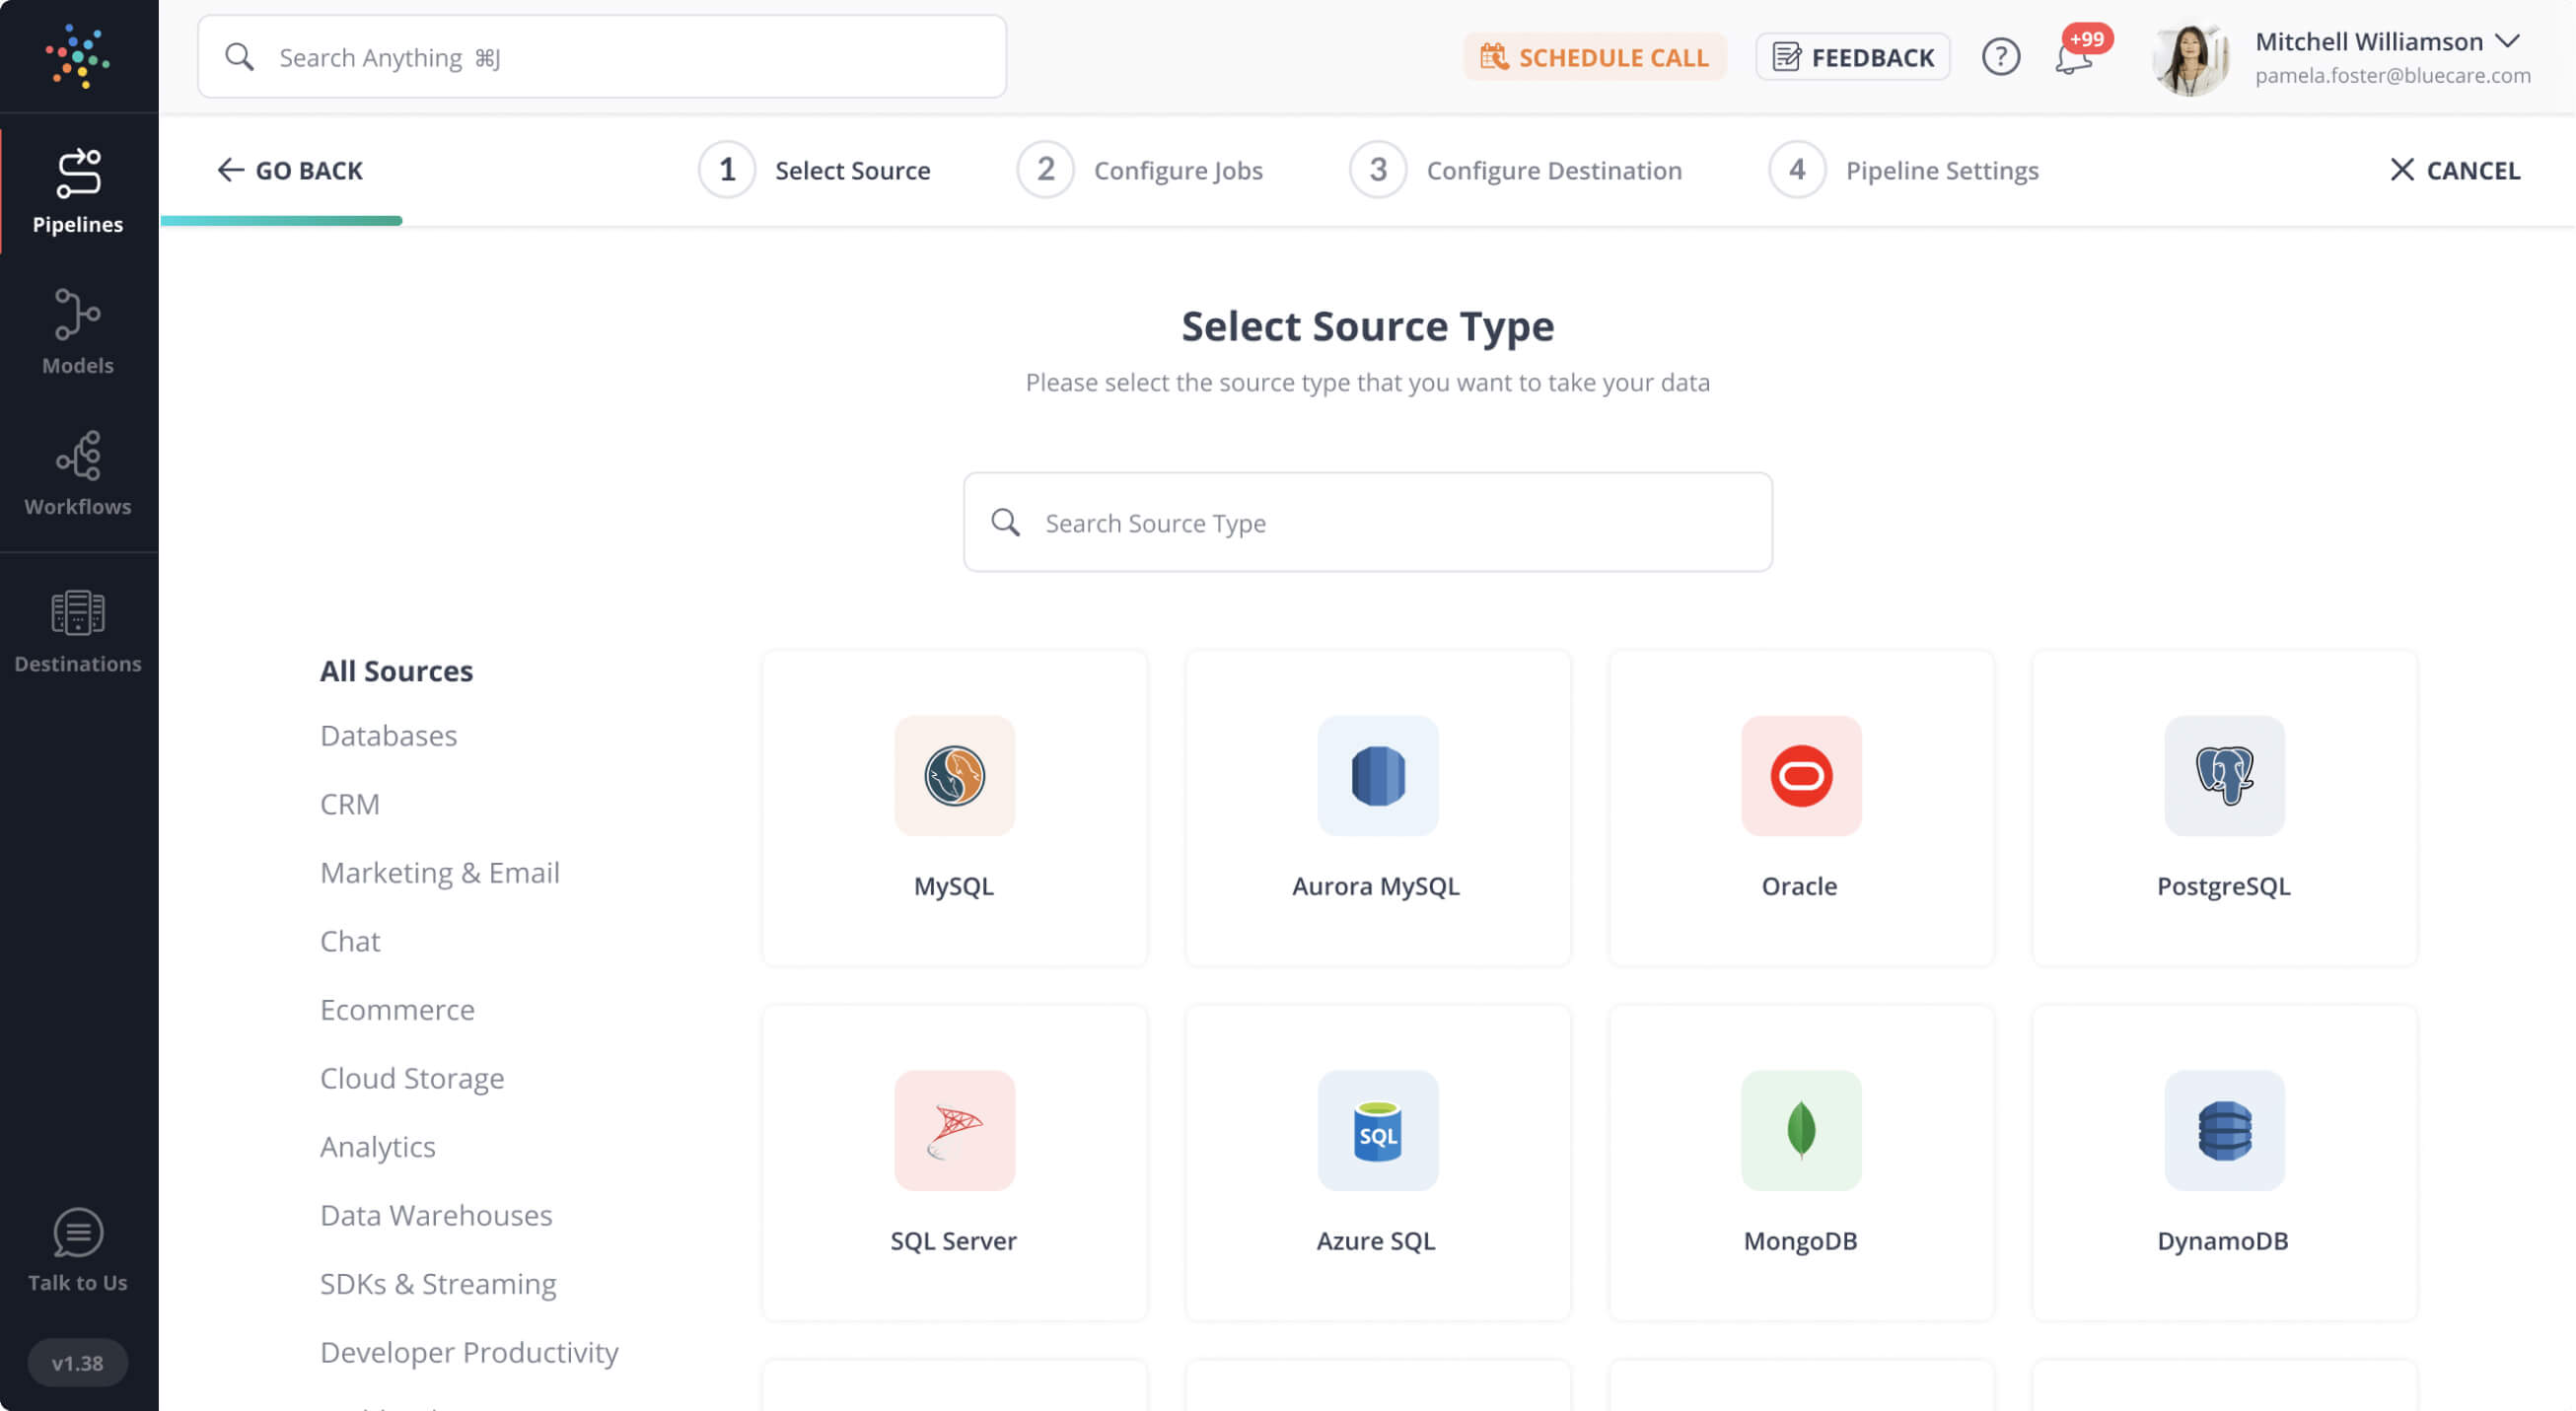
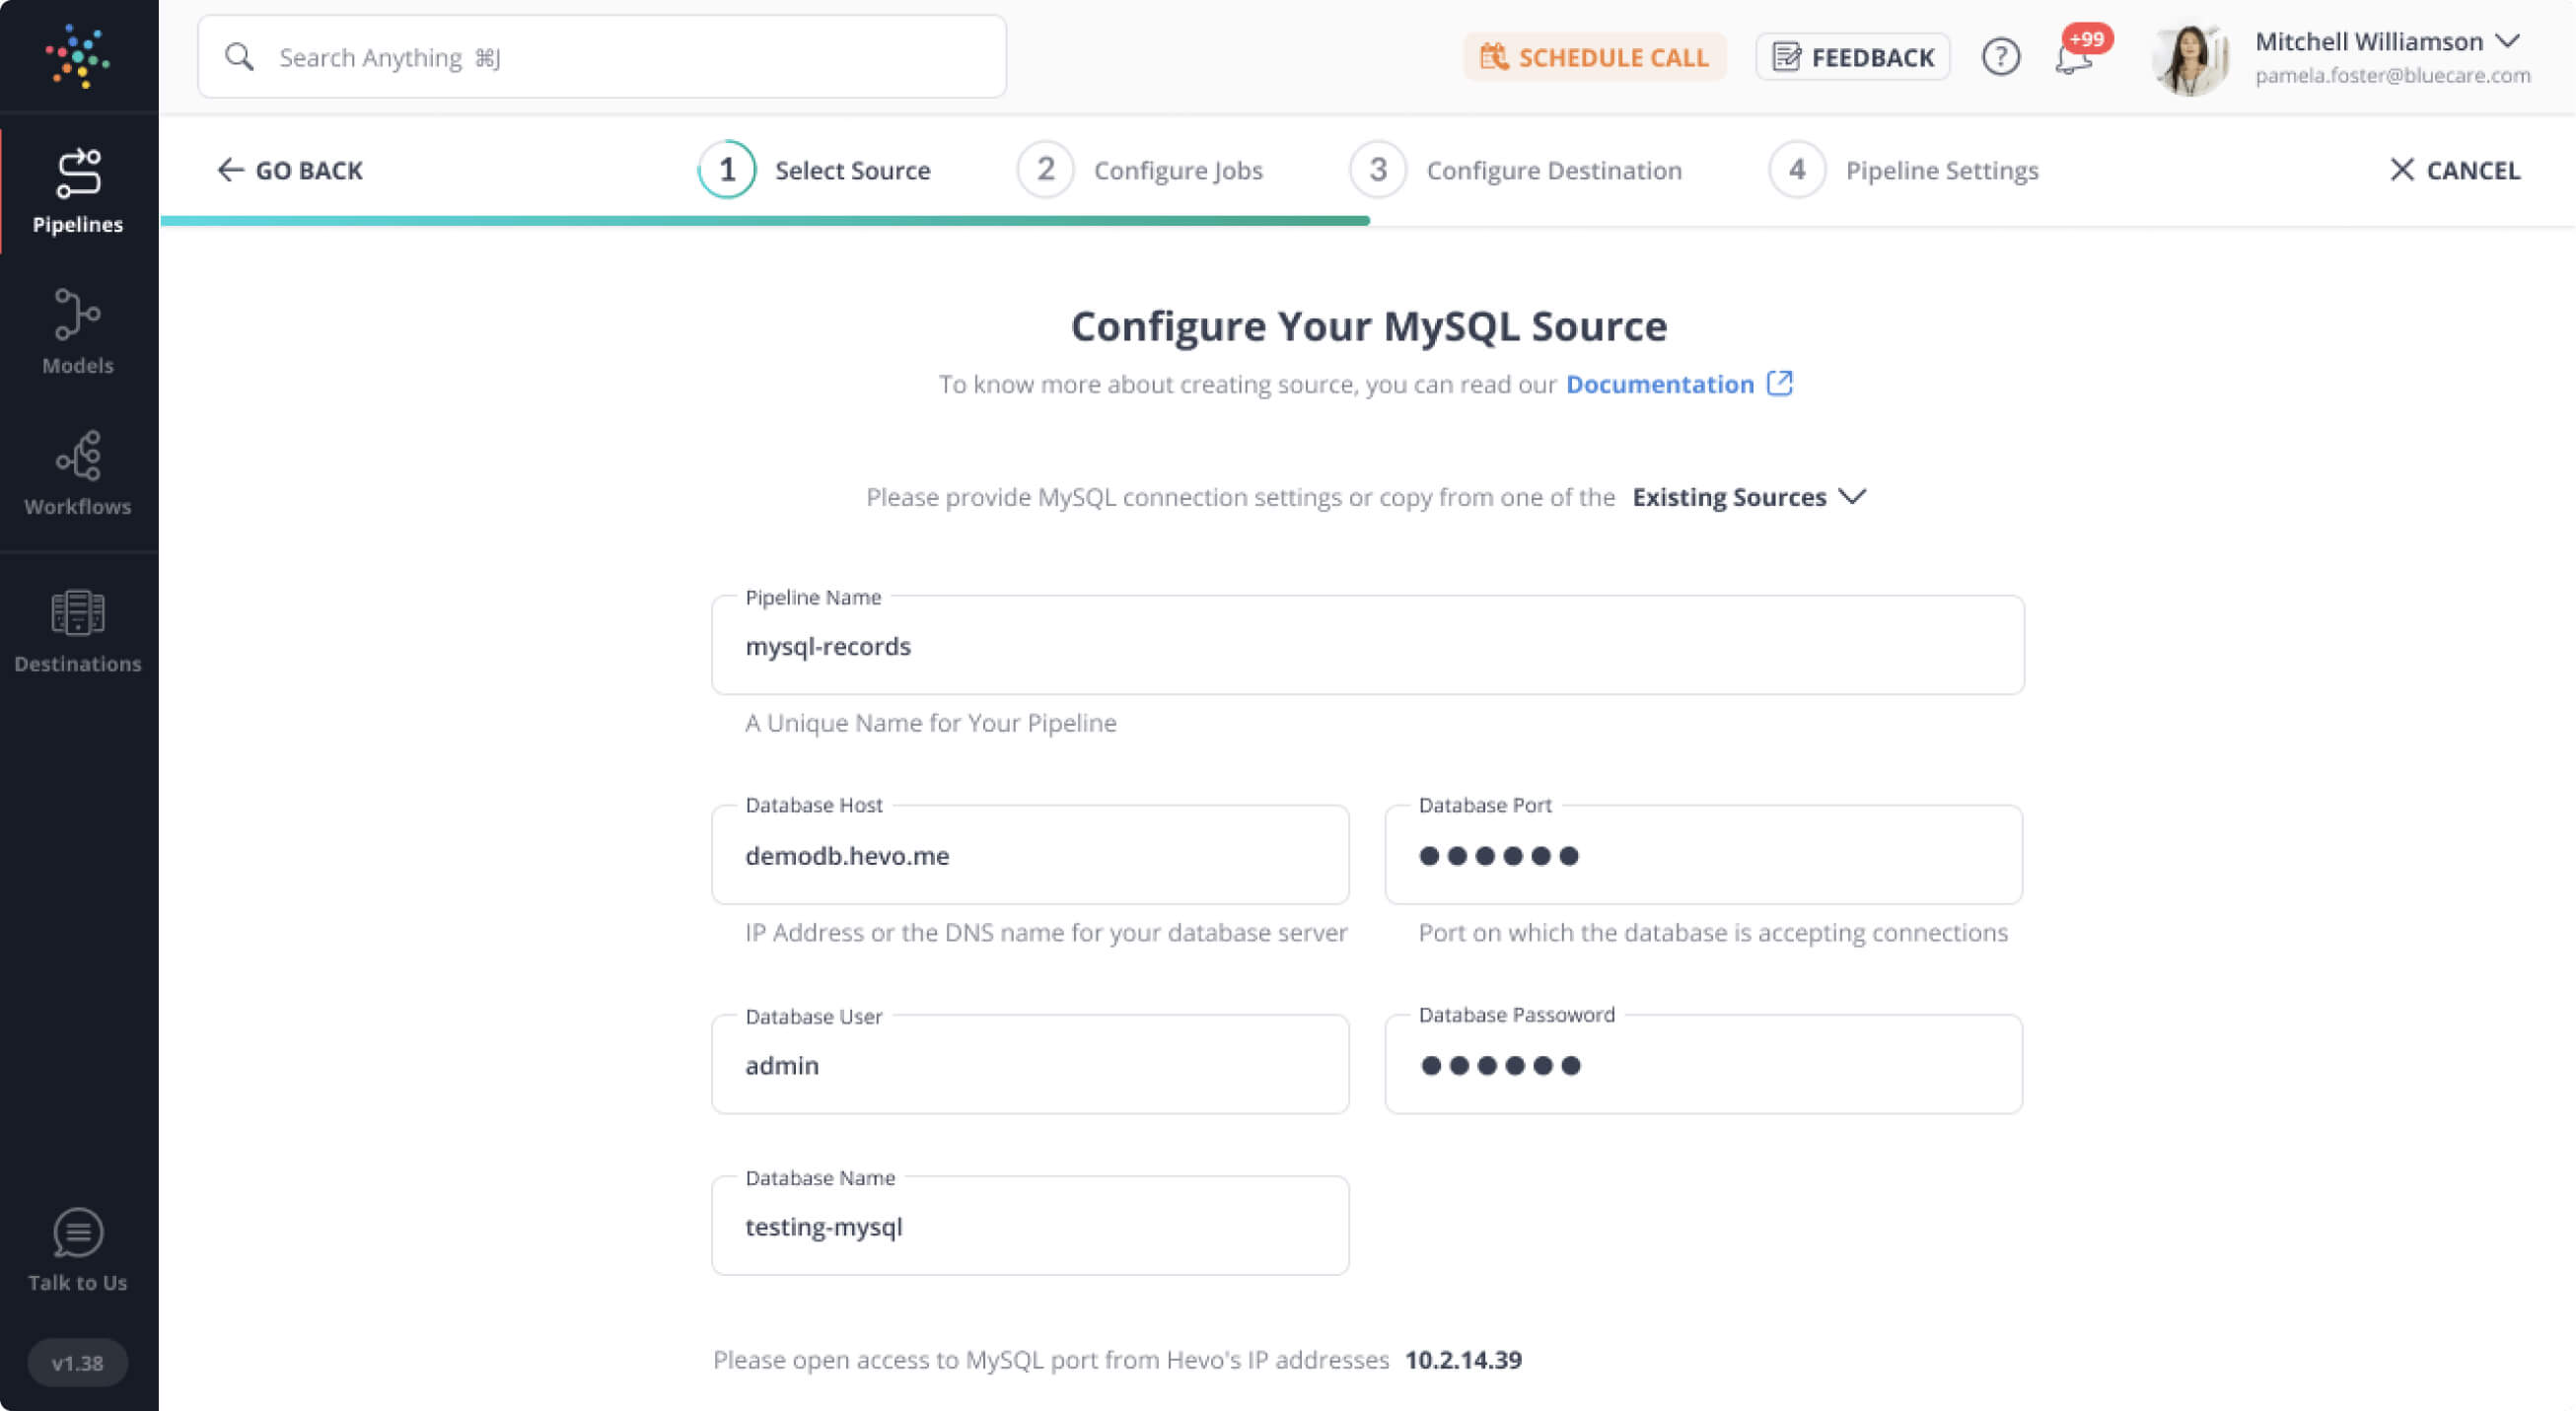
- Hevo Data will support Airtable as a source soon, you will have to provide basic details like credentials, data pipeline name, etc., and configure your Airtable Source.
- You can have a look at the exhaustive list of sources provided by Hevo Data.
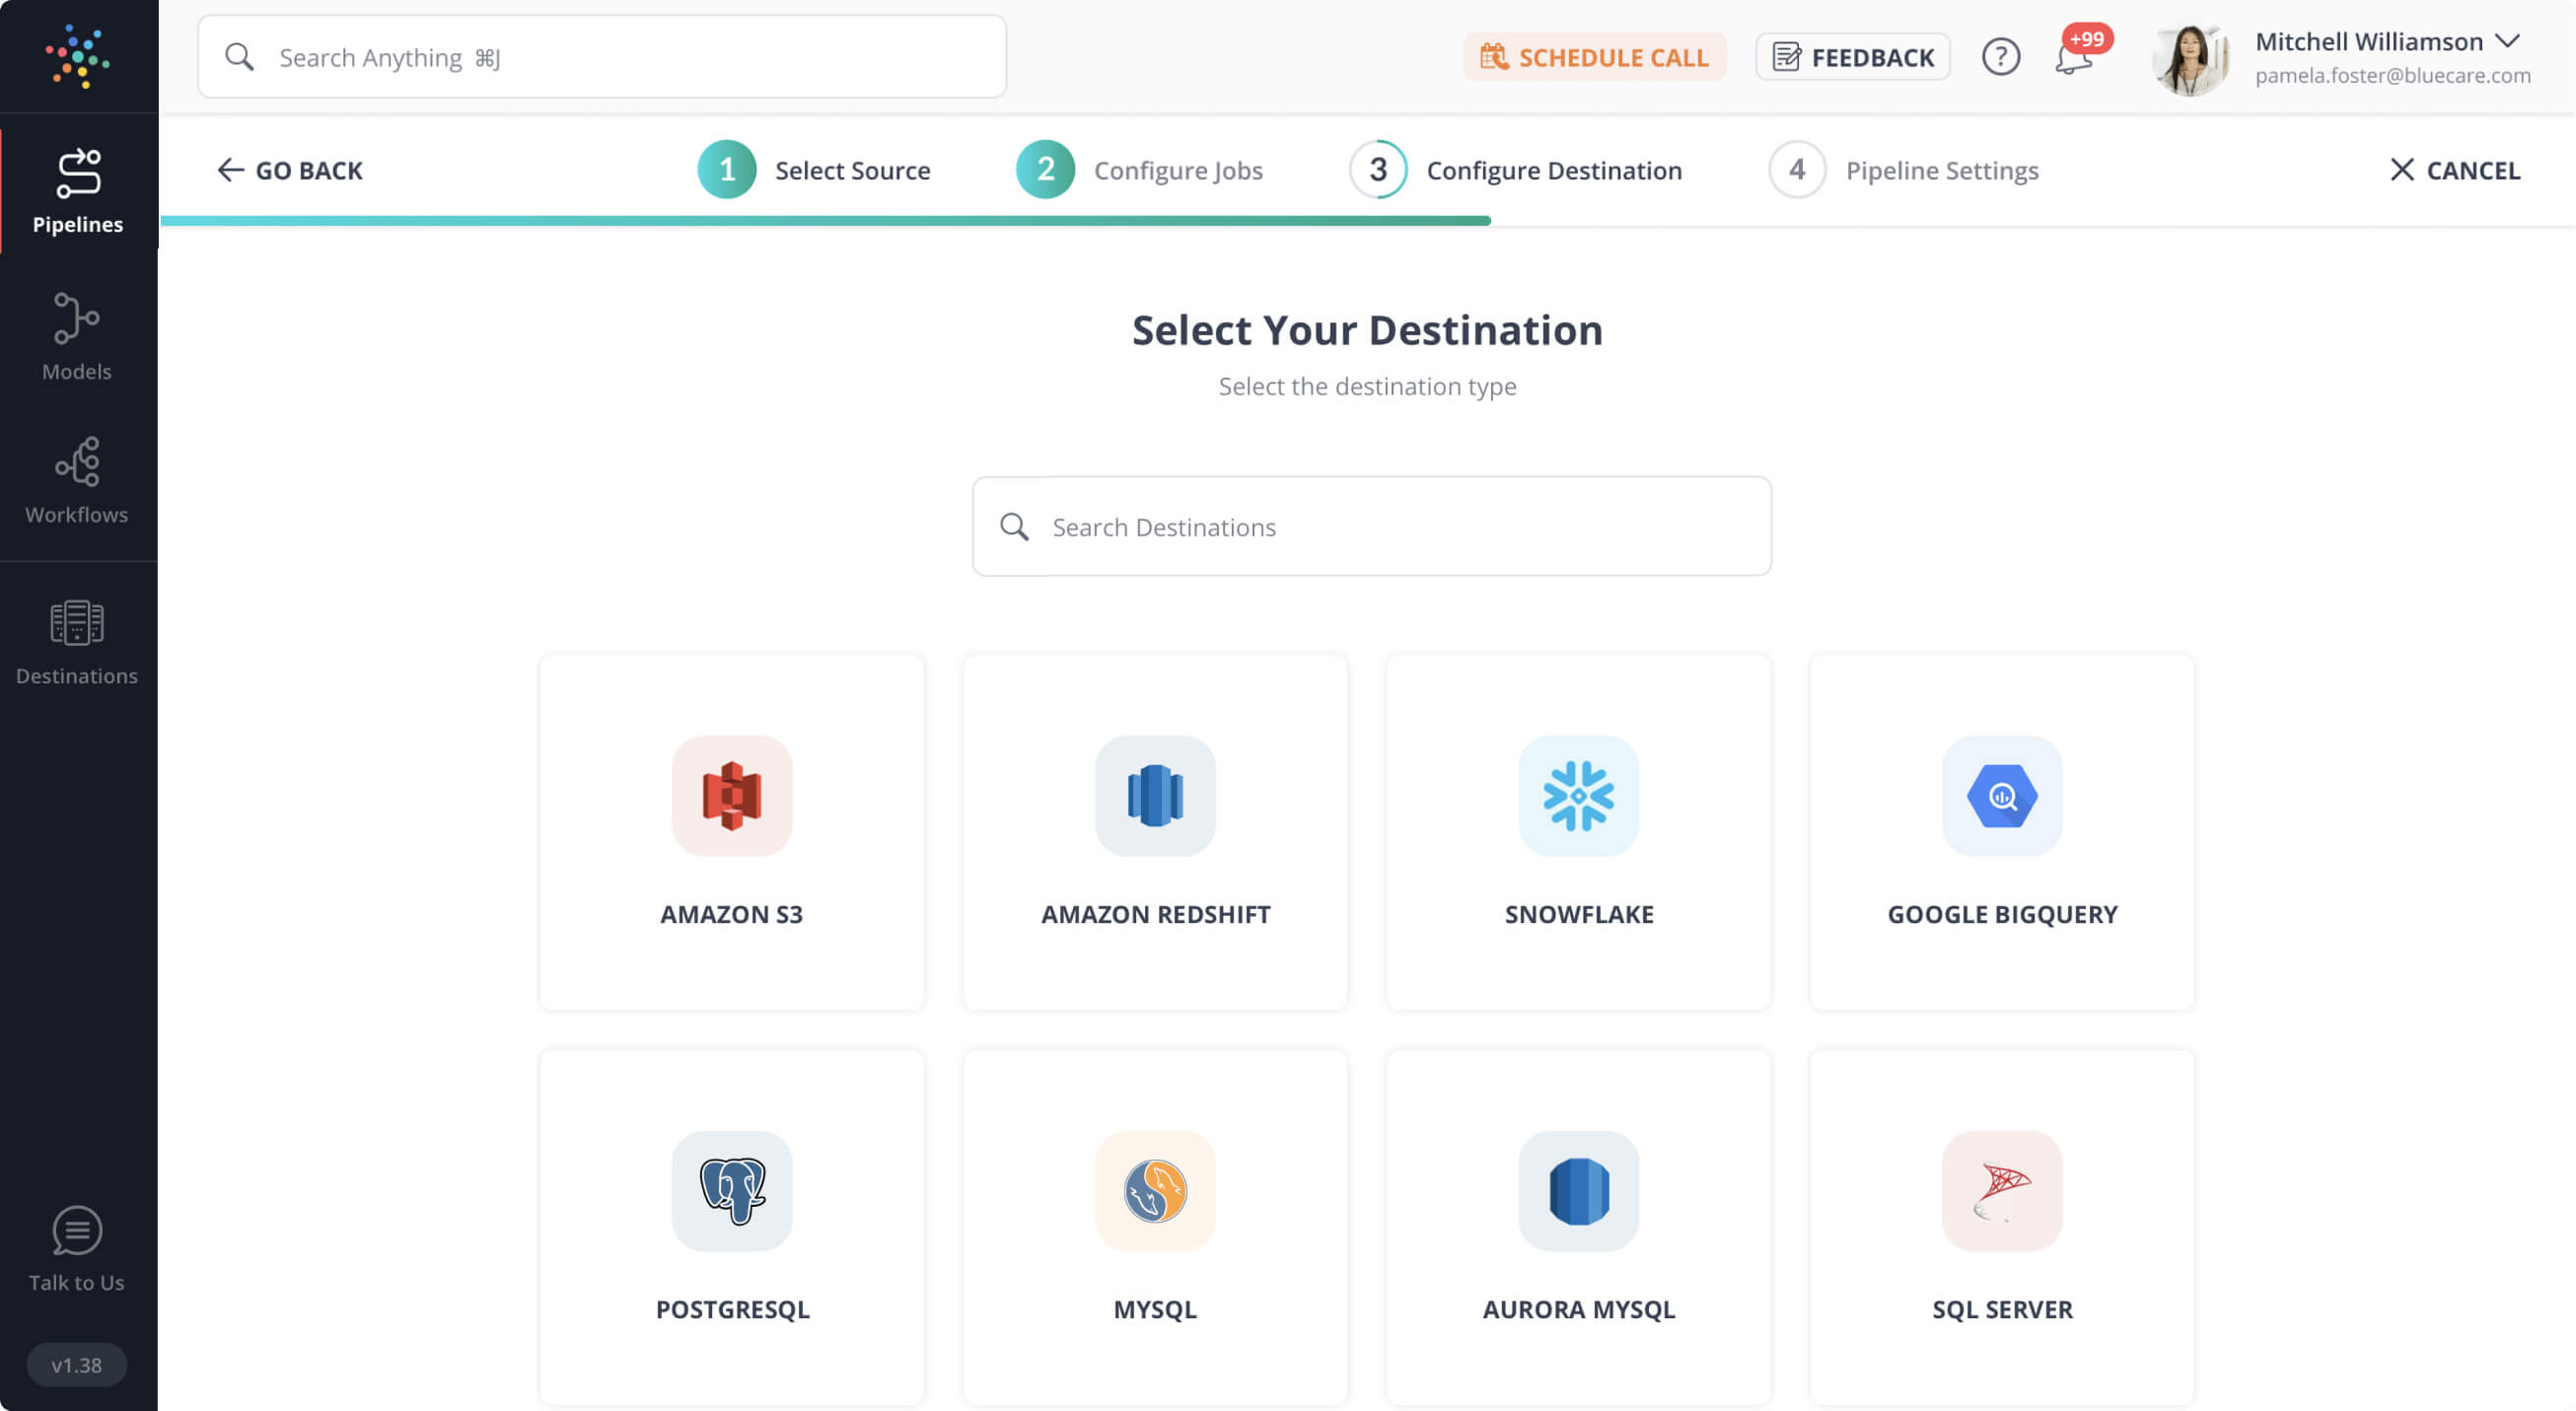
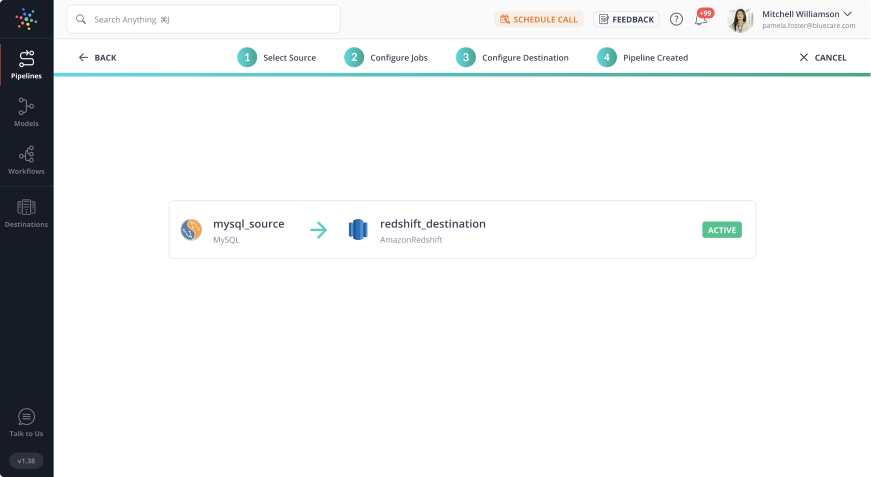
Configure Snowflake as Your Destination
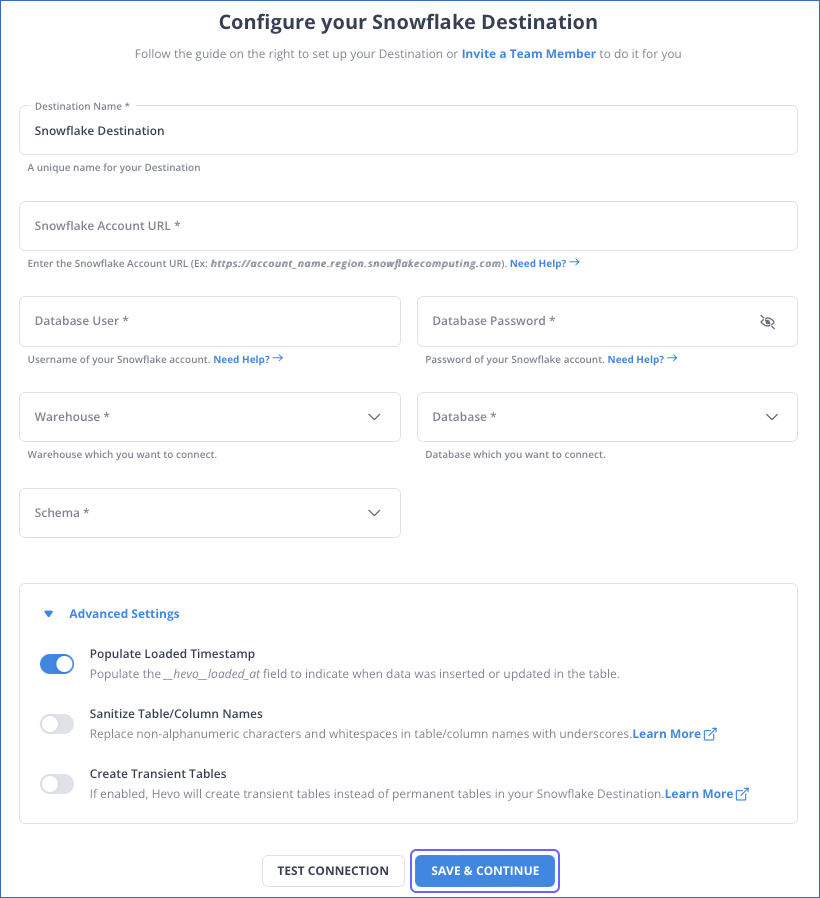
That’s it! You have successfully loaded data into Snowflake using Hevo. Explore in detail how you can configure Snowflake as your Destination
Advantages of Connecting using Hevo
Here’s how Hevo challenges the normal to beget the new ‘exceptional.’
- Fully Managed: Hevo requires no management and maintenance as it is a fully automated platform.
- Data Transformation: Hevo provides a simple interface to perfect, modify, and enrich the data you want to transfer.
- Faster Insight Generation: Hevo offers near real-time data replication, so you have access to real-time insight generation and faster decision making.
- Schema Management: Hevo can automatically detect the schema of the incoming data and map it to the destination schema.
- Scalable Infrastructure: As your sources and the volume of data grows, Hevo scales horizontally, handling millions of records per minute with very little latency.
What Can You Achieve by Migrating Your Data from Airtable to Snowflake?
Here’s a little something for different departments of your team. We’ve mentioned a few core insights you could get by replicating data from Airtable to Snowflake. Does your use case make the list?
- You want a detailed product catalog or efficient track of the purchase process.
- You want to explore and build efficient records for marketing analytics.
- Your sales team wants custom reports for the customer journey.
- Your development team needs to build bug-tracking reports.
Explore more to get a deeper understanding of the use cases.
Summing It Up
- Exporting and importing CSV files is the right path for you when your team needs data from Airtable once in a while.
- However, an ETL tool solution becomes necessary if there are rapid changes in the source and frequent data replication needs to be done to meet the data demands of your product or marketing channel.
- You can free your engineering bandwidth from these repetitive & resource-intensive tasks by selecting Hevo Data’s 150+ plug-and-play integrations.
Sign up for a 14-day free trial and simplify your data integration process. Check out the pricing details to understand which plan fulfills all your business needs.
Frequently Asked Questions
1. Can Airtable connect to Snowflake?
Yes, Airtable can connect to Snowflake, but it requires the use of third-party integration tools or custom scripts for seamless data transfer.
2. How do I import a table into Snowflake?
You can import a table into Snowflake by using the COPY INTO command, the
Snowflake Web Interface, or third-party data connectors.
3. How do I load data into a Snowflake database?
You can load data into a Snowflake database using the Snowflake Web UI,
command-line tools or a no-code solution like Hevo, which simplifies data loading and automates the process.

Share it with your connections.
-
 Share To X
-
 Share To LinkedIn
-
 Share To Facebook
-
 Copy Link