


Jira is an issue tracking tool by Atlassian, Inc. It is a Project Management software that features collaboration facilities. Put differently, Jira is a Bug Tracking and Project Management program that helps teams collaborate and communicate effectively. This powerful multifunctional software has proven to be invaluable to Agile teams, Project Management teams, Software Development teams, and Task Management teams.
Jira software is compatible with a lot of tools. Hence, you can integrate it with other useful software programs to get your work done. Fortunately enough, most of these tools are easy to set up and do not cost anything. Jira has a wide range of functions, but the focus of this tutorial is how to build Burndown Charts with the software.
So, this article will introduce you to the Jira Burndown chart within Agile methodologies, and you will learn how to build a Jira Burndown chart. You will also get to know the features and benefits of using the Jira Burndown Chart.
Table of Contents
What is Jira?
Jira is an Issue Tracking, Bug Tracking, and Agile Project Management software that help teams of all types manage work. It is developed by Australian Company Atlassian specializes in software products for software development teams and is used by over 180,000 customers in 190+ countries. Jira makes it easier for companies and teams to work on a project and collaborate effectively with other team members even outside the organization. Some of the widely used products of Jira by companies include Jira Service Management, Jira Work Management, and Jira Align.
Apart from managing all the Software Management and development activities, Jira can also be used for integrating with many tools like Continuous Integration/Continuous Development pipelines to monitor them and access them seamlessly.
Some of the listed packages of Jira are:
- JIRA Ops: JIRA Ops allow users to automate all the incident responses and develop to save time and avoid repetitive small tasks.
- JIRA Service Desk: JIRA Service Desk is a customer support solution that allows them to report bugs, contact for help, etc,
- JIRA Software: It is a base software used to tacking bugs in the project and used by Agile project teams.
- JIRA Core: Jira Core is a Project Management solution for business teams to manage their work.
Key Features of Jira
A few features of Jira are listed below:
- User-Friendly Interface: Jira allows users to easily set up and learn about its software by delivering all its features in a user-friendly interface. It also comes with step by step tutorial guide that helps users navigate and set up their workspace.
- Workflow Customization: Jira offers a custom-built customizable workspace so that users can fulfill any requirement, whether it’s for Project Management, Issue Tracking, or Task Management. Workflows, reports, Scrum Boards, and other components can be customized as well.
- Interactive Dashboards: Jira offers insightful Reports and Dashboards that allow its users to easily track and monitor the team’s activities and their progress.
To know more about Jira, click here.
What is Jira Burndown Chart?

Burndown charts first originated in Scrum methodology. The idea behind building a Jira Burndown Chart is to fix all problems regarding estimating projects. Jira Burndown Chart displays a downward trend of work remaining (often known as work in progress) over time. It also serves as an early warning system for projects in danger while allowing teams to take necessary actions before it’s too late.
In addition, Jira Burndown Chart offers a practical and effective way of managing projects. They show the status of all your tasks in one easy-to-understand format, helping you track your team’s progress and identify crucial areas that might require more attention.
Advantages of Jira Burndown Chart
The primary advantage of using the Jira Burndown Chart is that it helps Product Development teams to track how much work they have left to complete before their deadline. This means that Burndown Charts can help your team to meet their deadlines while keeping stakeholders apprised of their progress during each sprint and release.
More so, the Jira Burndown Chart is a graphical display that helps teams make their work more visible and track the progress of their schedules. The line slopes downward as it hits blocks, notches, or other marks, denoting Story Points complete with each day passing by.
The chart shows whether your team completes assigned tasks early or late. It also reveals the commitment level of your teams to tasks. A sharp drop in the middle of a project may mean that estimates were inaccurate, the scope was unclear, or the workers aren’t breaking down their assigned jobs properly.
A fully managed No-code Data Pipeline platform like Hevo helps you integrate data from 150+ data sources like Jira (including 60+ Free Data Sources) to a destination of your choice in real-time in an effortless manner. Hevo with its minimal learning curve can be set up in just a few minutes allowing the users to load data without having to compromise with performance. Its strong integration with umpteenth sources allows users to bring in data of different kinds in a smooth fashion without having to code a single line.
Check out some of the cool features of Hevo:
- Connectors: Hevo supports 150+ data sources and integrations to SaaS platforms, files, databases, analytics, and BI tools. It supports various destinations including Google BigQuery, Amazon Redshift, Snowflake Data Warehouses; Amazon S3 Data Lakes; and MySQL, MongoDB, TokuDB, DynamoDB, PostgreSQL databases to name a few.
- Real-Time Data Transfer: Hevo provides real-time data migration, so you can have analysis-ready data always.
- 100% Complete & Accurate Data Transfer: Hevo’s robust infrastructure ensures reliable data transfer with zero data loss.
- Schema Management: Hevo takes away the tedious task of schema management & automatically detects the schema of incoming data and maps it to the destination schema.
Steps to Create a Jira Burndown Chart
As you’re set to create a Jira Burndown Chart, rest assured that the process is simple – it doesn’t require rocket science. You can follow the below steps to create a Jira Burndown Chart:
- Step 1: Define your Team’s Estimation
- Step 2: Estimate your Issues
- Step 3: Track Your Team’s Progress
Step 1: Define your Team’s Estimation
Story points are preferable for setting your Estimation point towards the conventional time frame whether in weeks, months, or years, Here is how to set your team’s estimation statistic:
- Scroll to find your way to the board or backlog, then click on the “more”… > Board settings.
- Next, click the “Estimation Tab” to set according to your preference, as explained above.
Step 2: Estimate your Issues
This can be a little technical, but the point of this exercise is to get an idea as accurately as possible of how much time you’ll need to complete all of these tasks. Follow the steps below to estimate your Issues easily:
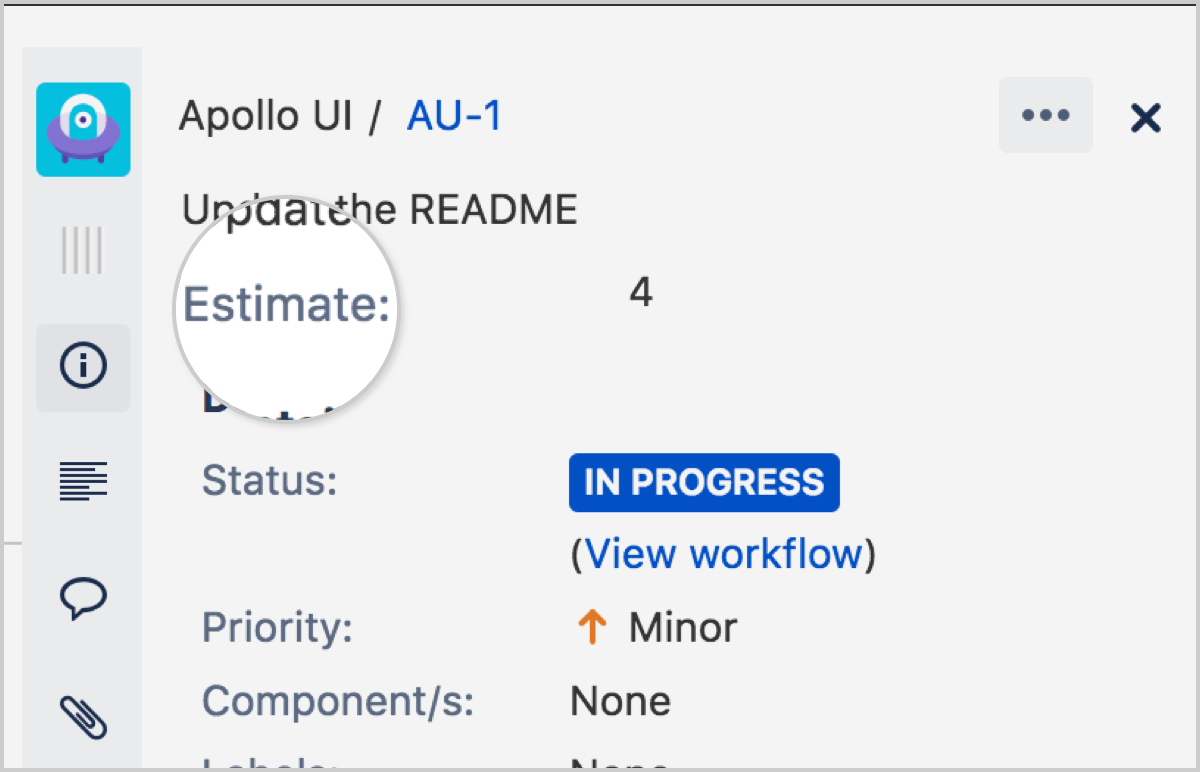
- Go to your Scrum Project from the backlog or the board, and choose an Issue.
- Once there, enter an estimate for said issue by clicking on its Estimate field.
- Clicking through it will take you into its detail section where you can estimate how much time and effort would be needed.
Step 3: Track your Team’s Progress
Now that you have created a Jira Burndown Chart, the next step is to track your team’s progress with the chart. You can choose to use a Sprint Burndown Chart or an Epic Burndown Chart.
Sprint Burndown Charts
A Sprint Burndown Chart is used to track the total work remaining in a Sprint Project, and it also measures the likelihood of achieving a defined task goal. It shows the completed work per day against the projected rate of completion for each sprint. By tracking this information throughout a given sprint, teams can manage their progress more effectively.
To see the Sprint Burndown Chart, do the following:
- Go to your Scrum Project and select from either Backlog or Active Sprint.
- Then click on “Reports” followed by “Burndown Chart“.
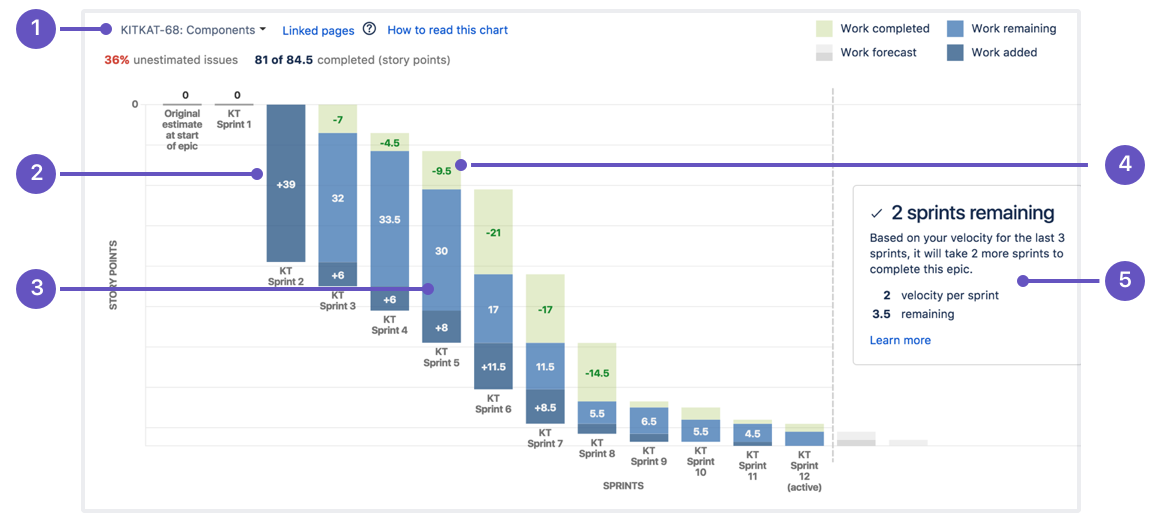
Epic Burndown Charts
An Epic Burndown Chart enables Scrum Teams to show their progress during the Sprint. This is a chart that shows you how the team is doing on an Epic. Teams can see how much of an Epic is left, and the impact of changes during a Sprint.
To see an Epic Burndown Chart:
- Go to your Scrum Project.
- Click on the Backlog or Active Sprint.
- Then click on Reports and select Epic Burndown.
- You will notice a drop-down pick an epic next to the Epic Burndown header, which you can choose from depending on what is configured.
Reading Burndown Charts
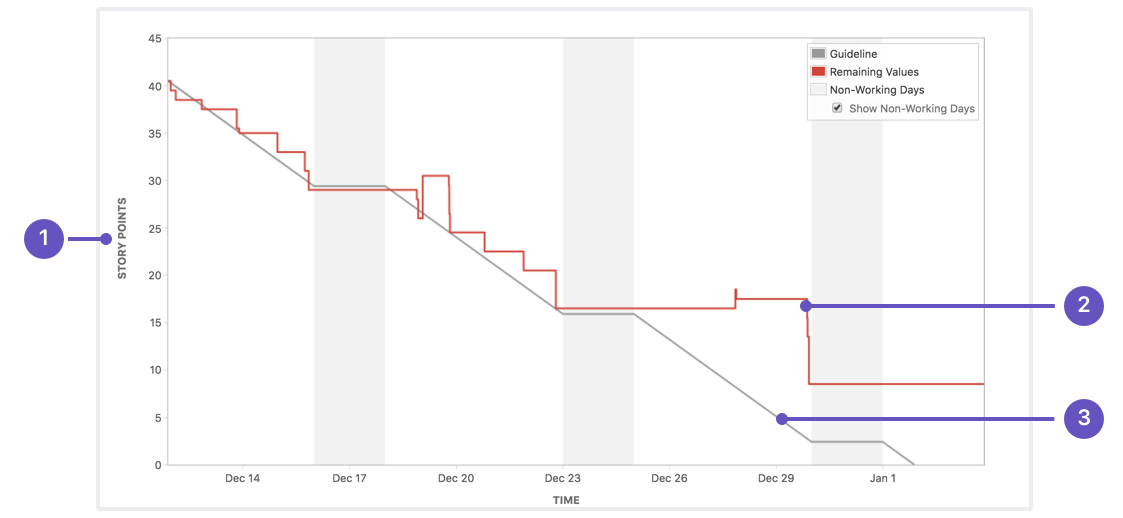
Burndown charts are simple in graphics, and it is as well easy to read and understand. To read, you must know that:
- The x-axis is for days in the sprint.
- The y-axis is for how much effort you are making.
- The ideal line shows how much progress you should be making each day.
- And the real line shows how much progress you are actually making each day.
Types of Sprint Burndown Charts
The thing that makes a chart an effective tool for reporting is that it shows the team’s progress towards the Sprint Goal and not in terms of time spent but on how much work is remaining.
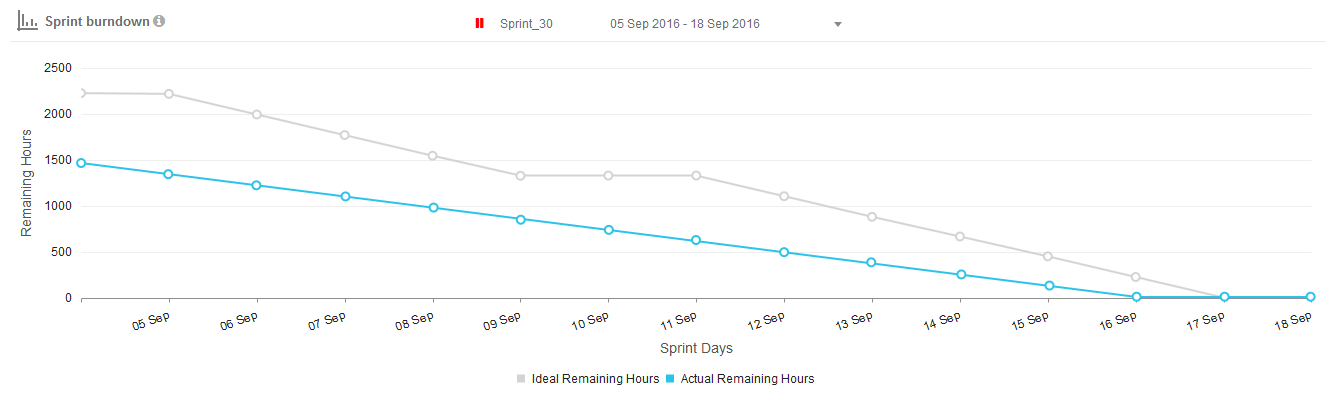
Sprint Burndown Chart 1: Sprint Goal Met
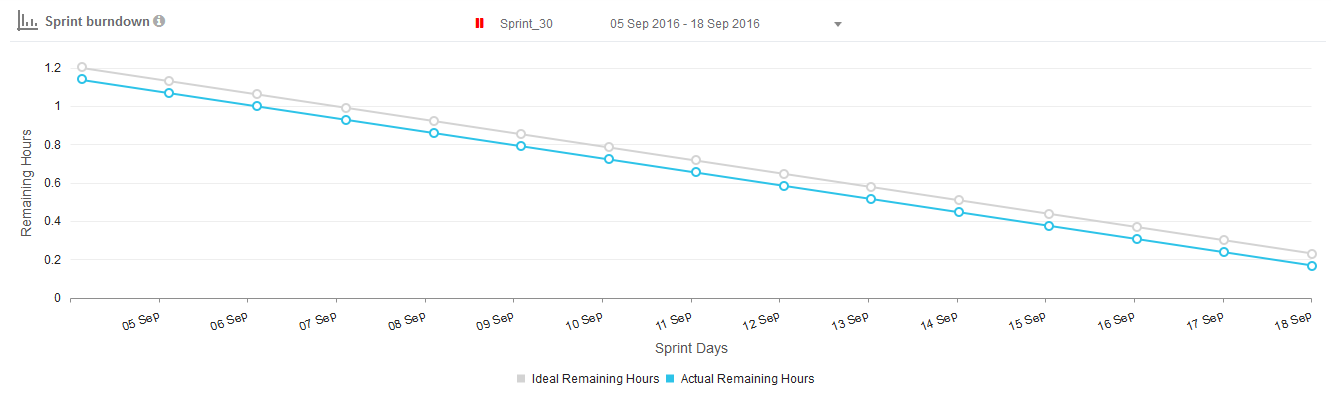
A sample from a “Sprint Commitment Met” Burn Down Chart is shown above. Progress has been steady during this period, with no spikes in activity or dips in output that might indicate the project’s problems.
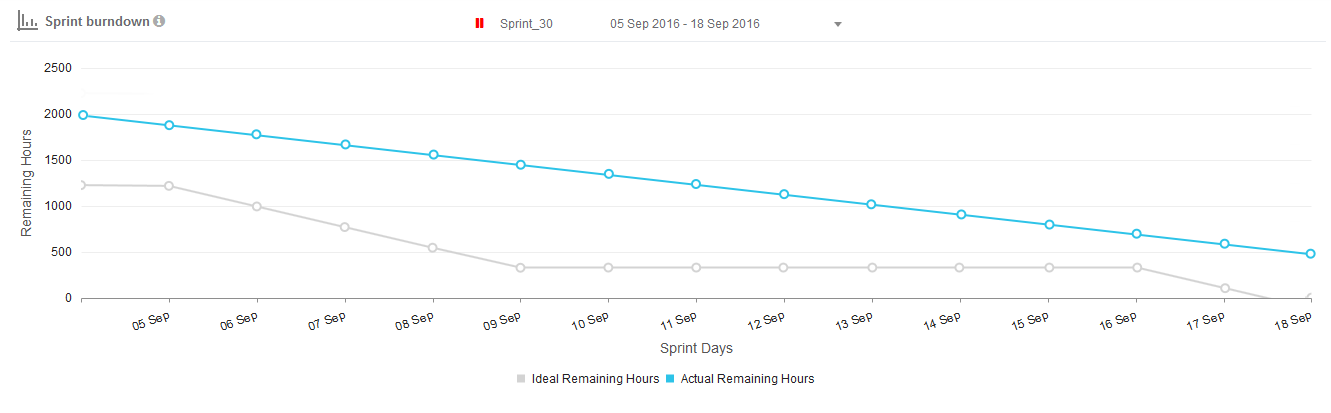
Sprint Burndown Chart 2: Sprint Goal Not Met
In Chart 2, the teams are still committed to completing the Sprint as planned, but they cannot maintain their original velocity. So, that means any work leftover at this point will be carried forward into future Sprints and may end up being prioritized even higher than before!
Sprint Burndown Chart 3: Sprint Goal Met Before Time
Here, the team is working more efficiently and may be able to finish sooner than expected. The team may have overestimated the difficulty of these stories, which explains why they could complete tasks so quickly.


Conclusion
When you are trying to meet deadlines, it can be hard to stay motivated. A Jira Burndown Chart is an effective tool for keeping track of Project completion and providing motivation through the process.
In this article, you learned about the key concepts of the Jira Burndown Chart and the steps required to create a Jira Burndown Chart from scratch.
Integrating and analyzing your data from a huge set of diverse sources can be challenging, this is where Hevo comes into the picture.
Hevo is a No-code Data Pipeline and has awesome 150+ pre-built integrations that you can choose from. Hevo can help you integrate your data from numerous sources such as Jira and load them into a destination to analyze real-time data with a BI tool and create your Dashboards. It will make your life easier and make data migration hassle-free. It is user-friendly, reliable, and secure.
FAQ on JIRA Burndown Chart
What is the burndown chart in Jira?
A burndown chart in Jira visualizes the amount of work left in a sprint or project over time, showing the team’s progress toward completing the work. It helps track whether the project is on pace to finish on schedule.
What is the difference between burn-up and burndown chart in Jira?
A burn-up chart shows work completed over time, emphasizing scope changes, while a burndown chart tracks remaining work. Burn-up charts are helpful for tracking progress with scope adjustments; burndowns focus on tasks left to complete.
How to create a release burndown chart in Jira?
To create a release burndown chart in Jira, go to the Reports section in a project, select “Release Burndown,” and choose the version or release you want to track. Jira automatically updates the chart based on sprint data.

Share it with your connections.
-
 Share To X
-
 Share To LinkedIn
-
 Share To Facebook
-
 Copy Link


