


Data Pivoting is an essential part of data processing and Business Intelligence as it enables you to rearrange your data by summarizing it, helping you to sort out required data in little or no time, group the data, find total or average from the data easily, etc. so you can get a different perspective from your data. This is done using Pivot tables as you can transform your data from rows into columns or columns into rows, as well as group them by fields, and use them for advanced calculations.
This article aims at introducing you to Pivot in Tableau and showing you how to build Pivot in Tableau through four different methods.
Table of Contents
Understanding Tableau

- Tableau is a Business Intelligence software that allows organizations from all around the world to derive insights from their data and build interactive visualizations.
- Tableau is famous for its intuitive visualizations and its capability to enable users without a technical background to exploit advanced analytical features.
- Tableau is available as a fully managed Cloud-based service called Tableau Online and as an on-premise server-based deployment called Tableau Server.
- Tableau also houses a large number of supporting applications to help users make the best use of Tableau Server and Tableau Online.
- Tableau Prep builder assists you in connecting to multiple data sources and preparing the data for analysis through calculated fields and cleansing.
- Tableau Prep conductor will also assist you in scheduling jobs for Dashboards and Reports, monitoring them, and providing debugging information.
- Read about other data analytics tools and see which suits your use case.
Understanding Pivots
A Pivot table, by definition, can be described as a statistical table that summarizes data from a more extensive table such as a database, spreadsheet, or even a business intelligence program to draw useful insights by arranging and rearranging them to a required format. Pivoting data has become an integral part of data analysis, and the Pivoted data ultimately leads you to find figures and facts quickly, thereby leading individuals and organizations to make informed decisions.
Hevo simplifies data analytics by automating the process of extracting, transforming, and loading (ETL) data from multiple sources into cloud-based platforms for analysis. What Hevo Offers?
- Fully Managed: Hevo Data is a fully managed service and is straightforward to set up.
- Schema Management: Hevo Data automatically maps the source schema to perform analysis without worrying about the changing schema.
- Real-Time: Hevo Data works on the batch as well as real-time data transfer so that your data is analysis-ready always.
- Live Support: With 24/5 support, Hevo provides customer-centric solutions to the business use case.
Prerequisites
To build a data pivot in Tableau you need the following:
- Working knowledge of Tableau
- Tableau account
Methods for Building Data Pivot in Tableau
Building Pivot in Tableau is easy and convenient depending on your aim and requirements for creating one. Tableau’s major objective is organizing your data into a nicely fitted arrangement so you can derive insights and come up with efficient analysis of your data to better your business processes.
Pivot is one such feature in Tableau as you can use it to streamline your data into rows or columns that will make for easy deductions and conclusions from them. Tableau has this affinity of making your data ‘tall’ rather than ‘wide’ as opposed to other platforms therefore, the preferred data Pivot in Tableau is gotten from columns to rows.
There are however four ways to building Pivot in Tableau which will be discussed elaborately in upcoming chapters, they include:
Using any of the above methods will lead to a proper evaluation of your data, and you can interact directly with the results and perform any additional cleaning operations on your data for maximum results.
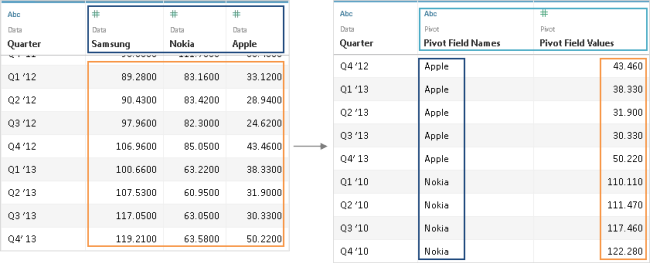
Method 1: Pivot Columns to Rows
This method is best suited when you want to transform your data from wide to tall, you simply Pivot it from columns to rows on one or more groups of fields. As stated in the previous chapter, this is the most preferable Pivot in Tableau as sometimes, analyzing data stored in a crosstab format can be difficult in Tableau; therefore, select the fields that you want to work with and Pivot the data from columns to rows.
To Pivot columns to rows, do the following:
- Connect to your data source.
- Drag the table that is to be Pivoted to the Flow pane.
- Click on the plus icon and select Add Pivot from the context menu.
- Enter a value in the Search field in the Fields pane. This is used to search the field list for fields to Pivot in Tableau and it is an optional step.
- Check the Automatically rename Pivoted fields and values check box to enable Tableau Prep to rename the newly Pivoted fields using common values in the data. This is also an optional step.
- Select one or more fields from the left pane and drag them to the Pivot1 Values column in the Pivoted Fields pane.
- In the Pivoted Fields pane, you can add more columns to Pivot in Tableau by clicking on the plus icon. This is optional as you may not want to add more fields for all your analysis but should you add more, repeat the previous step to select more fields to Pivot.
- If you did not enable the default naming option, or Tableau prep did not automatically detect a name, edit the names of the fields and names of the original fields to best describe the data.
- You can rename the new Pivot step to keep track of changes if you wish as this is optional.
- Run the flow to refresh your Pivot in Tableau data changes.
Note: If you are using Tableau Prep Builder’s latest versions and on the web, in step 3 right-click on the fields you want to Pivot in Tableau that can be found in the Profile pane and select Pivot Columns to Rows from the menu then skip to step 7.

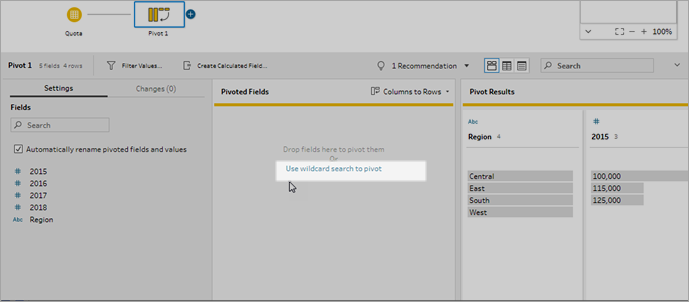
Method 2: Using Wildcard Search to Pivot
When working with large data sets or when your data frequently changes over time, you can use wildcard search to Pivot your data from columns to rows instantly based on a wildcard pattern match though this is currently available for Tableau Prep Builder’s latest versions and on the web.
Tableau Prep does this by detecting schema changes like addition and removal of new fields that match the pattern when the flow is run and the Pivot results are automatically updated.
To achieve this, do the following:
- Connect to your data source.
- Drag the table that you want to Pivot to the Flow pane.
- Click on the plus icon and select Add Pivot from the context menu.
- Click on the link Use wildcard search to Pivot in the Pivoted Fields pane.
- Enter a value or partial value you want to search for. You can use the Search Options button to select how you want to match the value then press Enter to apply the search.
- In the Pivoted Fields pane, click on the plus icon to add more columns to Pivot in Tableau. This is optional as you may not want to add more columns but if you do, repeat the previous step to select more fields to Pivot in Tableau.
- Edit the names of the fields if you did not enable the default naming option or if Tableau Prep could not automatically detect a name.
- Run the flow to refresh your Pivot data changes. Any new field added to your data source that matches the wildcard pattern will be detected and automatically added to the Pivot in Tableau.
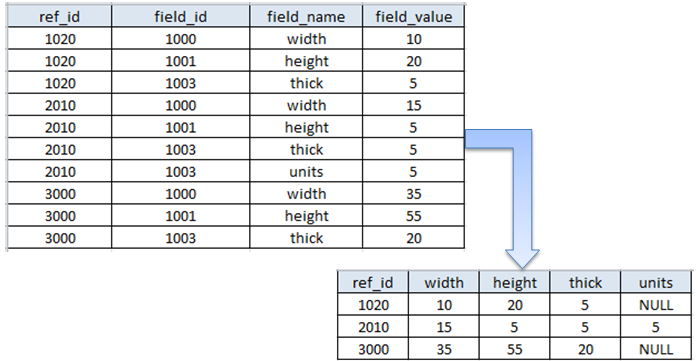
Method 3: Pivot Rows to Columns
You can also create a Pivot in Tableau from rows to columns as this is done on Tableau Prep Builder’s latest versions and the web especially if you want to create new columns to enable a different visualization of your data.
To do this, carry out the steps listed below:
- Connect to your data source.
- Drag the table that is to be Pivoted to the Flow pane
- Click on the plus icon and select Add Pivot from the context menu.
- Select Rows to Columns from the drop-down menu in the Pivoted Fields pane.
- Enter a value in the Search field using the Fields pane to search the field list for fields to Pivot in Tableau. This is an optional step.
- From the left pane, select a field and drag it to the Field that will Pivot rows to columns section in the Pivoted Fields pane. The values in this field will be used to create names and new columns.
- From the left pane, select a field and drag it to the Field to aggregate for new columns section in the Pivoted Fields pane. You can change the aggregate type from the default assigned value by clicking on aggregation type.
- Review the result in the Pivot Results pane and apply any cleaning operations to the newly created columns.
- Right-click on the Pivot step in the flow pane and select Refresh to refresh your data when changes occur in its row data.
Method 4: Using Custom SQL
You can also create Pivots in Tableau using the custom SQL feature provided by Tableau. In a custom SQL query, the UNION ALL operator takes values from distinct columns and puts them into a new column.
To create Pivot in Tableau for your data using this custom SQL, do the following:
- Connect to your data source.
- In the left pane, Double-click the New Custom SQL option.
- Copy and paste the following custom SQL query and replace the contents with information about your table in the Edit Custom SQL dialog box:
Select [Static Column]

, 'New Value (from Column Header 1)' as [New Column Header]

, [Pivot Column Values 1] as [New Values]

From [Table]

Union ALL

Select [Static Column]

, 'New Value (from Column Header 2' as [New Column Header]

, [Pivot Column Values 2] as [New Values]

From [Table]

Union ALL

Select [Static Column]

, 'New Value (from Column Header 3' as [New Column Header]

, [Pivot Column Values 3] as [New Values]

From [Table]
- Static Column: This is a comma-delimited list of the columns from the table that should not be included in the Pivot in Tableau.
- New Value: These are the new names 1 – 3 that you will give to the original column headers which will be used as row values in the Pivot.
- Pivot Column Values: This refers to the columns whose values will be Pivoted into a single column from 1 – 3.
- New Column Header: The name given to the new column that contains the new row values from New Value 1 – 3.
- New Values: The name given to the new column that contains the original values from Pivot in Tableau Column Values 1 – 3.
- Table: The table you connected to.
- Click OK
Conclusion
This article has shed light on how to build Pivot in Tableau for your data using four basic procedures: Pivot Columns to Rows, Wildcard Search to Pivot, Pivot Rows to Columns, and Custom SQL. It provided steps on how you can achieve this and accompanying explanations for each step.However, Pivots in Tableau can be built easily for analysis and interpretation using Hevo Data as a third-party platform to Tableau. Hevo is a No-code Data Pipeline and has awesome 150+ pre-built integrations that you can choose from. It will make your life easier and data migration hassle-free. It is user-friendly, reliable, and secure.
Check out the pricing details and try Hevo by signing up for a 14-day free trial and see the difference!
FAQs
1. What does pivot in Tableau do?
Pivoting in Tableau lets you transform columns into rows, making it easier to analyze data by changing the data layout for different insights.
2. How to find the pivot in Tableau?
To pivot in Tableau, select the columns you want to pivot, right-click, and choose “Pivot” from the menu. This option is available in the data pane.
3. Can you pivot calculated fields in Tableau?
No, you cannot pivot calculated fields directly in Tableau. However, you can create calculated fields after pivoting your data to perform further analysis.

Share it with your connections.
-
 Share To X
-
 Share To LinkedIn
-
 Share To Facebook
-
 Copy Link


