Key Takeaways
Here are the top 5 alternatives. We will be discussing about more tools in the blog:
- Apache Superset: Offers a user-friendly interface with extensive SQL database support for scalable analytics.
- Grafana: Excels in time-series data visualization with alerting features for proactive monitoring.
- Metabase: Provides an intuitive experience with quick summarization and no-code querying for diverse user skill levels.
- Redash: Favors SQL-savvy users with collaborative dashboards and support for 20+ data sources.
- Pentaho Community Edition: Delivers comprehensive BI and data integration tools suitable for enterprises seeking open-source solutions.
Tableau is very popular for creating robust and interactive visualizations based on an analysis of large amounts of data. Tableau visualizations are accessible on all screen sizes and devices. This makes it a powerful and adaptable data visualization tool.
However, it may not suit every business, especially startups, due to its high cost and limited functionality beyond visualization. Because of these drawbacks, exploring both paid and free Tableau alternatives tailored to your business needs can be valuable.
This article provides a curated list of top open-source options to help you make the best choice.
Table of Contents
What is Tableau?

Tableau is one of the most popular Data Visualization and Business Intelligence tools used for reporting and analyzing vast volumes of data. Since its inception in 2003, Tableau has assisted leading industries in reducing analysis time and making their businesses more data-driven while maintaining flexibility, security, and reliability.
It offers intuitive graphics/visualizations that you can leverage to visually present your data. It offers a variety of features ranging from Data Extraction and Processing to the Generation of Reports and Dashboards.
For a better understanding, Data Analytics in the Tableau tool can be divided into the following two categories:
- Developer Tools: These are the Tableau tools used for development, such as the creation of Dashboards, Charts, Report Generation, and Visualisation. Tableau products that fall in this category include Tableau Desktop and Tableau Public.
- Sharing Tools: As the name implies, the purpose of these Tableau products is to share Visualisations, Reports, and Dashboards created using developer tools. Tableau Online, Server, and Reader are examples of some products in this category.
Key Features of Tableau
Some of the key features of Tableau are as follows:
- Multipurpose Dashboard: Tableau software goes beyond the standard features offered by other Data Visualisation tools. By using Tableau, users can deploy interactive models, use a variety of formats, and for analysts who work on multiple projects at the same time, they can effectively transfer all the elements used in one workbook to another with an informative, advanced, but simple-to-use Dashboard.
- Data Extraction: Tableau provides a plethora of data source functionalities for connecting to and importing data from a variety of external sources. Most data sources, including Big Data, Relational Databases, Cloud Data, and Excel Spreadsheets, can be easily deployed by copying the file from the source and pasting it into your Tableau worksheet.
- Wildcard Union and Cross-Data Join: Tableau allows users to perform Cross-Data Join and Union operations. This aids in the removal of barriers and time-consuming workarounds that were required due to the extensive use of multiple data sources.
- Powerful Collaboration: Tableau provides its users with the tools they need to work with and understand data, from web editing and authoring to Data Source recommendations. You can quickly publish your Dashboard to Tableau Server or Tableau Online, allowing everyone in your organization to see your insights, ask questions, and form collective decisions.
Why do you need an open-source Tableau Alternative?
Although Tableau is one of the most refined Data Visualization and Business Intelligence tools available in the market, there are some limitations to it that might compel you to learn about its alternatives. Some of those limitations are as follows:
- High Cost: Tableau is not the most expensive Data Visualization software available but it is significantly more expensive than its counterparts. The license for Tableau is quite expensive for most small to medium-sized businesses, making it one of Tableau’s significant disadvantages. Furthermore, the software necessitates proper deployment, implementation, maintenance, and staff training, all of which are costly. As a result of its high cost, Tableau is primarily used by large corporations.
- No Support for Scheduling: Tableau does not automatically update the reports, as there is no feature for scheduling provided. As a result, a significant manual effort is required from the user’s end to update the data at the back end.
- Security Issues: Since Data Visualization solutions manipulate some sensitive data, vendors place a premium on security. Despite Tableau’s deep concern for data security, it does not provide centralized data-level security. It only allows for row-level security, which requires that each user have his or her own account, and a large number of accounts increases the likelihood of the system being hacked.
- No Version Control: Only recent Tableau versions support Revision History, and software rolling back is not possible for older versions. Once the dashboards and reports are published to the server, there is no way to return to previous levels of data in Tableau. It is not possible to recover deleted data.
Best Tableau Open Source Alternatives
Given below is a comprehensive list of the top Tableau Open Source alternatives that can be used to visualize data while providing solutions to overcome the above-listed problems:
1) Apache Superset
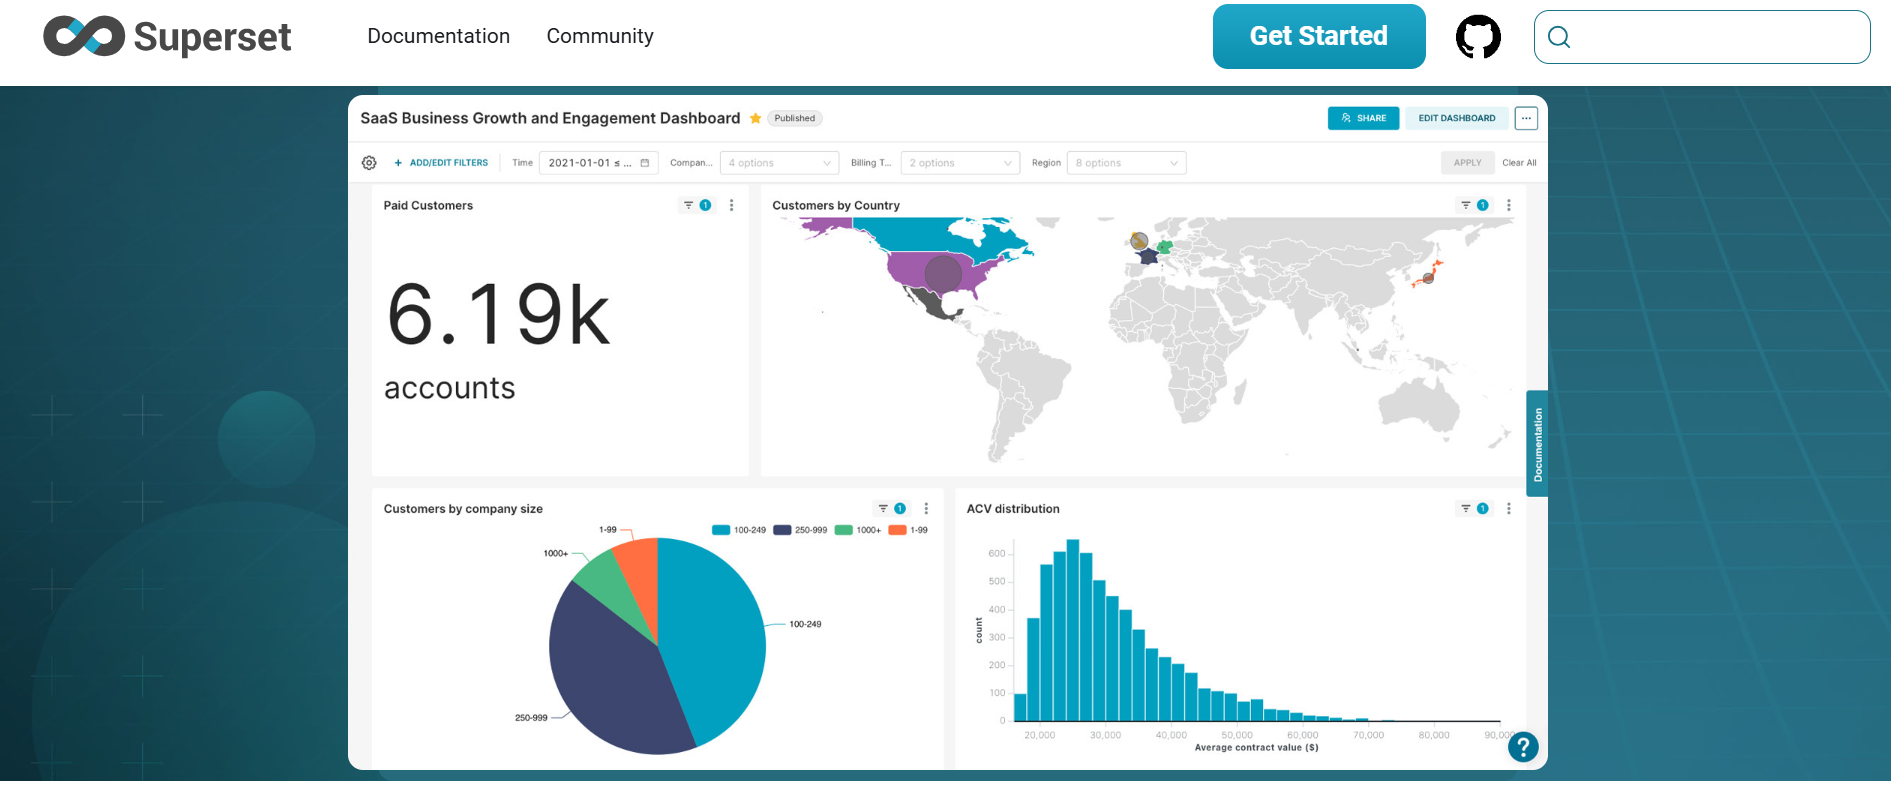
Apache Superset is one of the best open-source Tableau Alternatives for Data Exploration and Business Analytics. This Open-Source project is licensed under the Apache License 2.0, which allows anyone to use it and distribute a modified version of it.
In comparison to Tableau, which charges a minimum of $15 per month for Tableau Viewer, this software is completely free. Apache Superset is specifically designed to provide an easy-to-use interface, allowing users to deal with colossal amounts of data in an efficient manner.
The number of data sources supported is an important factor to consider while choosing a Business Intelligence solution, and Apache Superset performs admirably well in this regard. It provides support for a majority of the SQL databases.
You have complete control over the accessibility of your data with this tool. It allows you to add users to your database, grant them permissions, and track their activities. You can check out our blog on Apache Superset to learn more about it.
2) Grafana
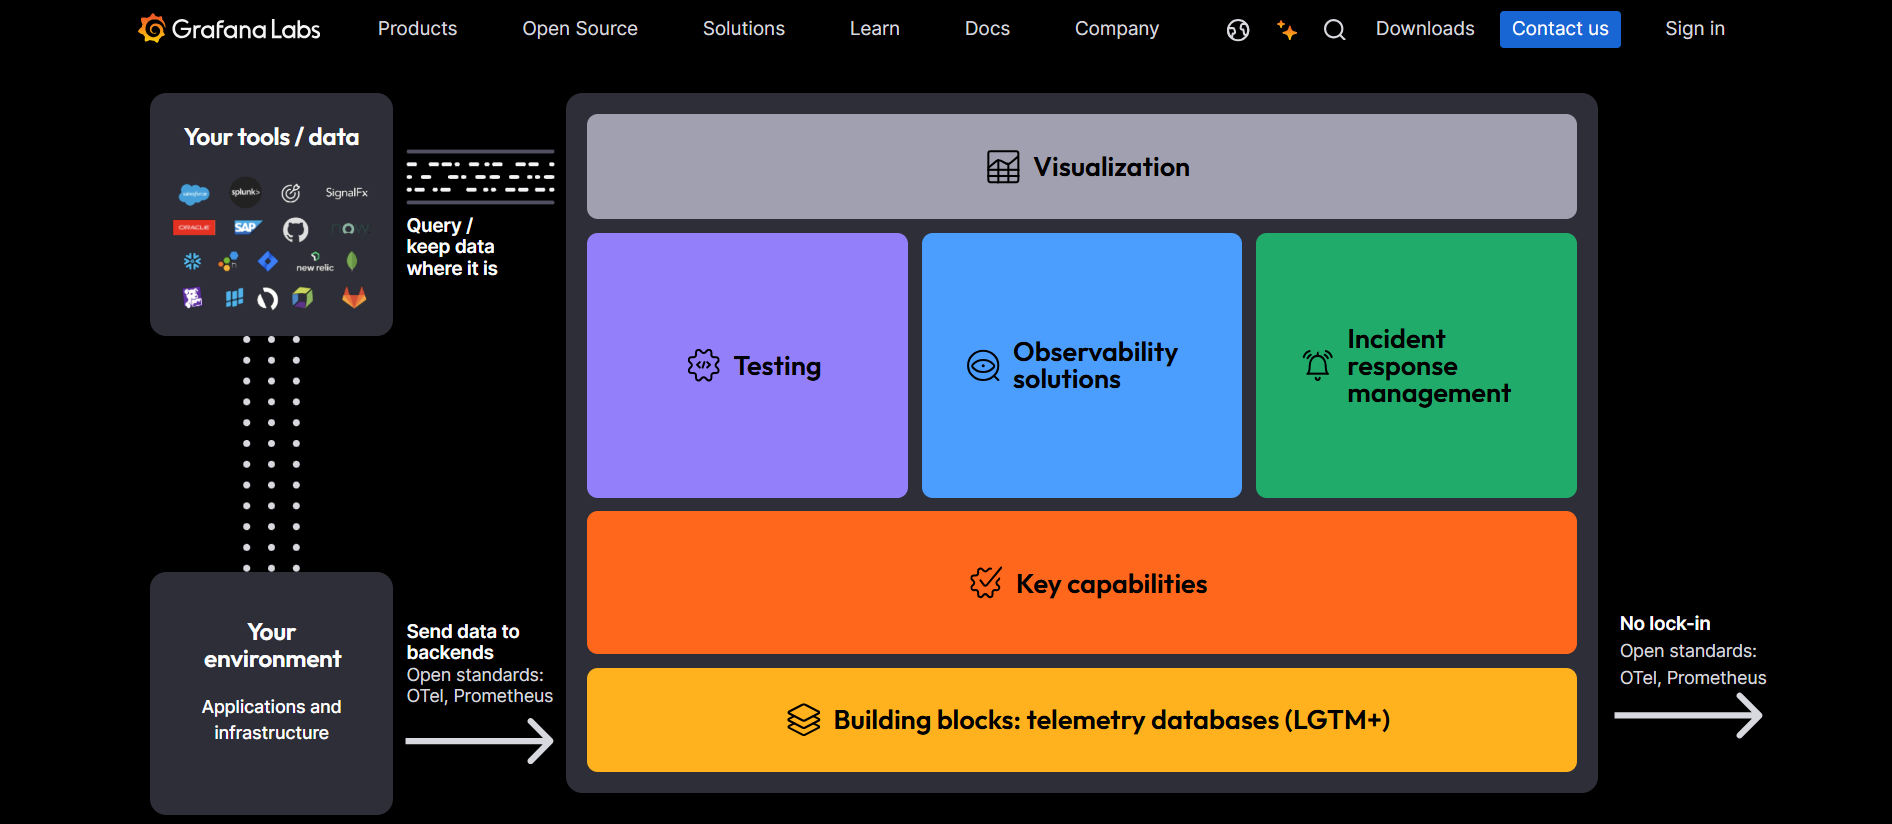
Grafana is a multi-platform application that is available for macOS, Windows, and Linux users. It is one of the few Tableau Open Source options that is comparable to Tableau in terms of popularity. Although it is free, it has an Enterprise version that is used by multinational corporations such as Bloomberg, PayPal, and eBay.
When it comes to visualization, Grafana is a great tool for visualizing time series data with support for various databases, including Prometheus, InfluxDB, and Graphite. It is also compatible with relational databases such as MySQL and Microsoft SQL Server.
While Tableau can do the same thing, Grafana’s open-source status allows users to add additional data sources and visualization tools to the program via a plugin, which means they don’t even have to write the code by themselves. Instead, they can leverage add-ons created by other developers.
The most significant advantage of using Grafana as an alternative to Tableau is its Alerts feature. Users can send and receive data event alerts through any communication channel, including Slack and PagerDuty.
You can also manually configure scenarios and events, which is useful for testing hypotheses or anticipating a potential problem. Tableau has a similar feature, but it is less robust and only supports Email notifications.
3) Metabase

Tableau Open Source alternatives are typically free, making them appealing to freelancers and small businesses. However, even Business Intelligence tools with a commercial component, such as Metabase, are less expensive on average. Metabase is very similar to Tableau in the sense that it is a Data Analytics tool that is accessible to both tech-savvy and non-tech-savvy users. It enables the creation of Charts and Dashboards as well as the execution of queries without the use of SQL.
Self-hosted deployment, an unlimited number of charts and dashboards, and support for over 20 different database types are some of the features offered by the open-source version of Metabase. Metabase also provides more than 15 visualization options, as well as the ability to schedule updates via Email or Slack. If the software’s out-of-the-box features are insufficient, you can extend its capabilities or download any of the 2000+ GitHub forks.
The software is also extremely user-friendly, with a simple user interface and features such as Quick Summarization and a Notebook Editor. Furthermore, the company provides extensive documentation for the program, and you can seek additional assistance from the developer community.
4) Redash

Redash is an Open-Source collaborative Business Intelligence tool that offers a wide range of robust integration capabilities when compared to existing Data Analytics platforms, making it a favourite among companies that have deployed multiple applications to manage their business processes.
With Redash, you can integrate with Data Warehouses more quickly, write SQL queries to pull subsets of data for visualizations, and share dashboards more easily. Its SQL interface is especially easy to use for anyone who is familiar with SQL Server Management Studio or any querying GUI tool for databases. It also provides support for over 20+ data sources and allows users to share visualizations and their associated queries easily with other team members. You can also check out our blog on Redash to learn more about it.
5) Pentaho Community Edition
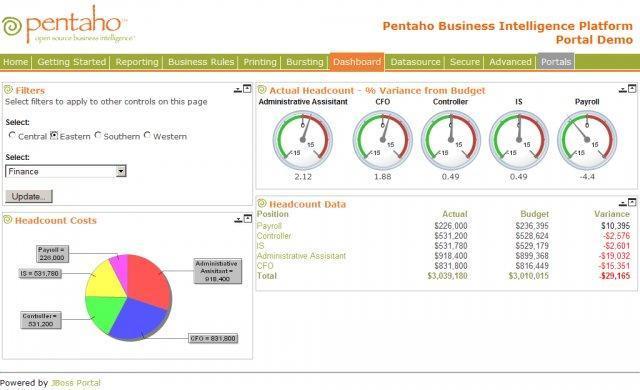
Owned by Hitachi, Pentaho is a dedicated Business Intelligence tool that offers a blend of Analytics and Data integration to its users. It is one of the most intuitive Tableau Open Source alternatives that provide a wide range of BI options to meet all your company’s needs and generate output in a variety of formats, including Excel, PDFs, and HTML.
This business suite is offered in two variants with the first one being Pentaho Community Edition which is a free and open-source Business Intelligence software that includes almost all of the features and options needed to create comprehensive analytical reports whereas the other one is Pentaho Enterprise Edition which is a subscription-based edition with slightly more features than the free version.
Effortless Data Integration for Your BI Platform

6) SpagoBI

SpagoBI is an open-source Business Intelligence Software for Data Reporting, Data Mining, and Visualization that was developed by an Italian software services company, the Open Source Competency Centre of Engineering Group. With a plethora of analytical functions, this software ensures that advanced visualization is included in the reports. The SpagoBI Server, which provides core analytical features, is the most important module of this software.
It has two conceptual models for analysis, each supporting a different set of functionalities. The first one is the Analytical model, which fulfills all the analytical requirements, and the other one is the Behavioral model, which moderates the end-user roles for visualizing data and all other documents. Furthermore, the cross-platform services included with SpagoBI enable you to perform analytical activities across all related domains.
7) RAWGraphs

RAWGraphs is an open-source Data Visualization tool designed to make visualizing complex data simple for everyone. The primary goal of RAWGraphs is to provide a tool that allows people who do not have the technical/coding expertise to create visualizations on their own. Originally designed to help graphic designers complete a set of tasks that were not available in other tools, it has evolved into a platform that offers simple ways to map data dimensions onto visual variables.
RAWGraphs, in essence, enables users to quickly and easily create data visualizations that can be exported and edited in Vector Graphics Software (such as Adobe Illustrator and Sketch). It was built on top of the d3.js library and distributed under the Apache License 2.0. As a result, the source code is not only highly customizable and compatible with any JS framework, but it is also free to use and modify, even for commercial purposes.
8) Plotly-Dash

One of Tableau’s key selling points as a Business Intelligence tool is that users with no technical background can use it to extract valuable insights from large amounts of data. The same can be said about this Tableau Open Source alternative. Plotly is a software company that creates tools for Data Analytics and Visualization. Dash is the company’s open-source framework that allows anyone to create web-based analytical applications. Apart from being able to capitalize on Plotly’s distinct advantages, it also supports interactive visualizations. Plotly also offers customizable interactive tools such as Dropdowns, Sliders, and Buttons that provide access to various graph perspectives.
Check out their official website to learn more about Plotly-Dash.
9) Knime Analytics Platform

KNIME Analytics Platform is an open-source Business Intelligence software that has been developed as an integration platform for creating analytical reports. It is a software that might be difficult for a novice to use. However, for Data Scientists and other Data professionals, particularly those who want to work with R, Python, or other Predictive Machine Learning tools, the KNIME Analytics Platform is an undoubtedly useful tool to perform Multivariate Analysis and Data Mining.
10) BIRT
Launched in 2004, Business Intelligence and Reporting Tools (BIRT) is one of the most used open-source Business Intelligence tools worldwide. With an intuitive user interface, BIRT allows the users to generate a variety of comprehensive reports, including textual details, graphs, and various charts. Although this software is primarily intended to meet the needs of intuitive reporting, it can go a step further by incorporating Data Analysis and presenting the data in a more grouped and analytical manner. Furthermore, it can be embedded with a variety of other applications. To be more precise, BIRT can be easily embedded with JAVA/JAVA EE applications to create comprehensive reports.
In-Depth Analyses of Popular Open Source Tools
- Open Source ETL Tools
- PostgreSQL ETL Tools
- Python ETL Tools
- Top 12 Open Source CI/CD Tools
- 5 Best Open-Source Data Replication Tools
Conclusion
This blog introduced you to Tableau along with the salient features that it offers. It also provided you with a comprehensive list of the top Tableau Open Source alternatives that you can use. As you collect and manage your data across several applications and databases in your business, it is important to consolidate it for a complete performance analysis of your business.
To achieve this, you need to assign a portion of your engineering bandwidth to integrate data from all sources, Clean & Transform it, and finally, load it to a Cloud Data Warehouse, BI Tool like Tableau, or a destination of your choice for further Business Analytics. All of these challenges can be comfortably solved by a Cloud-based ETL tool such as Hevo Data.
Hevo Data, a No-code Data Pipeline, can seamlessly transfer data from a vast sea of 100+ sources to a Data Warehouse, BI Tool like Tableau, or a Destination of your choice. It is a reliable, completely automated, and secure service that doesn’t require you to write any code!
If you are using Tableau as your Data Analytics & Business Intelligence platform and searching for a no-fuss alternative to Manual Data Integration, then Hevo can effortlessly automate this for you. Hevo, with its strong integration with 150+ data sources and BI tools (Including 60+ Free Sources), allows you to not only export & load data but also transform & enrich your data & make it analysis-ready in a jiffy.
You can try Hevo’s 14-day free trial. You can also have a look at the unbeatable pricing that will help you choose the right plan for your business needs!
FAQ on Tableau Open Source Alternatives
1. Is Tableau an open source?
No, Tableau is not open source. It is proprietary software developed by Tableau Software, which is now a part of Salesforce. As proprietary software, its source code is not available for public use, modification, or distribution.
2. Is Tableau a free source?
While Tableau itself is not free, it offers some free products and limited-time trials for its paid versions.
3. Is there a free Tableau version?
Yes, Tableau offers a few options that can be used for free:
1. Tableau Public:
– Description: A free version of Tableau that allows users to create visualizations and share them publicly on the web.
2. Tableau Reader:
– Description: A free desktop application that allows users to view and interact with Tableau visualizations created by others.
3. Tableau Free Trial:
– Description: Tableau offers a 14-day free trial for its fully featured products, such as Tableau Desktop, Tableau Online, and Tableau Server.
4. What Are Some Free Alternatives to Tableau?
If you’re looking for free options similar to Tableau, consider these tools:
Google Data Studio, Apache Superset, Microsoft Power BI (Free Edition), Metabase, Redash, and KNIME. These platforms offer robust data visualization and analytics capabilities without the cost.

Share it with your connections.
-
 Share To X
-
 Share To LinkedIn
-
 Share To Facebook
-
 Copy Link