The process of capturing and analyzing data is a challenge to every organization. Every untracked piece of data is a lost insight that could have helped an organization be one step ahead of its competitors. Tableau is a great tool for understanding and extracting hidden information from data belonging to different sources such as Google Analytics, a comprehensive data analytics tool.
This article is aimed at providing a step-by-step guide on how to connect Google Analytics to Tableau.
Table of Contents
Introduction to Google Analytics
Google Analytics is a Web Analytics Service that provides users with Statistical and Analytical information. It is highly useful & helps in managing Search Engine Optimization (SEO) and Product Marketing Operations. It is free of cost service available to every Google User.
It visualizes data using its interactive features such as Dashboard, Motion Charts, and Scorecards to display real-time changes in data. Using Google Analytics, you can generate a custom report that meets your business requirements.
For more information on Google Analytics, visit the Google Analytics Academy to learn about the basic or advanced features for Campaign Tracking. You can also read our blog to learn more about Google Analytics Channels.
Introduction to Tableau
Tableau is a powerful Business Intelligence Tool used to turn raw data into an understandable format. It is a tool popularly used to visualize data and can be understood even by a non-technical user.
It creates visualizations with the help of Dashboards and Worksheets, helping users perform real-time analysis in a very fast and secure manner. It doesn’t require a user to have any programming skill or technical background to operate it.
For further information on creating Tableau Reports, you can visit our comprehensive blog.
Unlock the power of Hevo to effortlessly integrate your Google Analytics data, ensuring streamlined preparation and insightful analysis. Hevo constantly monitors the pipeline’s health to safeguard your data.
Hevo’s no-code platform empowers teams to:
- Integrate data from 150+ sources(60+ free sources).
- Simplify data mapping and transformations using features like drag-and-drop.
- Easily migrate different data types like CSV, JSON, etc., with the auto-mapping feature.
Join 2000+ happy customers like Whatfix and Thoughtspot, who’ve streamlined their data operations. See why Hevo is the #1 choice for building modern data stacks.
Get Started with Hevo for FreePrerequisites
- Working knowledge of Google Analytics.
- Working Knowledge of Tableau.
- Tableau installed at the Host Workstation.
- A Google Analytics account.
Using Google Analytics
To use the Google Analytics service, all you need is a working Google Account. If you already have one, you can directly go to Google Analytics’ official website and log in.
Once you have logged in successfully, the Google Analytics home screen will open up.
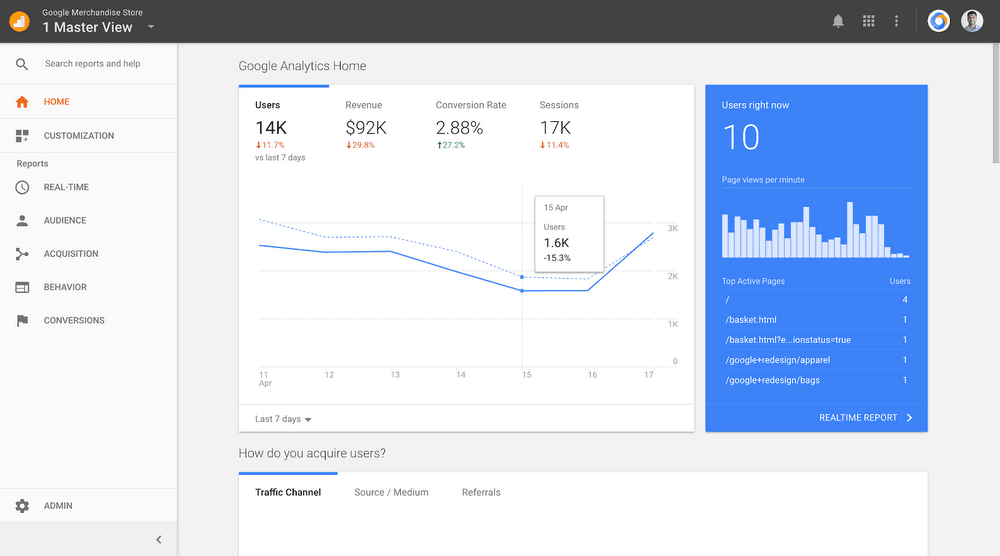
Click on the Admin button present in the bottom left corner of the screen. A page representing configuration settings will now show up. It will display your account details such as Account, Properties, and Views.

Set up your account by clicking on the Create Account button. Provide the details for your account such as name and link it to your organisation.

Depending upon the kind of data you want to measure, you can either select web or apps as the desired choice. Set the time-zone and the industry your data belongs to carefully. Click on Create.

This is how you can set up a Google Analytics account.
Using Tableau
Tableau is a fast-evolving Business Intelligence Tool, used to analyze & visualize data in real-time using its intuitive interface. It is easy to learn and can be operated even by an individual with no technical background.
Once you have logged in successfully, Tableau’s home screen will open up.
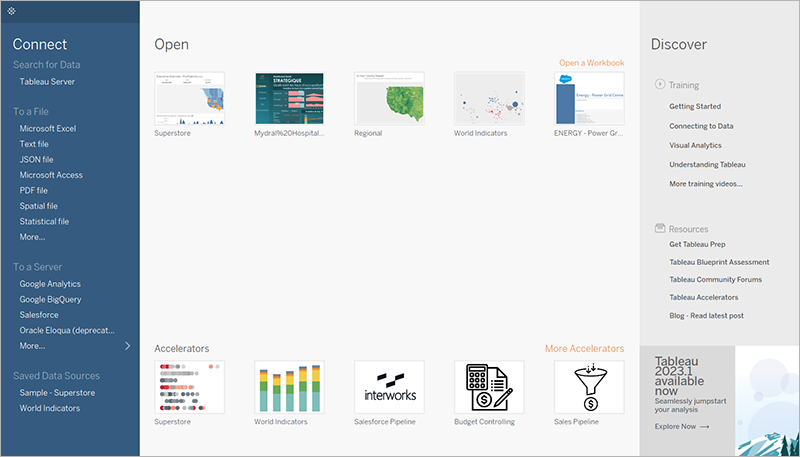
In the Connect column, you will find multiple sources you can easily connect to with Tableau. The source can be a File, a Server or even saved Data Sources. You can analyze your data by dragging it to the center of the screen called Canvas.

Tableau comes pre-loaded with several sample Workbooks. You can use these to get a better understanding of how a typical Workbook looks like and how you can visualize data in Tableau.
This is how you can use Tableau.
Connecting Google Analytics to Tableau
Tableau’s in-built Google Analytics Connector lets you connect Google Analytics to Tableau easily. You can establish a connection between the two using Tableau’s interactive interface. Tableau has rich API support that allows you to manipulate data and perform an insightful analysis.
Using Tableau’s Google Analytics Connector
This can be implemented using the following steps:
- Step 1: Signing in to Tableau
- Step 2: Signing in to Google Analytics
- Step 3: Extracting data from Google Analytics
Step 1: Signing in to Tableau
Launch Tableau on your workstation and log in as a user with a Creator Role. Select Google Analytics from the connect column on the left.

This will open a dialogue box where you need to provide the credentials for your Google account. You can even select your desired account from a list of saved Google Accounts.
Step 2: Signing in to Google Analytics
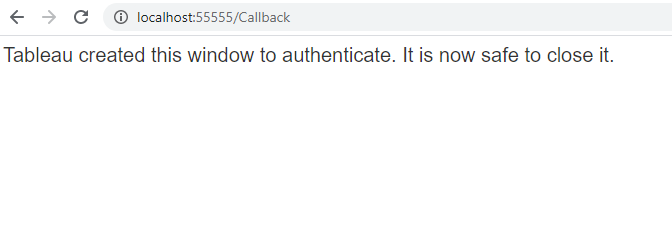
Enter the credentials for your Google account carefully and sign-in to Google Analytics. Once you have signed in, you will be requested to provide Tableau, access to your data stored in Google Analytics.

Click on Accept to let Tableau successfully access your data. Once you have successfully provided access, you will see the following tab open in your browser:
Step 3: Extracting Data from Google Analytics
Once you have signed-in successfully, a page representing configuration settings will now show up. It will display your account details such as account name, properties, and views.

Fill in the desired date range and segment choice under the filters option. You will be able to pull in data up to the previous day. If you select the date range as 30 days, it will bring in data for the past 30 days with the 30th day being yesterday.
The segments option allows you to filter users. Google provides various default segments, however, users can fix custom segments as per their needs. This can be set up easily while establishing a connection with Google Analytics
Google Analytics allows you to select up to 10 measures and 7 dimensions for the data you’re going to load into Tableau. You can either create a custom set or simply use the drop-down list to select a predefined set of dimensions and measures.
Launch Tableau and select the sheets tab to begin analyzing your data.

This is how you can connect Google Analytics to Tableau.
Limitations of Connecting Google Analytics to Tableau Using the In-Built Connector
- It is not possible to load data from Google Analytics to Tableau in real-time. The user must refresh the data source for the changes to reflect.
- The Google Analytics API limits the connector and restricts the users from querying more than 10,000 rows at once.
- Querying a large amount of data or scheduling extracts hampers the performance, thus slowing down the process.
- Querying multiple dimensions at once often results in sampled data being reflected.
Conclusion
This article offers a step-by-step solution to connect Google Analytics to Tableau. It provides a brief introduction of these tools and their operations to help users understand them better and use them to analyze their data efficiently and in real-time. It also introduces an alternative method to simplify your data analysis and get rid of all those limitations. Sign up for a free trial and try more such migrations with ease.
Tell us about your experience of connecting Google Analytics to Tableau! Share your thoughts in the comments section below.
FAQs
1. Can I connect Tableau with Google Analytics?
Yes, Tableau connects directly to Google Analytics, allowing you to visualize and analyze your data.
2. Does Google data analytics teach Tableau?
No, Google Data Analytics focuses on data skills but does not specifically teach Tableau.
3. Can I extract data from Google Analytics?
Yes, you can export data from Google Analytics using its built-in export features or connect via APIs for advanced extraction.
Share it with your connections.
-
 Share To LinkedIn
-
 Share To Facebook
-
 Share To X
-
 Copy Link