


Are you attempting to gain more information from your Google Analytics by moving it to a larger database such as MySQL? Well, you’ve come to the correct place. Data replication from Google Analytics to MySQL is now much easier.
This article will give you a brief overview of Google Analytics and MySQL. You will also explore 2 methods to set up Google Analytics to MySQL Integration. In addition, the manual method’s drawbacks will also be examined in more detail in further sections. Read along to see which way of connecting Google Analytics to MySQL is the most suitable for you.
Table of Contents
Getting Started with Google Analytics: The Basics Explained

Google Analytics is the service offered by Google to get complete information about your website and its users. It allows the site owners to measure the performance of their marketing, content, and products. It not only provides unique insights but also helps users deploy machine learning capabilities to make the most of their data. Despite all the unique analysis services provided by Google, it is sometimes required to get the raw clickstream data from your website into the on-premise databases. This helps in creating deeper analysis results by combining the clickstream data with the organization’s customer data and product data.
To know more about Google Analytics, visit the Official Site.
MySQL Essentials: Your Guide to the Basics

MySQL is a SQL-based open-source Relational Database Management System. It stores data in the form of tables. MySQL is a platform-independent database, which means you can use it on Windows, Mac OS X, or Linux with ease. MySQL is the world’s most used database, with proven performance, reliability, and ease of use. It is used by prominent open-source programs like WordPress, Magento, Open Cart, Joomla, and top websites like Facebook, YouTube, and Twitter.
To learn more about MySQL, visit this MySQL’s official site.
Tired of writing long lines of code for replicating your data from Google Analytics to MySQL? Unlock the power of your data by effortlessly replicating it using Hevo’s no-code platform. Use Hevo for:
- Simple two-step method for replicating Google Analytics data to MySQL.
- Performing pre/post load transformations using drag-and-drop features.
- Real-time data sync to get analysis-ready data.
Try Hevo and discover why 2000+ customers like Ebury have chosen Hevo over tools like Fivetran and Stitch to upgrade to a modern data stack.
Get Started with Hevo for FreeMethods to Set up Google Analytics to MySQL Integration
Let’s dive into both the manual and Hevo methods in depth. You will also see some of the pros and cons of these approaches and will be able to pick the best method to export Google Analytics data to MySQL based on your use case. Below are the two methods to set up Google Analytics to MySQL Integration:
Prerequisites
You will have a much easier time understanding the ways to set up the Google Analytics to MySQL connection if you have gone through the following aspects:
- Working knowledge of at least one scripting language.
- An active Google Analytics account.
- An active MySQL account.
- Working knowledge of SQL.
Method 1: Using Hevo to Set up Google Analytics to MySQL Integration
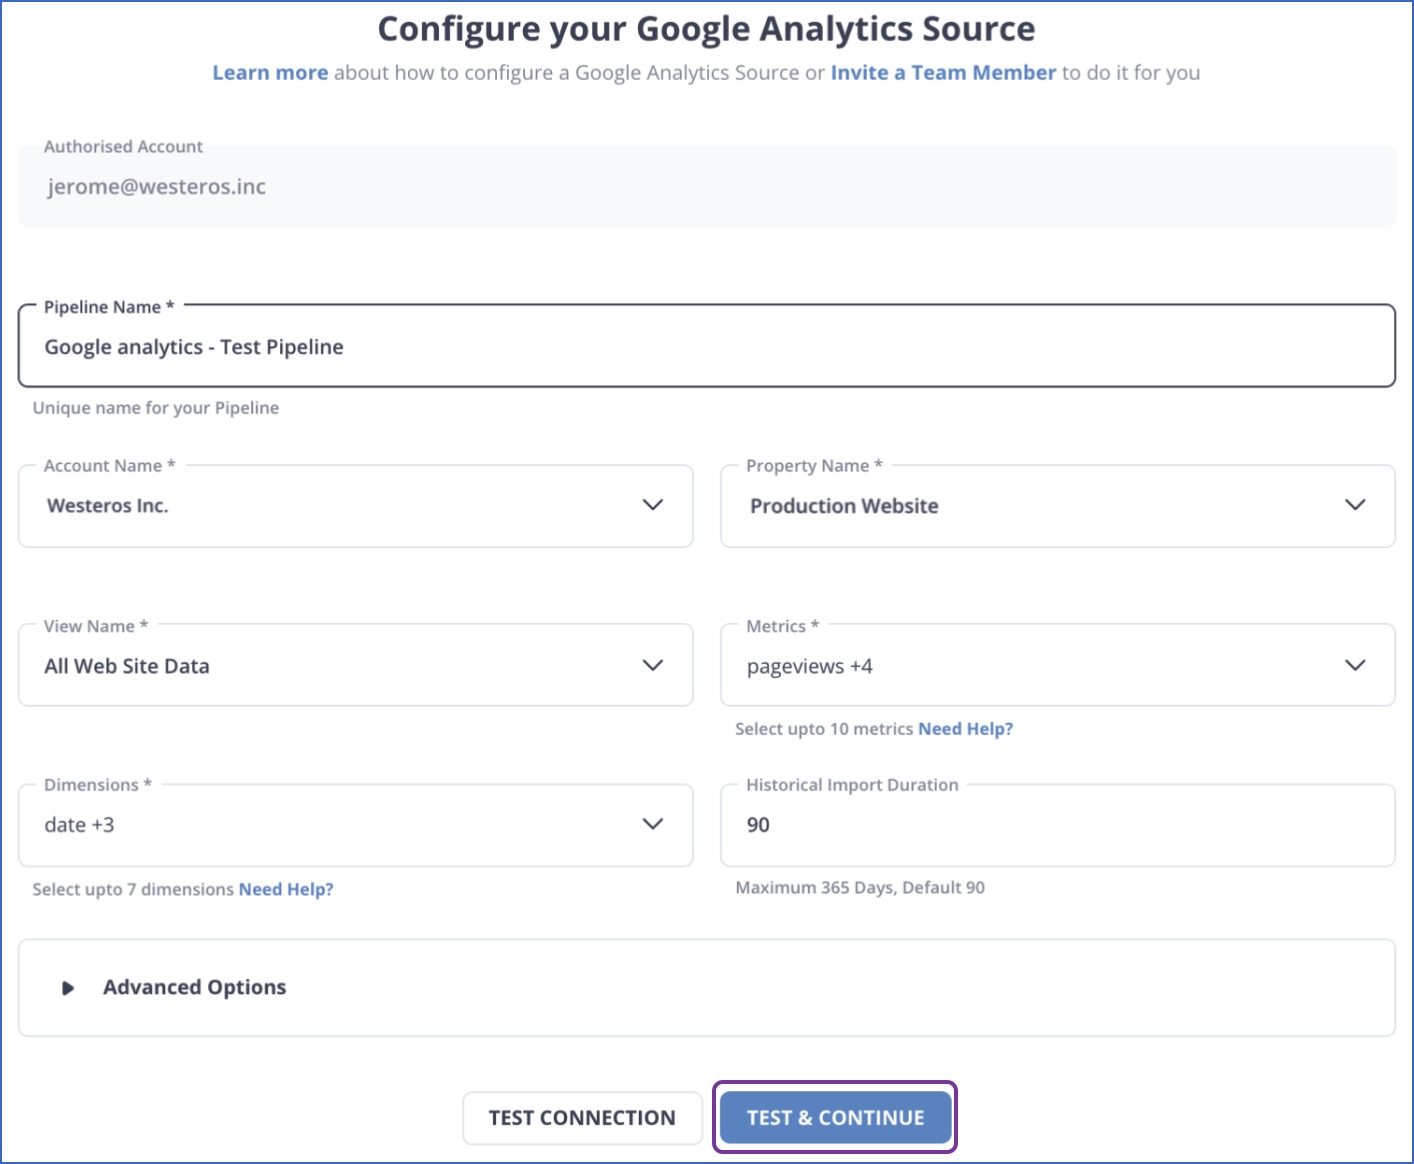
Step 1: Configure and authenticate Google Analytics source.
Step 2: Configure the MySQL database where the data needs to be loaded.

Hevo does all the heavy lifting, masks all ETL complexities, and delivers data in MySQL in a reliable fashion.
Here are more reasons to try Hevo to connect Google Analytics to MySQL database:
- Schema Management: Hevo takes away the tedious task of schema management & automatically detects the schema of incoming data and maps it to the destination schema.
- Incremental Data Load: Hevo allows the transfer of data that has been modified in real-time. This ensures efficient utilization of bandwidth on both ends.
- Data Transformation: It provides a simple interface to perfect, modify, and enrich the data you want to transfer.
Bringing in Hevo was a boon. Our data moves seamlessly from all sources to Redshift, enabling us to do so much more with it
– Chushul Suri, Head Of Data Analytics, Meesho
Method 2: Manual ETL process to Set up Google Analytics to MySQL Integration
Below is a method to manually set up Google Analytics to MySQL Integration:
Step 1: Getting data from Google Analytics
Google Analytics makes the click event data available through its Reporting API V4. Reporting API provides two sets of Rest API to address two specific use cases.
- Get aggregated analytics information on user behavior on your site on the basis of available dimensions – Google calls these metrics and dimensions. Metrics are aggregated information that you can capture and dimensions are the terms on which metrics are aggregated. For example, the number of users will be a metric and time will be a dimension.
- Get activities of a specific user – For this, you need to know the user id or client id. An obvious question then is how do you know the user id or client id. You will need to modify some bits in the client-side google analytics function that you are going to use and capture the client id. Google does not specifically tell you how to do this, but there is ample documentation on the internet about it. Please consult the laws and restrictions in your local country before attempting this, since the legality of this will depend on the privacy laws of the country. You will also need to go to the Google Analytics dashboard and register the client id as a new dimension.
Google Analytics APIs use oAuth 2.0 as the authentication protocol. Before accessing the APIs, the user first needs to create a service account in the Google Analytics dashboard and generate authentication tokens. Let us review how this can be done.
- Go to google service accounts page and select a project. If you have not already created a project, create a project.
- Click on Create Service Account.
- You can ignore the permissions for now.
- On the ‘Grant users access to this service account’ section, click Create key
- Select JSON as the format for your key.
- Click Create a key and you will be prompted with a dialogue to save the key in your local computer. Save the key.
We will be using the information from this step when we actually access the API. This API is now deprecated and all existing customers will lose access by July 1, 2024. Data API v1 is now being used instead of it.
Limitations of using the manual method to load data from analytics to MySQL are:
Step 2: Accessing Google Reporting API V4
Google provides easy-to-use libraries in Python, Java, and PHP to access its reporting APIs. It is best to use these APIs to download the data since it would be a tedious process to access these APIs using command-line tools like CURL. Here we will use the Python library to access the APIs. The following steps detail the procedure and code snippets to load data from Google Analytics to MySQL.
- Use the following command to install the Python GA library to your environment.
sudo pip install --upgrade google-api-python-client
This assumes the Python programming environment is already installed and works fine.
We will now start writing the script for downloading the data as a CSV file.
- Import the required libraries.
from apiclient.discovery import build from oauth2client.service_account import ServiceAccountCredentials
- Initialize the required variables.
SCOPES = [‘https://www.googleapis.com/auth/analytics.readonly’] KEY_FILE_LOCATION = ‘<REPLACE_WITH_JSON_FILE>’ VIEW_ID = ‘<REPLACE_WITH_VIEW_ID>’
The above variables are required for OAuth authentication. Replace the key file location and view id with what we obtained in the first service creation step. View ids are the views from which you will be collecting the data. To get the view id of a particular view that you have already configured, go to the admin section, click on the view that you need, and go to view settings.
- Build the required objects.
credentials = ServiceAccountCredentials.from_json_keyfile_name(KEY_FILE_LOCATION, SCOPES) #Build the service object. analytics = build(‘analyticsreporting’, ‘v4’, credentials=credentials)
- Execute the method to get the data. The below query is for getting the number of users aggregated by country from the last 7 days.
response = analytics.reports().batchGet( body={ ‘reportRequests’: [ { ‘viewId’: VIEW_ID, ‘dateRanges’: [{‘startDate’: ‘7daysAgo’, ‘endDate’: ‘today’}], ‘metrics’: [{‘expression’: ‘ga:sessions’}], ‘dimensions’: [{‘name’: ‘ga:country’}] }] } ).execute()
- Parse the JSON and write the contents into a CSV file.
import pandas as pd from pandas.io.json import json_normalize reports = response[‘reports’][0] columnHeader = reports[‘columnHeader’][‘dimensions’] metricHeader = reports[‘columnHeader’][‘metricHeader’][‘metricHeaderEntries’] columns = columnHeader for metric in metricHeader: columns.append(metric[‘name’]) data = json_normalize(reports[‘data’][‘rows’]) data_dimensions = pd.DataFrame(data[‘dimensions’].tolist()) data_metrics = pd.DataFrame(data[‘metrics’].tolist()) data_metrics = data_metrics.applymap(lambda x: x[‘values’]) data_metrics = pd.DataFrame(data_metrics[0].tolist()) result = pd.concat([data_dimensions, data_metrics], axis=1, ignore_index=True) result.to_csv(‘reports.csv’) Save the script and execute it. The result will be a CSV file with the following columns Id , ga:country, ga:sessions- This file can be directly loaded to a MySQL table using the below command. Please ensure the table is already created.
LOAD DATA INFILE’products.csv’ INTO TABLE customers FIELDS TERMINATED BY ‘,’ ENCLOSED BY ‘“’ LINES TERMINATED BY ‘rn’ ;
That’s it! You now have your Google Analytics data in your MySQL. Now that we know how to get the Google Analytics data using custom code, let’s look into the limitations of using this method.

Use Cases for Google Analytics MySQL Connection
There are several benefits of integrating data from Google Analytics 4 (GA4) to MySQL. Here are a few use cases:
- Advanced Analytics: MySQL’s powerful data processing capabilities allow you to perform complex queries and data analysis on your Google Analytics 4 (GA4) data, extracting insights that wouldn’t be possible within Google Analytics 4 (GA4) alone.
- Data Consolidation: Syncing to MySQL allows you to centralize your data for a holistic view of your operations if you’re using multiple other sources along with Google Analytics 4 (GA4). This helps to set up a changed data capture process so you never have any discrepancies in your data again.
- Historical Data Analysis: Google Analytics 4 (GA4) limits historical data. However, syncing data to MySQL makes long-term data retention and analysis of historical trends possible.
- Data Security and Compliance: MySQL provides robust data security features. Loading data from Analytics to MySQL ensures its security and allows for advanced data governance and compliance management.
- Scalability: MySQL can handle large volumes of data without affecting performance. Hence, it provides an ideal solution for growing businesses with expanding Google Analytics 4 (GA4) data.
- Data Science and Machine Learning: When you connect Google Analytics to MySQL, you can apply machine learning models to your data for predictive analytics, customer segmentation, and more.
- Reporting and Visualization: While Google Analytics 4 (GA4) provides reporting tools, data visualization tools like Tableau, PowerBI, Looker (Google Data Studio) can connect to MySQL, providing more advanced business intelligence options.
Challenges of Building a Custom Setup
- The method even though elegant, requires you to write a lot of custom code. Google’s output JSON structure is a complex one and you may have to make changes to the above code according to the data you query from the API.
- This approach will work for a one-off data load to MySQL, but in most cases, organizations need to do this periodically merging the data point every day with seamless handling of duplicates. This will need you to write a very sophisticated import tool just for Google Analytics.
- The above method addresses only one API that is provided by Google. There are many other available APIs from Google which provide different types of data from the Google Analytics engine. An example is a real-time API. All these APIs come with a different output JSON structure and the developers will need to write separate parsers.
A solution to all the above problems is to use a completely managed Data Integration Platform like Hevo.
You can also learn more about:
Conclusion
This article provided a detailed step-by-step tutorial for setting up your Google Analytics to MySQL Integration utilizing the two techniques described in this article. The manual method although effective will require a lot of time and resources. Data migration from Google Analytics to MySQL is a time-consuming and tedious procedure, but with the help of a data integration solution like Hevo, it can be done with little work and in no time.
Learn how to transfer data from Segment to MySQL to enhance your data integration. Our guide offers clear steps for efficient setup.
Businesses can use automated platforms like Hevo to set this integration and handle the ETL process. It helps you directly transfer data from a source of your choice to a data warehouse, or any other desired destination in a fully automated and secure manner without having to write any code, and it will provide you with a hassle-free experience. Sign up for a 14-day free trial to make data migration a breeze!
Frequently Asked Questions
1. How do I export data from Google Analytics to MySQL?
You can export data from Google Analytics to MySQL in the following ways:
-Use the Google Analytics Reporting API to extract data.
-Use automated platforms like Hevo.
2. Can Google Analytics connect to a database?
Google Analytics itself doesn’t directly connect to databases. However, you can use automated tools like Hevo and APIs to extract data and then load it into a database.
3. Can I extract data from Google Analytics?
Yes, you can extract data using:
-Google Analytics Reporting API
-Google Sheets Add-on
-Automated tools like Hevo.
SIGN UP and move data from Google Analytics to MySQL instantly.
Share your experience of connecting Google Analytics and MySQL in the comments section below!
Share it with your connections.
-
 Share To LinkedIn
-
 Share To Facebook
-
 Share To X
-
 Copy Link


