


Businesses deal with data all day long. However, to make sense of the vast information, they look towards tools that can summarize their huge datasets into appealing and logical visual representations. Grafana is an interactive platform that provides companies with Data Visualization and Analytics facilities. Grafana integrates with all Data Sources using its customizable Plug-in tool. Moreover, it provides Dashboards that are reusable serves as a great platform for sharing data within a workforce.
Google BigQuery is one of the most popular Data Warehouse used by businesses across the globe. Its scalability, security, and high processing power make it a favorite for large businesses. Today companies are looking to use Grafana for understanding their Google BigQuery Datasets. This involves creating a Google BigQuery Plugin that can transfer its data into Grafana for further visualization.
This article will introduce you to Grafana and Google BigQuery and will explain their key features. It will provide you with a step-by-step approach for setting up your Grafana BigQuery Integration by creating a BigQuery Plugin. It will also explain the steps that you can follow to visualize your PostgreSQL data using Grafana. Read along to understand the Grafana BigQuery Integration and its benefits!
Table of Contents
Introduction to Grafana

Grafana is a visualization software that is popular for its Data Analytics properties. Since Grafana is an open-source tool, you can easily customize it according to your business requirements. It can take input from any data source and turn it into insightful visuals. Torkel Ödegaard in 2013 created Grafana as a simple and elegant solution for businesses to protect their data in a visually appealing and useful form. This tool currently supports over half a million users and the number is growing regularly.
Grafana’s usefulness lies in its analytics and prediction capabilities. It provides accurate results when it comes to revealing User Behaviours. Normal customers are not able to predict their own future or purchase trend, but Grafana’s advanced analytics can provide you with strong predictions. Furthermore, Grafana Dashboards let you visualize data from multiple data sources and also allow you to add a new Data Source via a Plugin.
Key Features of Grafana
Grafana is beneficial for businesses due to its following features:
- Plug-ins: Grafana already contains integrations with a number of popular data sources. However, you can go a step further and connect Grafana to the Data Source of your choice using Plug-ins. A Plug-in acts as a connector for integrating 2 software applications. This way you can apply Grafana’s Data Visualization capabilities to any data source that contains time-stamp bounded data.
- Graph Annotations: This feature enhances your Dataset’s correlation as it allows you to mark graphs. You can either manually populate the Graph data or use a data source for your visualization. Annotations act as checkpoints or bookmarks for your data. So, if you face any errors, you can revert to the last Annotation and rebuild the Graph.
- Dashboard Templates: This feature enables you to customize your Dashboard set up according to your business needs. Moreover, these Templates can be used for multiple tasks simultaneously. Templating allows you to cover both general and granular aspects of your data. Furthermore, you can easily share the Grafana Dashboards with anybody in your entire workforce.
- Grafana Reports: This feature lets you generate visually appealing reports for your various stakeholders. However, you can not create and share Grafana Reports if you are using the free version.
Introduction to Google BigQuery

Google BigQuery is a globally used Data Warehouse that offers storage for large amounts of data using Cloud technology. It operates on a serverless design and requires no infrastructural setup or hardware management from you. Moreover, Google BigQuery replicates your data stored in different locations automatically. This ensures high availability, and reliability when it comes to your company’s data.
Unlike some Cloud-based Data Warehouses in the market, this Google tool can deliver with little to no maintenance. Furthermore, Google allows you to access its Data Warehouse from all locations that have Google Cloud availability. Another advantage of using Google BigQuery is that you get seamless and free integrations with other Google-based services such as Google Analytics, Google Drive, etc.
Key Features of Google BigQuery
The following features of Google BigQuery make it beneficial for businesses of all magnitude:
- Availability: Google BigQuery supports automatic Data Replication. It also keeps a 7-day log that contains information about any changes made to your data during the previous week. These features protect your information from system failures and provide high Data Availability.
- Easy Maintenance: Since Google BigQuery automates almost all the data warehousing tasks like Running Queries, Managing Storage, Allocating Resources, etc. This minimizes the need for human interference in running and maintaining the Data Warehouse system.
- Smart Pricing: Google BigQuery has separate modules for storing and processing data. This safeguards you from paying extra costs and allows Google BigQuery to offer smart and appealing pricing models for businesses.
- Machine Learning: Google BigQuery’s machine learning capabilities provide real-time insight into your data. Its high-speed API provides a solid foundation for faster data analysis. This allows you to upload your business data and analyze it instantly.
- High Scalability: Google BigQuery operates on parallel processing. this way, it is able to offer you high scalability and consistency. It works great for real-time data analysis and tailors your data according to your needs.
Hevo Data, a no-code Data Pipeline, helps Load Data from any source, such as Databases, SaaS applications, Cloud Storage, SDKs, and Streaming Services, and simplifies the ETL process. It supports various data sources and loads the data onto the desired Data Warehouse, like Google BigQuery.
Check out why Hevo is the Best:
- Secure: Hevo’s fault-tolerant architecture ensures that data is handled securely, consistently, and with zero data loss.
- Schema Management: Hevo takes away the tedious task of schema management & automatically detects the schema of incoming data and maps it to the destination schema.
- Minimal Learning: Hevo, with its simple and interactive UI, is extremely simple for new customers to work on and perform operations.
- Hevo Is Built To Scale: As the number of sources and your data volume grows, Hevo scales horizontally, handling millions of records per minute with very little latency.
- Live Support: The Hevo team is available round the clock to extend exceptional support to its customers through chat, email, and support calls.
- Transparent Pricing: Hevo offers transparent pricing with no hidden fees, allowing you to budget effectively while scaling your data integration needs.
Try Hevo today and experience seamless data transformation and migration.
Sign up here for a 14-Day Free Trial!Steps to Set Up the Grafana BigQuery Integration
The Grafana BigQuery Integration requires you to create a BigQuery Plugin which will allow you to transfer data from Google BigQuery to Grafana. The following steps will enable you to create a Google BigQuery Plugin for Grafana:
- Step 1: Add BigQuery as Data Source Plugin
- Step 2: Set up the Grafana BigQuery Integration Authentication Key File
- Step 3: Download the Grafana BigQuery Integration Authentication Key File
- Step 4: Authenticate your Grafana BigQuery Integration
Step 1: Add BigQuery as Data Source Plugin
Navigate to the top and click the Grafana Icon to open the dropdown menu.
Locate the Dashboards option in the drop-down menu. In Dashboards find the Data Sources menu. Select the + Add Data Source option under Data Sources. It will open a dropdown menu from which you need to click on BigQuery.
Step 2: Set up the Grafana BigQuery Integration Authentication Key File
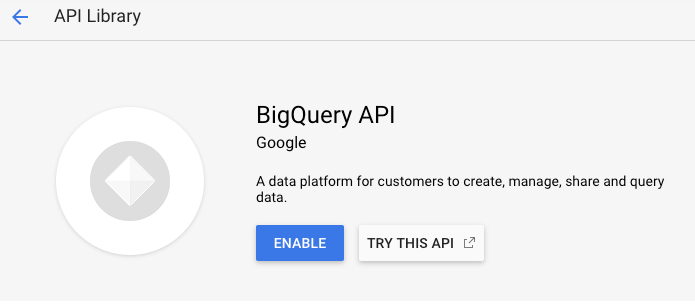
Once the plug-in is ready, you need to authenticate your Grafana BigQuery connection. To do this, log in to BigQuery API and click on Enable as shown in the below image.
Now, visit the APIs & Services Credentials page and select Create credentials as shown in the below image.
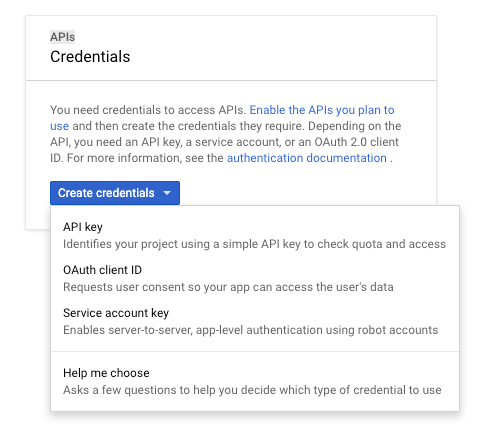
After that choose a Service account key. Once you are on the Create Service Account Key page, select JSON as your key type. This is shown in the below image.
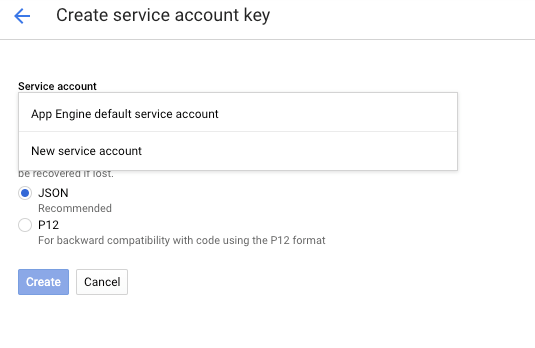
Then move to the Service Account menu and select the New service account. This will present new fields on your screen. Fill in the details required by the field and then go to the Role menu. In the Role dropdown, select 2 roles, namely BigQuery Data Viewer and BigQuery Job User.
Step 3: Download the Grafana BigQuery Integration Authentication Key File
Now, Click on Create. This will generate a JSON key file and automatically download it to your system. Store this file safely as it will be required in the next steps of Grafana BigQuery Integration, to provide access to the BigQuery data.
Step 4: Authenticate your Grafana BigQuery Integration
Open Grafana and visit the Data Source Configuration page. Now, upload or paste the file downloaded in the previous step. This is shown in the below image. This will authenticate your Grafana BigQuery connection.
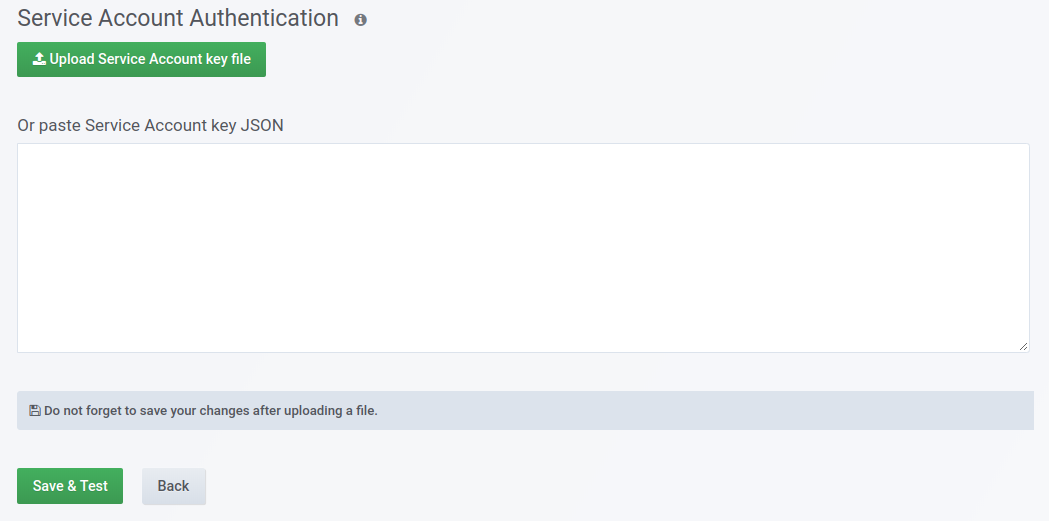
Finally, click on save. That’s it! Your Grafana BigQuery Integration is set.
Steps to Visualize Data using Grafana
Once a Data Source is connected to Grafana, it is easy to visualize its data. The following steps will show you how to use Grafana to visualize your data stored in PostgreSQL:
- Step 1: Connect PostgreSQL as Data Source
- Step 2: Set Up Grafana Configuration
- Step 3: Create a Grafana Dashboard
- Step 4: Link the Grafana Dashboard to PostgreSQL Plugin
Step 1: Connect PostgreSQL as Data Source
Navigate to the top and click the Grafana icon to open the dropdown menu.
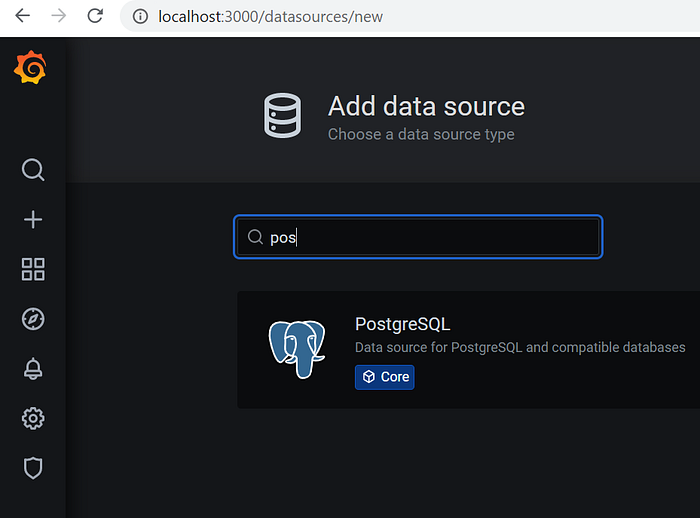
Locate the Dashboards option in the drop-down menu. In Dashboards find the link Data Sources under Configurations. Select the + Add data source option under Data Sources. It will open a dropdown menu from which you need to click on PostgreSQL as shown in the below image.
Step 2: Set Up Grafana Configuration
You will see a Configurations tab on your screen that requires details of your PostgreSQL Database. Complete the configuration by filling in the following details
Host : localhost:5331
User: postgres
Password : // your database password
SSL Mode: disable
After filling in the details, Select Save & Test.
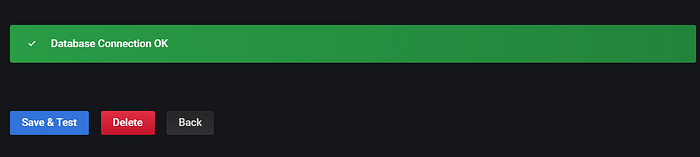
This will result in a pop-up message Database Connection OK. This implies that your PostgreSQL Database’s configuration with Grafana is complete.
Step 3: Create a Grafana Dashboard
Now go to Grafana Home page and in the left pane select the Create option and click on Dashboard as shown in the below image.

In the new Dashboard, select Add new panel. This will generate a new blank panel for you as shown in the below image.
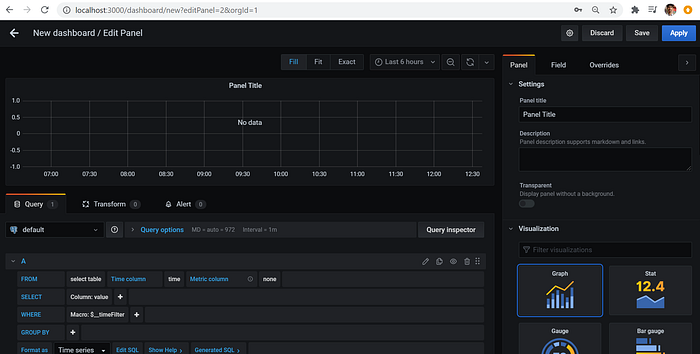
Fill in the name of your panel. Now, decide on a visualization model in which you want your output. In this section let’s select the Simple Line Graph option by clicking on its icon.
Step 4: Link the Grafana Dashboard to PostgreSQL Plugin
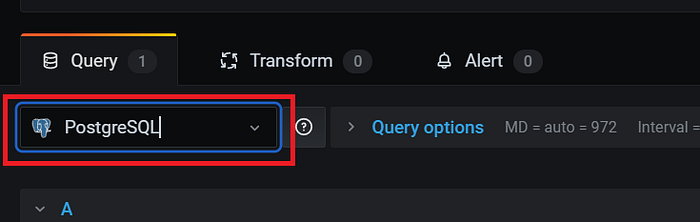
Now go to the Data Source tab and choose a Database created in Step 2.
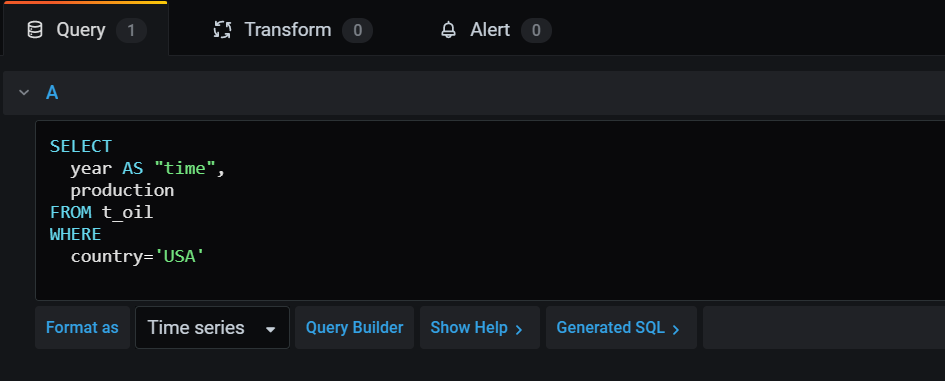
To create your line graph, select Edit SQL and write down the required query on the text editor. An example is shown in the below image.
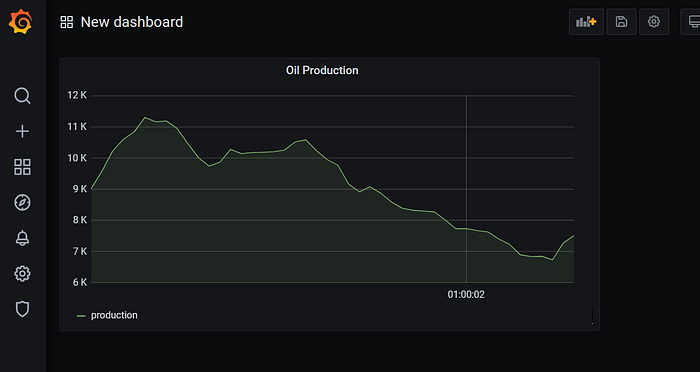
Once the Query is in place, navigate to the top of the Dashboard and Click on the Apply button.
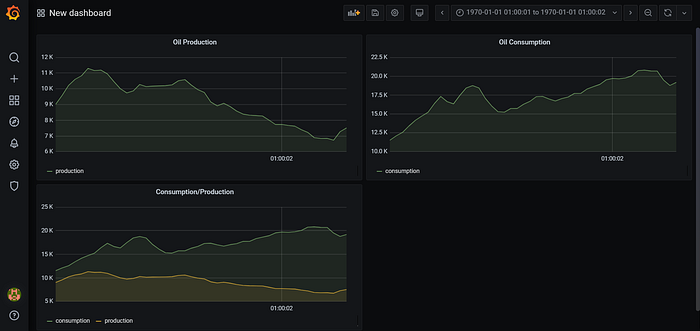
You can incorporate multiple graphs in your output by modifying your SQL Query slightly. An example is shown in the below image.

Benefits of Setting Up the Grafana BigQuery Integration
Google BigQuery and Grafana are both popular tools that have their own benefits. You can, however, merge these tools to extract better insights from your company’s data. Setting up the Grafana BigQuery Integration will provide you with the following benefits:
- Grafana’s accessibility and rich feature set make it an ideal tool for visualizing your Google BigQuery data. Moreover, you can customize its interface, by using simple drag and drop tools, to match your business needs. Its configuration is done in such a way that everyone in your team can access it easily. This implies, everyone in your company can track application performance by simply accessing the Grafana Dashboard once your Grafana Bigquery Integration is in place..
- Using Grafana you can visualize your BigQuery data in numerous formats such as Line Graph, Bar Graph, Pie Charts, Histograms, and many more. The choice of output depends on your business needs. Furthermore, this tool is open source. This implies it allows all possible Data Sources via custom plugins. So all you have to do is set up a BigQuery Plugin and your Grafana BigQuery Integration will be ready.
- The Grafana BigQuery Integration allows you to use all the Grafana Dashboards repeatedly. Not only do you share your great Dashboards with your workforce, but you can also modify them to suit a different project. Moreover, Grafana allows you to create custom scripts to automate the process of Dashboard creation. this is beneficial if you need multiple Dashboards frequently.
Conclusion
This article introduced you to Grafana and Google BigQuery, along with their key features. It also listed the different steps required to set up the Grafana BigQuery Integration. The article further discussed the steps using which you can use Grafana to visualize your data. Furthermore, it explained the various benefits that your business can experience by setting up the BigQuery Grafana Integration.
Looking for a way to seamlessly migrate data from various sources to data warehouses like BigQuery? Try Hevo! It offers a no-code, automated data pipeline solution that not only migrates your data but also enriches it for analysis. With 150+ integrations, real-time data replication, and a user-friendly interface, Hevo makes data management effortless. Connect with us today to improve your data management experience and achieve more with your data.
FAQ
How do you connect Grafana to BigQuery?
To connect Grafana to BigQuery, install the BigQuery plugin for Grafana, configure your Google Cloud credentials, and set up the data source by providing the BigQuery project, dataset, and authentication details in the Grafana settings.
What are the benefits of using Grafana with BigQuery?
Using Grafana with BigQuery offers real-time visualization, flexible dashboards, and advanced analytics for large datasets. It provides powerful monitoring, alerting, and reporting features, making it easier to gain insights from complex BigQuery data.
How do you visualize BigQuery data in Grafana?
Once connected, create a new dashboard in Grafana, select BigQuery as the data source, and write SQL queries to fetch the data. Use Grafana’s visualization tools, like time series graphs, bar charts, and tables, to display the data from your BigQuery queries.

Share it with your connections.
-
 Share To X
-
 Share To LinkedIn
-
 Share To Facebook
-
 Copy Link


