Key takeaways:
Top 5 MongoDB ETL tools with their best use case:
- Hevo Data: Real-time MongoDB replication and ETL
- MongoSyphon: Open-source ETL with change data capture
- Transporter: Scheduled, reliable MongoDB data transfers
- Krawler: Lightweight ETL with geospatial support
- Panoply: Analytics-ready MongoDB data with transformations
Struggling to extract value from your MongoDB data?
With businesses generating data at an unprecedented pace, your datasets must be accessible, structured, and actionable.
MongoDB ETL tools help you move data from MongoDB to analytics platforms, reporting tools, or other databases, ensuring it’s clean, structured, and ready for action.
However, choosing the wrong tool can lead to slow pipelines, errors, and wasted resources, while the right tool can streamline processes, enhance insights, and support data-driven decision-making.
In this guide, we’ll dive into the 12 best MongoDB ETL tools to consider in 2025. Understand their key features, pricing models, and pros & cons to pick the right tool for your MongoDB workflows.
Table of Contents
What Are the Types of MongoDB ETL Tools?
Like other data management solutions, MongoDB uses various ETL tools.
- Cloud-based SaaS is available through a monthly subscription model.
- On-premises software solutions.
- PaaS (Platform as a Service) is an ETL tool offering comprehensive data integration services for MongoDB.
Cloud-based PaaS and SaaS are the most frequently used options due to their scalable pricing models and the ability to manage resources off-premises.
Hevo is one of the best ETL tools for MongoDB, providing a seamless and efficient way to extract, transform, and load data from MongoDB to various destination databases/warehouses. It simplifies the entire data pipeline process, ensuring that your data is ready for analysis and reporting.
Here is how Hevo can be of help:
- No-Code ETL: Set up ETL pipelines for MongoDB without writing any code, making it accessible to users of all skill levels.
- Real-time Data Sync: Continuously sync MongoDB data to your target destination in real time, ensuring up-to-date insights.
- Automated Schema Detection: Automatically detects and adapts to schema changes in MongoDB, reducing manual effort.
- In-Transit Data Transformation: Customize and transform your MongoDB data on-the-fly to meet your destination’s requirements.
Hevo stands out as a top choice for ETL, providing a powerful, user-friendly platform that automates and streamlines the data pipeline, enabling businesses to unlock the full potential of their MongoDB data.
Try Hevo as a MongoDB ETL Tool for FreeThe Best MongoDB ETL Tools
Here’s a quick comparison table of the 12 tools to highlight their best use case:
| Tools | Best for |
| Hevo Data | Real-time MongoDB replication and ETL |
| MongoSyphon | Open-source ETL with change data capture |
| Transporter | Scheduled, reliable MongoDB data transfers |
| Krawler | Lightweight ETL with geospatial support |
| Panoply | Analytics-ready MongoDB data with transformations |
| SYNC | Incremental MongoDB replication to relational DBs |
| Pentaho | Visual drag-and-drop MongoDB pipelines |
| Stitch Data | Easy setup with native MongoDB connector |
| Fivetran | Automated, fault-tolerant MongoDB pipelines |
| Airbyte | Prebuilt connectors with real-time monitoring |
| Matillion | Cloud ETL with schema drift handling |
| Airflow | Python-based workflows with flexible scheduling |
1. Hevo Data

Hevo Data is a no-code data pipeline platform designed to simplify ETL for MongoDB and other data sources. It allows you to extract, transform, and load MongoDB data into warehouses or analytics tools without writing a single line of code.
With support for 150+ integrations, Hevo enables you to replicate MongoDB data in near real-time alongside SaaS apps, databases, file storage, and streaming sources. Its fault-tolerant architecture ensures reliable pipelines that handle billions of events smoothly.
Hevo stands out for its real-time MongoDB replication, ensuring your data is always up-to-date for reporting and analytics. It supports schema management and automatic transformations, so you don’t need manual intervention to clean or restructure MongoDB collections.
Check out what makes Hevo amazing:
- Reliability at Scale – With Hevo, you get a world-class fault-tolerant architecture that scales with zero data loss and low latency.
- Monitoring and Observability – Monitor pipeline health with intuitive dashboards that reveal every stat of pipeline and data flow. Bring real-time visibility into your ELT with Alerts and Activity Logs.
- Auto-Schema Management – Correcting improper schema after the data is loaded into your warehouse is challenging. Hevo automatically maps source schema with destination warehouse so that you don’t face the pain of schema errors.
- Incremental Data Load: Hevo allows the transfer of data that has been modified in real-time. This ensures efficient utilization of bandwidth on both ends.
All of this combined with Hevo’s pricing and 24×7 support makes us the most loved data pipeline software on review sites.
Pricing:
- Starts as a free tier with limited connectors up to 1 million events
- Starter: $239/month up to 5 million events
- Professional: $679/month up to 20 million events
- Business: Custom pricing
Pros
- User-friendly Design
- Change Data Capture
- Reverse ETL
- Plug-and-play Connectors
2. MongoSyphon

When it comes to choosing a MongoDB ETL tool, you cannot miss out on MongoSyphon. It is a specially designed ETL tool to transform data into Mongo document structure. It can read and extract data from RDBMS tables, convert into JSON documents, XML output, or write directly onto the MongoDB.
MongoSyphon does its data join works internally in case the underlying database doesn’t provide any support or in a situation where it needs to merge data from various sources.
Once the extraction and transformation jobs are completed, MongoSyphon loads the data into MongoDB using native document upload methods. This is the main difference between MongoSyphon and other tools, as they are mainly designed to work with relational structures. But with MongoDB, it can either be used for bulk conversion or even for scheduled updates as well.
Even though there is no specific CDC (Change Data Capture) features available in MongoSyphon, it can accomplish it using SQL queries or utilize change tables to capture changed data from external CDC.
Key features:
- Open-source: The open-source model empowers users to inspect, extend, or customize the tool for specific use cases. Developers can plug in custom transformations or connectors to support new source or target schemas.
- Replication: MongoSyphon supports both full initial data loads and incremental updates (via Change Data Capture) from relational databases into MongoDB. You can replicate structured data into document form and keep MongoDB in sync with the source over time.
Mapping logic: Define mapping rules to flatten or embed relational data into document shape. You can adapt column names, join multiple tables, or transform relational rows into a nested JSON structure suitable for MongoDB
Pricing
MongoSyphon is open source and completely available for free.
Pros
- Enhanced performance levels with high speed and greater availability
- Simplicity in usage and quick setup in various environments
- Flexibility, particularly with features like sharding and scalability
Cons
- MongoSyphon has no GUI. So you need to know SQL very well.
- Since it is an early stage tool, it is not well tested enough.
- It has limited error handling.
3. Transporter

Next in our list of the best tools for MongoDB is Transporter, an open-source tool developed by Compose. It helps in extracting data from various data sources using adaptors. For MongoDB, the adaptor provided by Transporter comes with dual functionality as it can either read or write to a MongoDB database. The adaptors work by converting the data extracted into JSON documents and data transfer admins can easily work with the data during the data transfer process.
Transporter comes with abilities to allow users to configure multiple adaptors to various data sources including databases, excel sheets, files, and other types of sources.
Key features:
- Scheduled transfers: With built-in cron-based scheduling, Transporter can run ETL jobs at defined intervals. This ensures MongoDB data is regularly synced without manual intervention.
- Reliability: Transporter only deletes source data after successful transfer to the target. Even if a job fails mid-transfer, MongoDB data remains protected, ensuring reliable ETL pipelines.
- Extensible architecture: Adding support for new databases is straightforward via adapters. The tool can handle diverse MongoDB ETL needs across multiple systems, and developers can scale pipelines without complex reconfiguration.
Pricing:
The platform is free.


4. Krawler
Krawler is another open-source ETL tool available for MongoDB created and maintained by Kalisio. The main purpose behind Krawler is to allow people to connect to sources containing geospatial and geographic content, extract them and convert into a format suitable for loading into MongoDB.
One of the important features of Krawler is that the time taken to extract data from geospatial data sources is very much less compared to other tools. Krawler only supports data sources supported by MongoDB, hence it is one of the highly recommended tools for ETL process. It also comes with detailed documentation to help the user understand the ETL process quickly.
Key features:
- Lightweight ETL: Krawler is designed as a lightweight ETL tool, making it easy to set up MongoDB pipelines without heavy infrastructure. Its minimal design ensures faster deployments and simpler maintenance.
- Geospatial data support: Krawler natively handles geospatial data in MongoDB, allowing you to extract, transform, and load GeoJSON and other location-based datasets.
- Integration with multiple destinations: Krawler supports loading data to databases, file systems, and cloud storage, making MongoDB data accessible for analytics, reporting, or BI tools.
Pricing
Krawler is open-source and is completely free.
Pros
- A minimalist ETL tool that automates the process of extracting and processing data
- Open and extensible to take benefits of the existing functions and add your own operations to them.
- Web orientation becomes easy
5. Panoply

Panoply is rated highly amongst the best paid ETL tools in the market. When compared to other tools, Panoply is a bit unique as it not only provides a platform to run your MongoDB ETL processes but also provides a cloud data warehouse too. Hence, you have a wide range of options for importing data not only from MongoDB but also from various other data sources. Another highlight of using Panoply is that you don’t need to define the schema of the data warehouse before the data extraction process.
Key features:
- Built-in data transformation: Panoply allows you to clean, join, and structure MongoDB collections before analysis. You can apply transformations directly within the platform instead of relying on external tools.
- Analytics ready: Once ingested, MongoDB data in Panoply is queryable with SQL, making it accessible to analysts without MongoDB expertise. Teams can run reports and dashboards without worrying about database complexity.
- Scalability: Panoply’s architecture scales automatically to handle large MongoDB datasets. Whether it’s millions of records or billions of events, pipelines remain stable and fast.
Pricing:
Panoply offers pricing in three levels:
- Lite: $1550 per month for 20 million rows per month.
- Standard: $2498 per month for 100 million rows per month.
- Premium: $3798 per month for 300 million rows per month.m $200 – $995.
Pros
- Easy to use platform
- Time-saving on data engineering
- Flexibility in connection with multiple data sources
Cons
- Difficulties with integrations
- Slow support response time
- High pricing


6. SYNC

The next MongoDB ETL tool in our list is SYNC, an open-source tool that is specially designed to provide data migration between various data sources and MongoDB. Even though it is specifically tested with MySQL and Oracle, the developers of SYNC claim that this tool is capable of working with any SQL database.
SYNC comes included with a GUI interface that makes it quite easy for MongoDB ETL admins to map different data sources. Other highlights of this ETL tool includes that it sends out email notifications on data migration completion along with a detailed summary.
Key features:
- Schema mapping: SYNC automatically maps MongoDB collections and documents into relational tables, reducing manual work. Teams maintain data consistency and simplify downstream ETL processes.
- Data transfer: Instead of reloading entire collections, SYNC captures and transfers only incremental changes. It is particularly useful for handling large MongoDB datasets efficiently.
- Real-time capabilities: SYNC enables seamless replication of MongoDB collections into relational databases like MySQL or PostgreSQL. Data stored in MongoDB is always available for SQL-based queries and analytics.
Pricing
SYNC is open-source.
Pros
- User-friendly interface
- Failure notification
- Detailed summary report
Cons
- Dedicated admin
7. Pentaho

Last, but not least, Pentaho is a MongoDB ETL tool provided by Hitachi, the Japanese multinational company. Hitachi Ventara provides ETL tools both as a free, open-source version as well as a paid version too. When compared to the paid version, the features will be considerably lesser in the free version. The Pentaho platform offers users a 30-day trial period to test the product. It can be either tested with a downloaded version or users can try the business analytics platform online itself without any download.
The platform promises to offer a one-stop solution for all your data analysis requirements and business analytics needs. Pentaho provides excellent support to MongoDB and has released a detailed manual with instructions on integrating Pentaho with your system. Businesses looking for IoT data analysis can go with Pentaho as it comes equipped with a lot of features in that area.
Key features:
- Native MongoDB integration: Pentaho offers built-in connectors for MongoDB, allowing you to easily extract and load data without complex configurations. Users can move data between MongoDB and relational databases or analytics platforms.
- Drag-and-drop interface: With Pentaho’s drag-and-drop ETL designer, you can build MongoDB pipelines visually, without writing custom scripts. It also speeds up pipeline creation and reduces development time. Suitable for teams with limited coding expertise.
- Data transformation: Pentaho lets you cleanse, enrich, and restructure MongoDB data before loading it into warehouses or BI tools. From schema mapping to aggregation, it simplifies complex transformations.
Pricing:
Pentaho offers flexible, usage-based pricing with various licensing tiers to suit different organizational needs. Their offerings include Starter, Standard, Premium, and Enterprise editions with custom pricing.
Pros
- Wide range of tools and features
- Excellent reporting tool
- Highly accessible data integration model
Cons
- Difficulties with Mondrian-based ROLAP
- Lack of support and guidance for WEKA
- Limited Data Visualization features
8. Stitch

Stitch is an open-source, cloud-first platform designed for the rapid movement of data. It functions as a powerful and robust ETL service. It links all your data sources like MySQL, MongoDB, Salesforce, Zendesk, etc, and replicates those data to a destination of your choice. The benefits of using stitch are you can create faster ETL pipelines, Multiple connectors are available, and it gives high-quality user support
Key features:
- Native MongoDB connector: Stitch provides a dedicated MongoDB connector that enables easy extraction of data directly from your collections. It ensures high-performance replication with minimal setup, allowing teams to focus on insights rather than pipeline maintenance.
- dbt integration: Stitch integrates with dbt to apply business logic and prepare MongoDB data for advanced analytics in a structured way.
- User-friendly interface: The platform is known for its intuitive web interface for setting up pipelines without deep technical expertise. Configuring MongoDB data flows takes just a few clicks, making it accessible to both engineers and analysts.
Pricing:
Stitch uses a usage-based pricing model, where costs are determined by the number of data rows processed and transferred each month.
- Standard: $100 monthly
- Advanced: $1,250 monthly
- Premium: $2,500 monthly00 per month, limited to 5 users per account. Enterprise plans are only provided on a custom-made basis.
9. Fivetran

Fivetran is best suited for enterprises aiming to convert or replicate small amounts of data, facilitating informed, data-driven decision-making. In the majority of data transformation processes, Fivetran uses the best processing capabilities of your existing data warehouse, enabling real-time data updates.
Key features:
- Transformations in SQL: It allows you to apply transformations directly in your destination warehouse using SQL. This simplifies the process of cleaning, joining, or restructuring MongoDB data for analysis.
- Prebuilt connectors: Fivetran features over 700 prebuilt connectors for accelerating pipeline setup. Data can be moved into warehouses like Snowflake, BigQuery, or Redshift in just a few clicks.
- Reliability: Fivetran’s fault-tolerant design processes billions of rows efficiently. High availability ensures MongoDB pipelines run smoothly even under heavy workloads.
Pricing:
Fivetran’s pricing model is based on Monthly Active Rows (MAR), which includes the unique rows inserted, updated, or deleted each month. You can try the platform risk-free with a 14-day free trial.ctual usage.
Pros
- Rapid creation of ETL pipelines
- Availability of numerous connectors
- Excellent user support quality
Cons
- Certain levels of security and data protection compliance assurances are exclusive to enterprise pricing.
- Resetting data pipelines in case of errors can be challenging
- Costs escalate as data integration requirements expand.
10. Airbyte
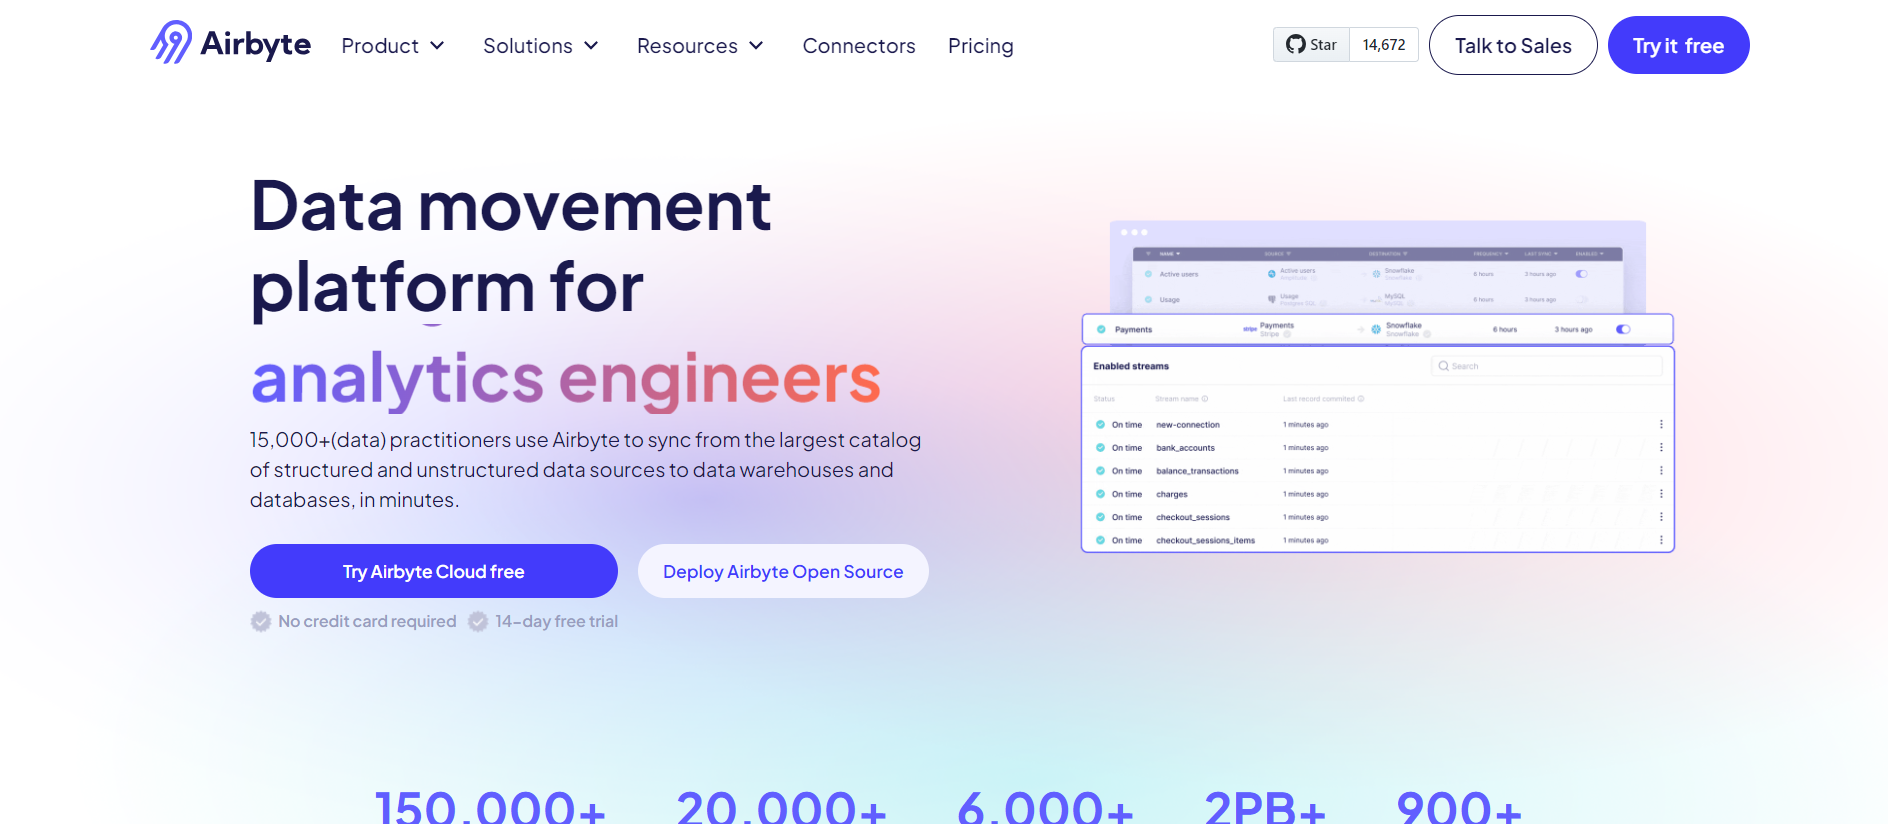
Airbyte, a standout in the ETL landscape, boasts a user-friendly interface and an impressive array of 350+ connectors. Its API and Terraform Provider add further convenience. Airbyte can be run locally, in a Docker container, or a self-hosted cloud environment. As a commercial open-source solution, it offers a fully managed standard and enterprise solution.
Key features:
- Native connector: Airbyte provides a dedicated MongoDB source connector, making it easy to extract documents and fields directly from your database.
- Customizable transformations: Airbyte supports dbt transformations to clean and reshape MongoDB data before loading it into your warehouse or BI tools. This helps standardize semi-structured JSON data and make it analysis-ready.
- Centralized monitoring: Airbyte offers pipeline visibility into sync status, errors, and performance metrics. With alerts and logging, you can troubleshoot MongoDB ETL pipelines quickly and ensure data reliability.
Pricing:
Airbyte offers a free self-hosted plan, a 14-day cloud trial, and scalable Team and Enterprise tiers tailored to different business needs.
Pros:
- Open-Source
- Easy to Use
- Change Data Capture
- Multiple Connectors
Cons:
- Per-credit pricing is a little confusing
- Frequent updates may force users to install new versions often.

11. Matillion

Matillion is one of the best cloud-native ETL tools designed for the cloud. It can work seamlessly on all significant cloud-based data platforms, such as Snowflake, Amazon Redshift, Google BigQuery, Azure Synapse, and Delta Lake on Databricks. Matillion’s intuitive interface reduces maintenance and overhead costs by running all data jobs in the cloud.
Key features:
- Interface: The intuitive, browser-based interface of Matillion allows users to design and manage MongoDB ETL pipelines with ease. Features like drag-and-drop components, visual job orchestration, and real-time data previews simplify the development process.
- MongoDB integration: Matillion offers native support for MongoDB, enabling straightforward extraction of data from MongoDB collections into cloud data warehouses like Snowflake or Redshift.
- Schema management: Matillion addresses schema changes in MongoDB by supporting schema drift and adapting to evolving data structures without manual intervention. It provides flexibility in handling dynamic data models commonly found in MongoDB.
Pricing:
The platform offers a pay-as-you-go model.
Pros:
- Graphical UI and a wide variety of pre-built connectors
- Faster data loading
- Low-maintenance
Cons:
- Difficult to use
- Lacking two-way integrations
- Inefficient for high data volumes and complex transformations
12. Airflow

Apache Airflow is an open-source platform for managing complex data workflows. It was initially developed to meet Airbnb’s data infrastructure needs. Now, the Apache Software Foundation maintains it. Airflow is a popular tool for automating data engineering pipelines. It is widely used by data engineers, data scientists, and DevOps practitioners.
Key features:
- Workflow: Airflow defines ETL pipelines entirely in Python, giving developers full control over MongoDB data workflows. Dynamic DAGs allow parameterized tasks, making it easy to handle complex data transformations.
- Robust scheduling: ETL pipelines can be scheduled to run at precise intervals or triggered manually, ensuring MongoDB data is always up-to-date. Failed tasks can be retried automatically, reducing downtime.
- User interface: The Airflow UI is designed with flexibility in mind, allowing users to customize views, apply filters, and organize DAGs according to specific needs.
Pricing:
Apache Airflow is free and open-source.
Pros:
- A large number of hooks: extensibility and simple integrations
- Full REST API: easy access for third parties
- Open-source
- Integration with Cloud platforms like AWS, GCP, etc.
Cons:
- No versioning of workflows
- Challenging learning curve
- Requires coding/technical knowledge
- Debugging is time-consuming
Explore more about data integration tools and learn how they help streamline data movement across multiple sources and destinations.
How to Choose a MongoDB ETL Tool?
1. Setup
One of the important aspects that you need to consider while choosing a MongoDB ETL tool is how easy and simple it is to set up in your environment. You also need to know the prerequisites you need to install the ETL tool in your system. Some of the general prerequisites for ETL tools like MongoSyphon include having:
- MongoDB configured on Port 27017 with read/write permissions
- MySQL configured on Port 3306 with read/write permissions
- Have both MySQL and MongoDB client applications installed on the same path
2. Complete Monitoring & Management
The next important factor to consider is whether the tool provides features to monitor the ETL process effectively. It needs to have options to create rules for different activities, and every such action needs to be recorded in the database for further analysis. Overall, monitoring the ETL process needs to be made available, and users must be enabled to take reports on various crucial data sets.
3. Multiple Data Sources
Another aspect that needs to be considered while choosing the best tool is that it needs to support the extraction of data from various sources. You don’t need to be stuck with a tool that only comes with limited options in terms of data extraction.
When it comes to data warehousing, you cannot rely on only one data source. Hence, the tool you select for MongoDB needs to be able to work with multiple data sources and connect with various queuing products.
4. Ease of Use
The tool you choose must be easy to understand and use in a quick time. You can’t spend weeks understanding the working and features of the tool. Everything needs to be documented to enable you to understand it quickly so you can start setting up the tool and generate reports in no time.
5. Robust Data Transformation
With companies starting to use the cloud to store their data platform, it is crucial to look for a tool that provides options for a robust data transformation feature after the data is loaded into the database. There are various modeling tools available, like Talend and Data Fabric, or you can use just SQL.
6. Real-Time Data Streaming
We have moved into the age of Big Data, and we can see organizations moving vast amounts of data regularly. But still, sometimes, you need continuous or real-time streaming to get some actionable insights on the data. If you have such requirements, you must look for a tool that supports real-time data streaming.
7. Other Features
Other essential features that you need to look for while choosing an ETL tool that suits your data extraction, transformation, and loading requirements are:
- Number of Integrations
- Flexibility
- End-to-end reliability
- Handle out-of-order data
- Extensive reporting
- Ability to integrate with various data cleansing tools
- Support for scheduling FTP sessions
- Support for OLE DB and OLAP metadata standards
- Learning curve – suitability for beginners
- Stability
Additional Resources on Mongodb ETL Tools
Optimizing MongoDB Workflows
- There are various options available in the market when it comes to MongoDB ETL tools.
- Each has a specific set of features and related pros and cons.
- You can decide the best fit for your requirements by comparing these and finding the right fit.
When it comes to fully managed ETL, you can’t find a better alternative than Hevo. It is a No-code Data Pipeline product that will help you move data from multiple data sources to your destination. It is extremely easy to set up, as you can get the tool up and running in just a few minutes.
FAQ on MongoDB ETL Tools
1. What tools are used for MongoDB?
MongoDB Compass, MongoDB Atlas, Studio 3T, etc, are a few tools used for MongoDB.
2. Is MongoDB suitable for data warehouses?
MongoDB is not well-suited to a traditional data warehouse. Still, the MongoDB data platform sometimes provides enough support for analytics that a data warehouse or a data lake is optional.
3. Which data can you extract from MongoDb?
MongoDB provides access to many data types, including Documents, Collections, Indexes, GridFS, Aggregation, Transactions, Change streams, and others.
4. What is ETL?
ETL is a data integration process divided into three steps: Extract, Transform, and Load. It integrates data from multiple sources and loads it in a centralized location, typically a Data Warehouse, for analytical purposes.
What is your preferred MongoDB ETL tool? Let us know in the comments section below.
Share it with your connections.
-
 Share To LinkedIn
-
 Share To Facebook
-
 Share To X
-
 Copy Link