Table of Contents
Prerequisites
- A Power BI Pro subscription. (Before you begin, sign up for a free trial)
- An R engine. You may get one for free from a variety of sources, including the Revolution Open download page and the CRAN Repository.
- For Windows users, use Windows PowerShell version 4 or later, and for Mac users, use the Terminal.
What is Power BI?
Power BI is a proprietary Data Visualization and Business Intelligence platform from Microsoft Power Platform. It is one of the most widely used business tools for analyzing company data and making reports. Power BI seamlessly connects with data, offering Immersive Visuals, Interactive Reports, and Insights via a variety of built-in software services, apps, and connections.
Users may utilize Power BI to Aggregate, Analyze, Visualize, and Share data. It is a SaaS-based platform with choices for desktop, mobile, and on-premise servers. Connecting to a variety of data source connectors in Power BI allows you to import data from the data source directly into the Dashboard and visualize data housed in databases or data warehouses.
Key Features of Power BI
The following are some of the most important aspects of Power BI.
- Hybridization: Power BI integrates with a myriad of connectors, allowing users to connect to a diverse set of data sources.
- Modeling Point of View: Users of Power BI may divide and slice huge data models into smaller pieces, generate unique diagrams, and choose various things.
- AI Assistance: Users with Power BI Data Analytics may use Artificial Intelligence to prepare data, build Machine Learning models, and swiftly unearth insights from structured and unstructured data.
- Important Takeaways: Power BI makes it easier to create data subsets and apply Data Analytics to that data.
- Report Distribution: Users can quickly share their reports with other members of their company without having to worry about data security.
Hevo simplifies data analytics by automating the process of extracting, transforming, and loading (ETL) data from multiple sources into cloud-based platforms for analysis. What Hevo Offers?
- Fully Managed: Hevo Data is a fully managed service and is straightforward to set up.
- Schema Management: Hevo Data automatically maps the source schema to perform analysis without worrying about the changing schema.
- Real-Time: Hevo Data works on the batch as well as real-time data transfer so that your data is analysis-ready always.
- Live Support: With 24/5 support, Hevo provides customer-centric solutions to the business use case.
What is R?
R is a Statistical Computing and Graphics Programming Language supported by the R Core Team and the R Foundation for Statistical Computing. R, developed by statisticians Ross Ihaka and Robert Gentleman, is used by data miners and statisticians for data analysis and statistical software development. Users have written packages to extend the capabilities of the R language.
R is one of the most often used programming languages in data mining, according to user surveys and examinations of scholarly literature databases.
For several operating systems, precompiled executables are supplied. R includes a command-line interface. Third-party graphical user interfaces, such as RStudio, an integrated programming environment, and Jupyter, a notebook interface, are also available.
Key Features of R
R has a lot of capabilities for data scientists and analytics. These distinguishing characteristics are what set R distinct from the crowd of statistical languages:
- Open Source: R is a free and open-source programming environment. It is free to use and can be altered and adapted to meet the needs of the user and the project.
- Capabilities in Graphic Design: R can generate static graphics with high-quality visualizations and has expanded libraries that enable interactive graphics.
- Active Community: R has an open-source library that is used by a rising number of people.
- Computing That Is Distributed: Tasks are dispersed among numerous processing nodes in distributed computing to minimize processing time and boost efficiency.
- Support for Multiple Platforms: R is not machine-dependent. It allows for cross-platform functioning. As a result, it can be used on a wide range of operating systems.
- Reports can be generated in any format: When working with R, the markdown package is the only report generating package you’ll ever need. The markdown package can aid in the creation of web pages.
- Other Programming Languages Compatibility: While the majority of its functions are written in R, C, C++, or FORTRAN can be utilized for more computationally intensive applications. Object manipulation can also be done directly in Java,.NET, Python, C, C++, and FORTRAN.
How to Create Power BI R Scripts for Efficient Visualizations?
Power BI Desktop automatically activates R after you install it. Follow these steps to ensure that Power BI Desktop has enabled R in the correct location:
- Select File > Options and settings > Options from the Power BI Desktop menu.
- Select R scripting on the left side of the Options page, under Global.
Verify that your local R installation is described in Detected R home directories and that it accurately reflects the local R installation that Power BI Desktop should use.
Here are the steps to get started!
- Power BI R Step 1: In the Visualization tab, click the R Visual Icon
- Power BI R Step 2: Create a plot using the data you choose
- Power BI R Step 3: Execute the script
Step 1: In the Visualization tab, click the R Visual Icon
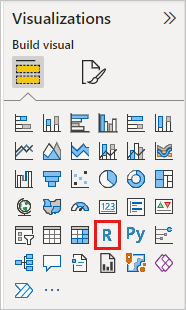
Power BI R Step 1.1: Activate the Script Visualization Window that displays
Power BI Desktop makes the following adjustments when you add an R graphic to a report:
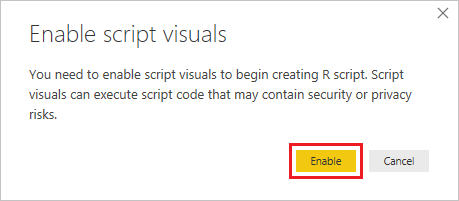
- On the report canvas, a placeholder R visual picture is displayed.
- The R script editor is located at the bottom of the center pane.
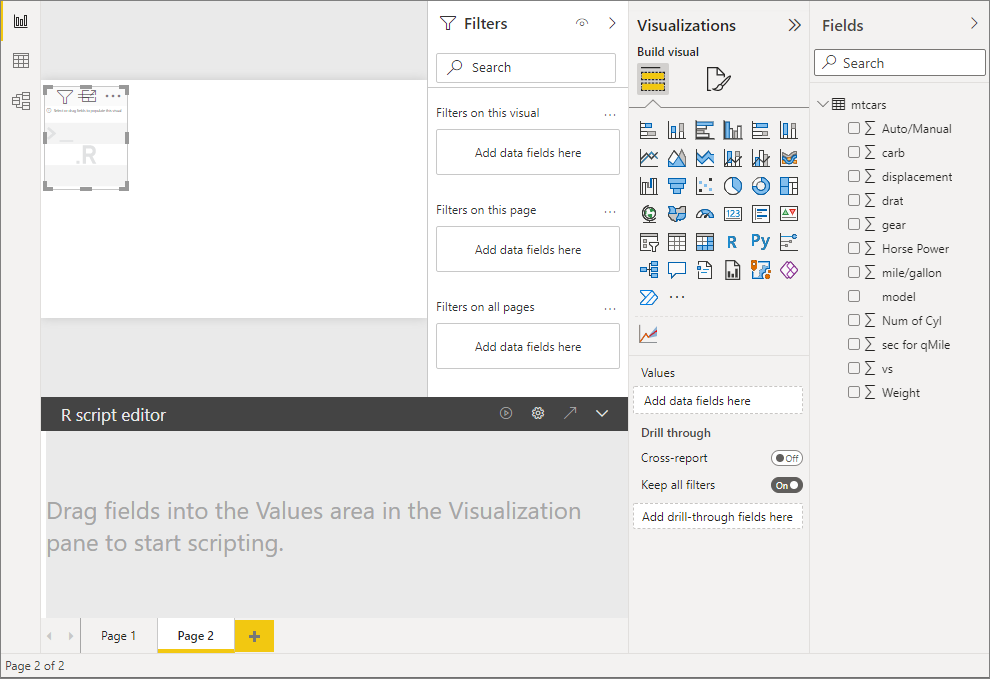
Drag fields from the Fields pane that you wish to consume in your R script into the Values area of the Visualization pane, just like you would with any other Power BI Desktop visual. You can also select the fields directly from the Fields window.
Your R script can only access the fields you’ve added to the Values section. While working on your R script in the R script editor, you can add new fields or remove unnecessary data from the Values section. Power BI Desktop knows which fields you’ve added or removed automatically.
Step 2: Create a plot using the data you choose
The R script editor generates supporting R script binding code for the fields you pick in the grey box along the top of the editor pane as you select them.
When you remove a field, the R script editor removes the accompanying code for that field as well.
- Make a dataset data frame out of the various fields selected by the user.
- Do not summarise is the default aggregate.
- Fields are arranged similarly to table visuals, and duplicate rows appear just once.
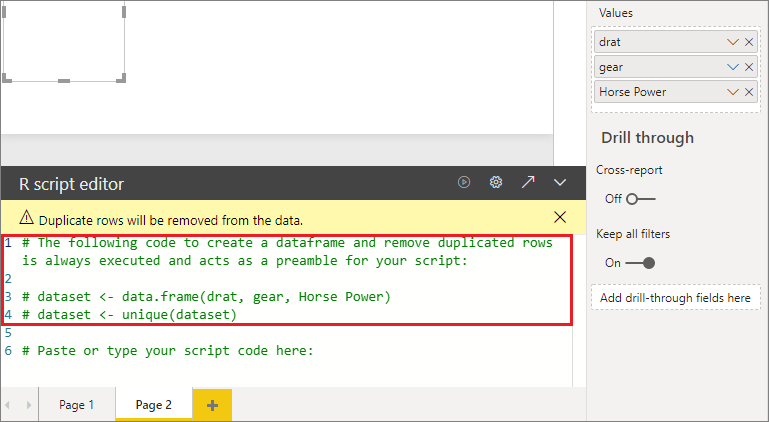
The resulting data frame is called a dataset, and you can access individual columns by their names. To access the gear field, for example, add dataset$gear to your R script. Use single quotes for fields that contain spaces or unusual characters.
Step 3: Execute the script
With the dataframe generated automatically by the fields you chose, you’re ready to build an R script that Power BI Desktop plots to the R default device. After you’ve finished the script, click the Run script icon in the R script editor title bar.
When you click the Run script button, Power BI Desktop recognizes the plot and displays it on the canvas. Because the process is run on your local R installation, ensure that all necessary R packages are installed.
When any of the following events occur, Power BI Desktop redraws the visual:
- From the R script editor’s title bar, click the Run script icon.
- A data change occurs when data is refreshed, filtered, or highlighted.
The figure below provides an example of the correlation plot code, which plots the correlations between several types of automotive attributes.
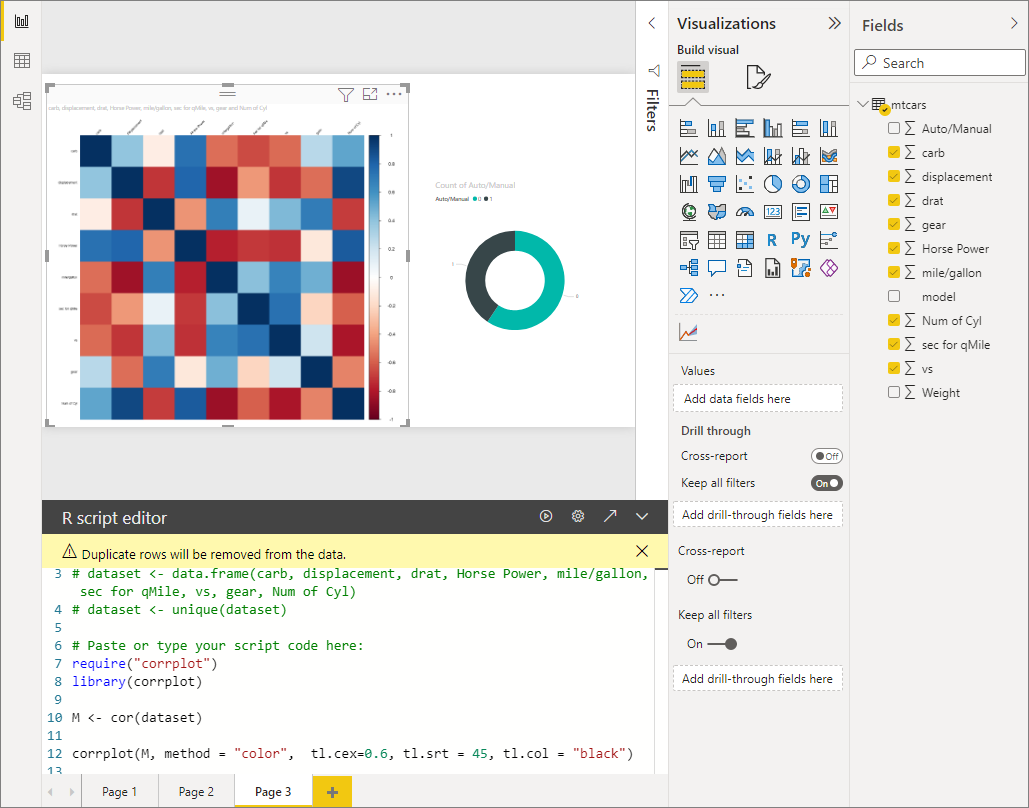
Deselect the R visual or reduce the R script editor to get a better look at the visualizations. You may cross filter the correlation plot, like other Power BI Desktop visuals, by selecting a specific value, such as Auto or Manual, in the donut chart visual on the right.
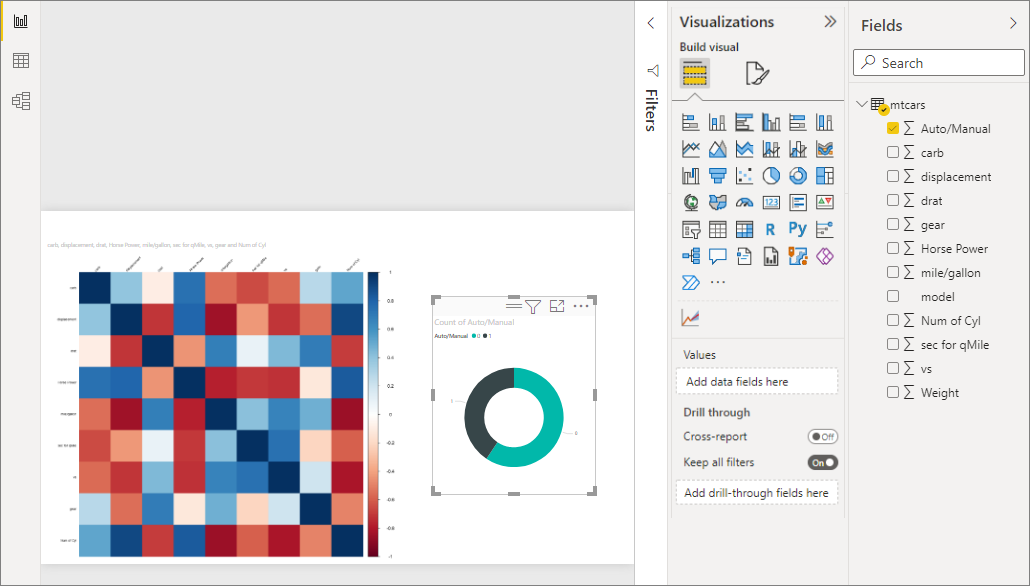
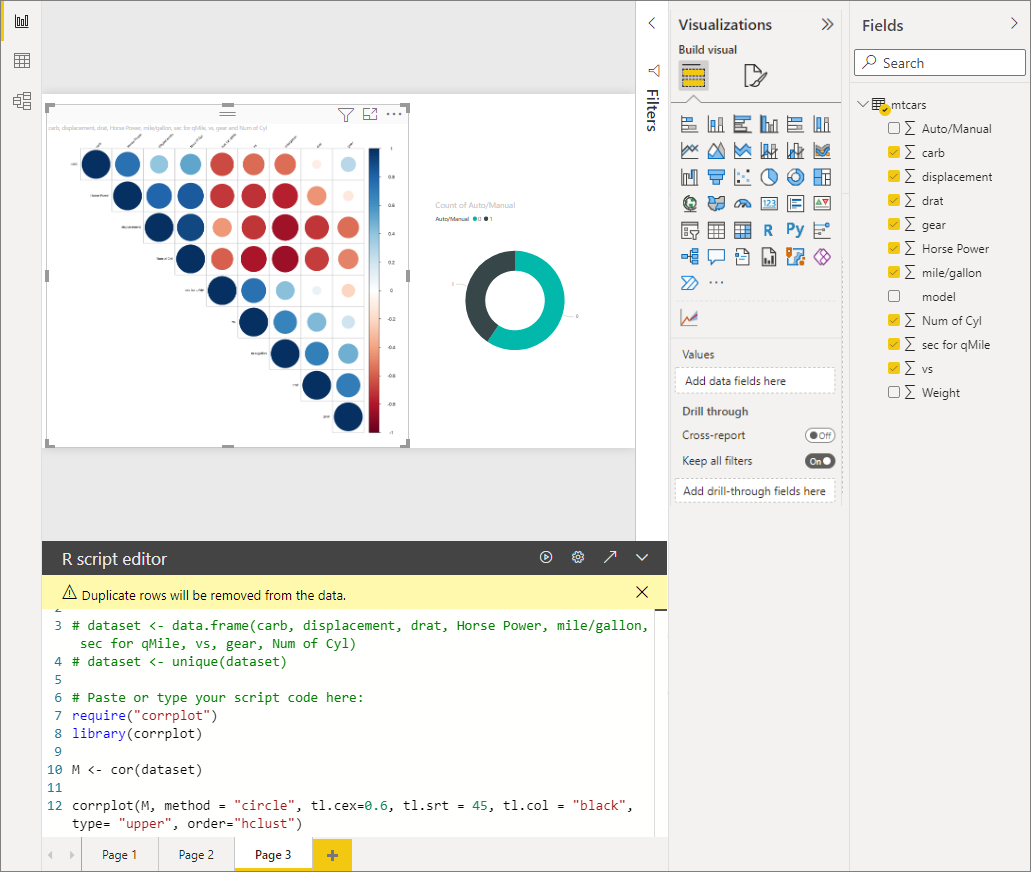
- Customize the look by modifying the R script and leveraging R’s capability by adding arguments to the plotting command.
corrplot(M, method = "color",  tl.cex=0.6, tl.srt = 45, tl.col = "black")

corrplot(M, method = "circle", tl.cex=0.6, tl.srt = 45, tl.col = "black", type= "upper", order="hclust")- As a result, the R visual now show circles, evaluates only the upper half of the matrix, and reorders it to cluster correlated features.
When you run an R script that fails, an error message appears on the canvas instead of the R visual plot. Select See details from the R visual error for more information on the error.
Limitations of Power BI R Visuals
The following are the limitations of R visualizations in Power BI Desktop:
- Sizes of data: The amount of data that can be plotted by an R visual is restricted to 150,000 rows. If more than 150,000 rows are chosen, just the top 150,000 are used, and a message appears on the image.
- Size of output: The output size of R visual is limited to 2MB.
- Resolution: R graphics are all displayed at 72 DPI.
- Plotting machine: Plotting to the default device is the only option.
- Time to compute: If an R visual calculation takes longer than five minutes, a time-out error occurs.
- Relationships: An issue occurs if data fields from various tables with no established relationship between them are selected, as with other Power BI Desktop graphics.
- Refreshes: R graphics are refreshed as data is updated, filters are applied, and highlights are highlighted. However, because the image is not interactive, it cannot be used as a source of cross-filtering.
- Highlights: R visuals respond when other visuals are highlighted, however, you can’t choose elements in the R visual to cross filter other elements.
- Display gadgets: Only plots plotted to the R default display device are correctly displayed on the canvas. Avoid using a different R display device explicitly.
- Installations of RRO: The 32-bit version of Power BI Desktop does not automatically detect RRO installations in this edition; you must manually enter the path to the R installation directory in Options and settings > Options > R Scripting.
Conclusion
The inclusion of the R programming language in Power BI Desktop creates a strong tool for altering and displaying business intelligence data. R is a statistical computing and graphics language that is widely used and has a big and active user community.
R can be used with Power BI Desktop to import and alter data as well as build a variety of visuals that provide in-depth insights into the data. Those who are already familiar with R will find that using R with Power BI Desktop is a quick and uncomplicated approach. Even individuals who are unfamiliar with R may find it worthwhile to experiment with the Power BI Desktop R features.
Hevo Data, a No-code Data Pipeline provides you with a consistent and reliable solution to manage data transfer between a variety of sources and a wide variety of Desired Destinations with a few clicks.
Want to give Hevo a try? Sign Up for a 14-day free trial and experience the feature-rich Hevo suite firsthand. You may also have a look at the amazing price, which will assist you in selecting the best plan for your requirements.
Share your experience of Running Power BI R Scripts To Create Visuals in the comment section below! We would love to hear your thoughts.
FAQs
1. What is the use of R in Power BI?
R in Power BI enables advanced data analytics, visualization, and custom calculations by leveraging R scripts and libraries directly within reports and dashboards.
2. How do I connect to an R script in Power BI?
Use the “Get Data” option, select “R Script,” paste your R code, and load the data. Ensure R is installed on your machine for execution.
3. Are R visuals in Power BI interactive?
No, R visuals are static and do not support interactivity. However, they can display advanced custom visualizations tailored to complex data scenarios.


