Microsoft Power BI is an Interactive Data Visualization software solution with a significant focus on Business Intelligence. Power BI is a set of software services, applications, and connections that work together to transform disparate data sources into cohesive, visually engaging, and interactive insights.
You can connect to the world of data with Power BI Desktop, generate compelling and foundational reports, and share your efforts with others – who can then build on your work and expand their business intelligence efforts.
Power Query is a Data Connectivity and Data Preparation Tool that allows users to import and reshape data from a variety of Microsoft products, including Excel, Power BI, Analysis Services, Dataverse, and others.
In this post, you’ll also find information on connecting to data, influencing data, and getting started with Power Query Power BI.
Table of Contents
What is Power BI?
Power BI is a Microsoft Power Platform proprietary Data Visualization and Business Intelligence platform. It is one of the most extensively used business tools for evaluating and reporting on company data. Power BI links to data smoothly, providing Immersive Visuals, Interactive Reports, and Insights through a number of built-in software services, apps, and connectors.
Power BI allows users to Aggregate, Analyze, Visualize, and Share data. It is a SaaS-based platform featuring desktop, mobile, and on-premise server options. Connecting to a range of data source connectors in Power BI allows you to import data straight from the Data Source and Visualize data stored in Databases or Data Warehouses.
Turn your data into stunning insights with Power BI’s powerful visualizations! Let Hevo simplify your data integration journey, delivering accurate, real-time data to Tableau effortlessly—making your analytics seamless and impactful every time. With Hevo:
- Transform your data for analysis with features like drag and drop and custom Python scripts.
- 150+ connectors (including 60+ free sources).
- Eliminate the need for manual schema mapping with the auto-mapping feature.
Try Hevo and discover how companies like EdApp have chosen Hevo over tools like Stitch to “build faster and more granular in-app reporting for their customers.”
Get Started with Hevo for FreeKey Features of Power BI
The following are some of Power BI’s most notable features.
- Hybridization: Power BI interfaces with a wide range of connectors, allowing users to connect to a wide range of data sources.
- Point of View on Modeling: Power BI users may break and slice large data models into smaller bits, create distinctive diagrams, and select multiple options.
- Assist from AI: Users of Power BI Data Analytics may utilize AI to prepare data, develop Machine Learning models, and quickly uncover insights from organized and unstructured data.
- Important Points to Remember: Power BI simplifies the creation of data subsets and the application of Data Analytics to that data.
- Report Dissemination: Users can easily share their reports with other members of their firm without worrying about data security.
What is Power Query in Power BI?
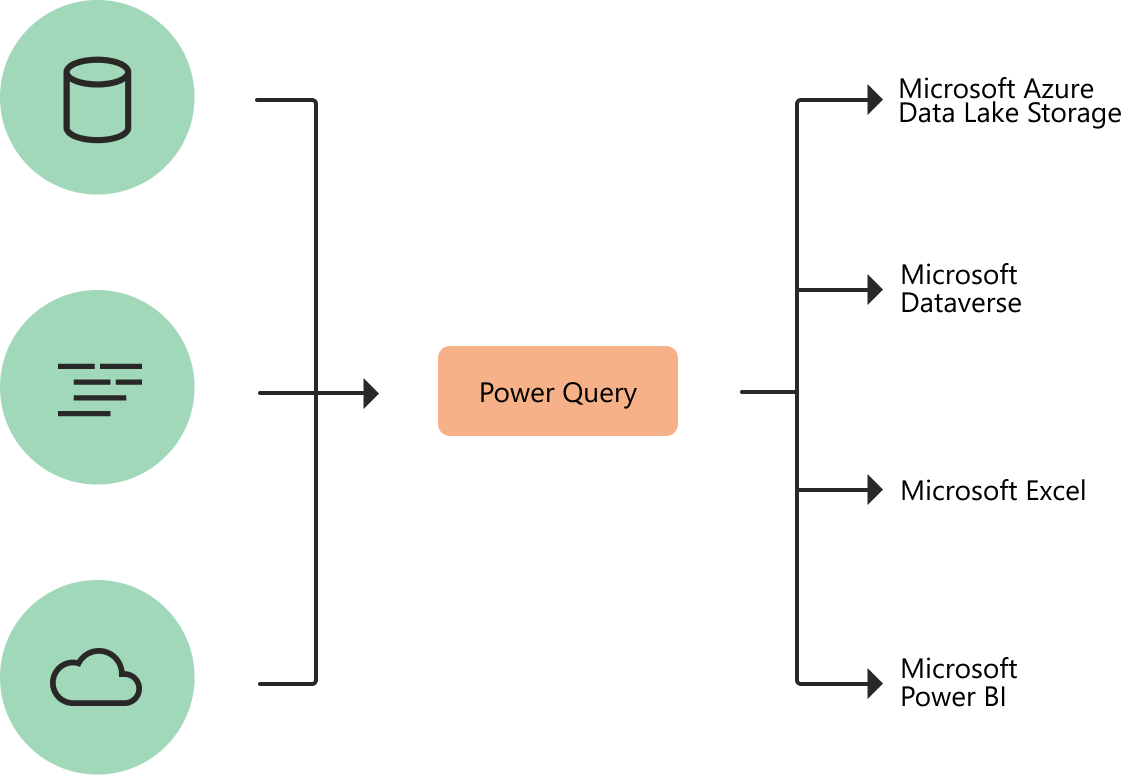
Power Query is a Data Transformation and Data Preparation tool included with Microsoft Excel and Microsoft Power BI. Power Query streamlines the process of importing data from a variety of file types including Excel tables, CSV files, Database tables, Webpages, and so on, and allows you to transform your data into the proper shape and condition for better analysis.
Once you’ve configured your Power Query procedures, you won’t have to repeat the same steps with new data. You can quickly set up and automate the same data transformation procedures and produce the same data outputs with Power Query.
Microsoft Power BI’s Power Query feature allows you to do sophisticated data transformations such as:
- Removing any extraneous columns, rows, or blanks
- Conversions of data types – text, numbers, and dates
- Columns can be split or merged.
- New computed columns are being added.
- Data aggregation or summarization, among other things.
Key Features of Power Query
The following are some of Power Query’s most notable features.
- Connectivity to a variety of Data Sources: Power Query has been designed to export data from a variety of sources, including but not limited to text files, Excel Workbooks, and CSV files.
- Combining Tables: The Merge option in Power Query replaces Excel’s VLOOKUP function. The latter is a handy method for looking up corresponding values, but it gets slightly problematic when applied to a huge dataset with thousands of rows.
- Tables for Combining: When modifications to the same source data must be imported at regular periods, say, every week or month, manually ensuring data replication becomes onerous.
- Make Your Own Functions: Power Query was created in such a way that you do not need to know how to code to utilize it. It is really simple to use because you simply click buttons and apply filters as you would in Excel.
- Power Query keeps track of your actions and automates processes: Power Query not only makes all of these activities easier but also logs your steps so you don’t have to repeat them. If you prepare the same data every day, week, or month, it will save you a lot of time.
Power Query Power BI Overview
Power BI is a whole distinct program that includes Power Query. It has more connection possibilities than Excel’s Power Query. It also features improved graphics and can publish to the Power BI Service for easier report sharing. You’ll also find information on connecting to data, influencing data, and getting started. Let’s look at the Power Query Editor.
- Power Query Editor
- The Query Tab
- The Inquiries Pane on the Left
- The Data Pane in the Center
- The Query Settings Pane on the Right
- Advanced Editor
- Saving your Work
1) Power Query Editor
To access Power Query Editor, go to the Home tab of Power BI Desktop and click Transform data.
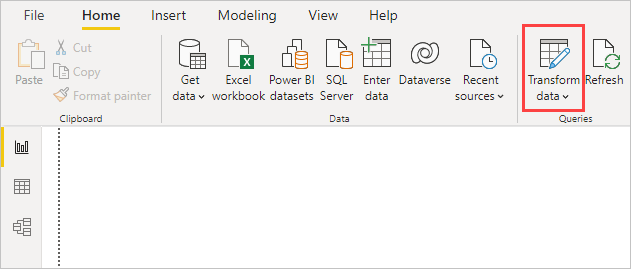
When there are no data connections, Power Query Editor displays as a blank window, ready to be filled with data.
The Power Query Editor window becomes more intriguing as a query is loaded. When we connect to the following Web data source, Power Query Editor loads data information, which you can then shape:
Here’s how Power Query Editor looks once you’ve made a data connection:
- Many buttons in the ribbon are now active to interact with the data in the query.
- Queries are listed in the left pane and can be selected, viewed, and shaped.
- The data from the selected query is shown and ready for shaping in the center pane.
- The Query Settings window displays, listing the query’s properties and steps that have been applied.
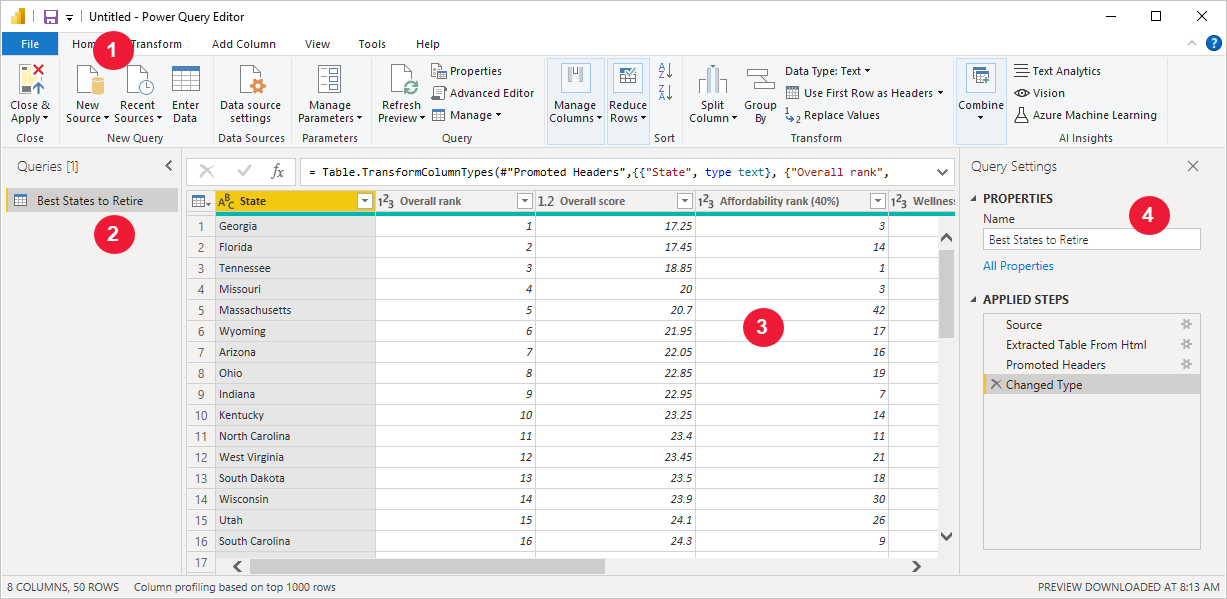
We’ll look at the ribbon, the Queries pane, the Data view, and the Query Settings pane in turn.
2) The Query Tab
Power Query Editor’s ribbon is divided into four Tabs: Home, Transform, Add Column, View, Tools, and Help.
The common query tasks are located on the Home tab.

Select New Source to connect to data and begin the query-building process. A menu with the most frequent data sources is shown.
The Transform tab gives you access to popular data transformation activities like:
- Columns can be added or removed.
- Modifying data types
- Column division
- Other data-driven tasks include

Many of the functions available from the ribbon can also be accessed by right-clicking a column or other data in the center pane.
3) The Inquiries Pane on the Left
The left pane, or Inquiries Pane, shows the number of ongoing queries as well as the query name. When you select a query from the left pane, the data for that query is displayed in the center pane, where you may shape and change it to match your needs. The image below depicts the left pane with a query.
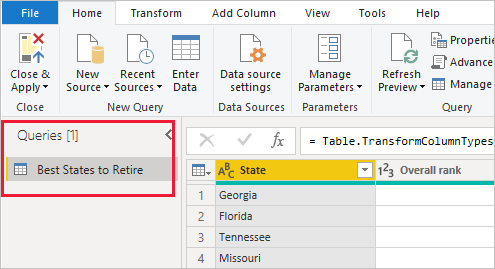
4) The Data Pane in the Center
The Data from the selected query is displayed in the center pane, also known as the Data Pane. This Pane is where the Query view does the most of its work.
The graphic below depicts the previously established Web Data connection. The Overall score column has been selected, and its heading has been right-clicked to see the available menu selections. Many of these right-click menu choices are identical to buttons in the ribbon tabs.
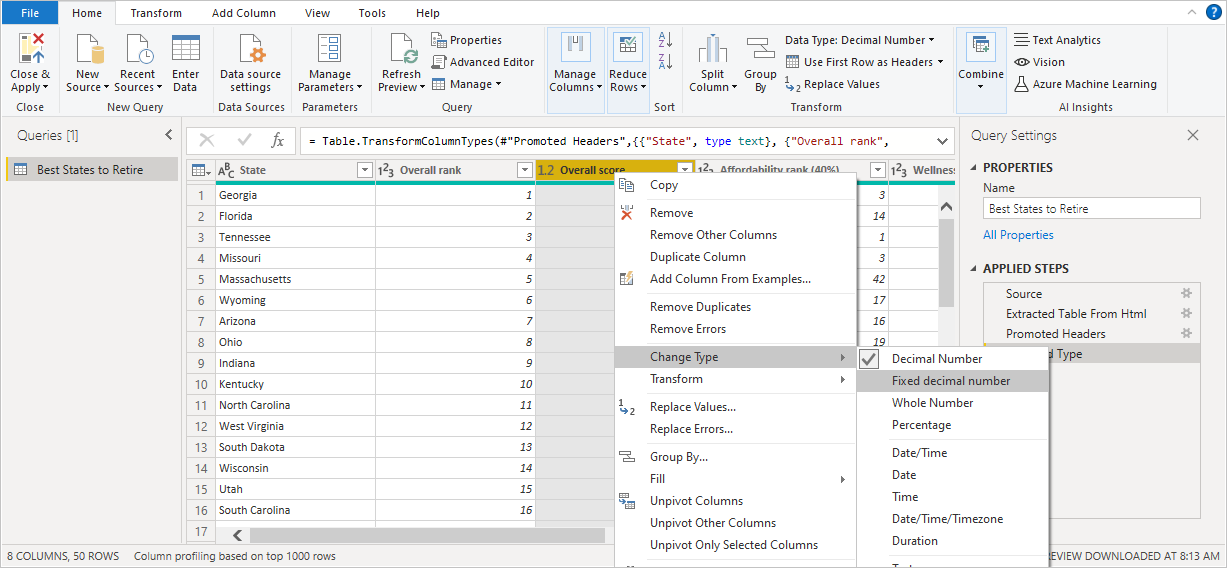
The query applies the step to the data when you select a right-click menu item (or a ribbon button). It also saves steps as a query parameter. The steps are recorded in the Query Settings pane in the order stated in the next section.
5) The Query Settings Pane on the Right
The Right Pane, also known as the Query Settings Pane, displays all steps related to a query. For example, the Applied Steps area of the Query Settings pane in the accompanying image shows the fact that we just modified the type of the Overall score column.
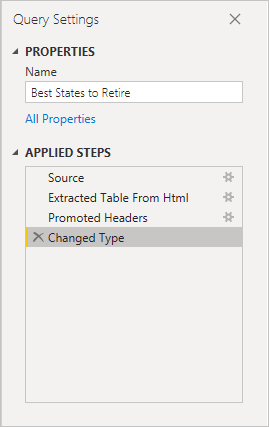
Additional shaping steps are documented in the Applied Steps section when they are applied to the query.
It is critical to understand that the fundamental data is not altered. Power Query Editor, on the other hand, modifies and forms its perspective of the data. It also shapes and alters the view of any interaction with the underlying data that occurs as a result of the shaped and updated view of that data provided by Power Query Editor.
You can rename, delete, or reorder steps in the Query Settings window as you see fit. To do so, right-click the step in the Applied Steps section and select the appropriate option from the menu that appears. All query steps are executed in the order in which they appear in the Applied Steps window.
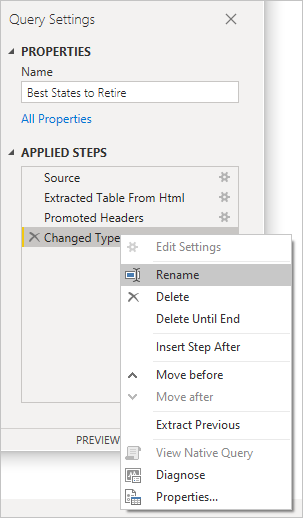
6) Advanced Editor
The Advanced Editor displays the code that Power Query Editor generates at each step. You can also write your own shaping code. To access the advanced editor, choose View from the ribbon, then Advanced Editor. A popup appears, displaying the current inquiry code.
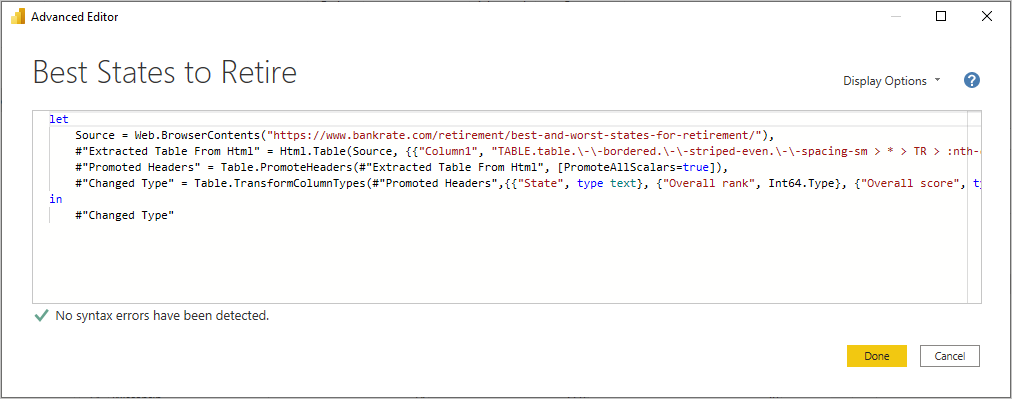
In the Advanced Editor window, you can directly alter the code. Select the Done or Cancel button to close the window.
7) Saving your Work
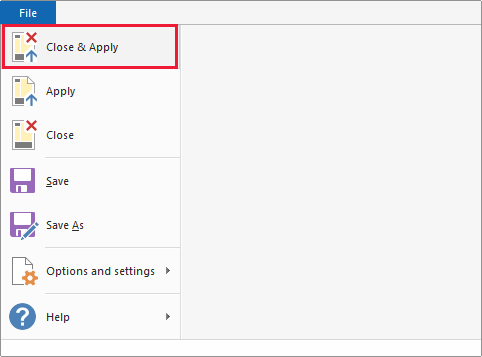
When your query is where you want it, choose Close & Apply from the File menu in Power Query Editor. This action saves your changes and exits the editor.
As progress is achieved, Power BI Desktop displays a status dialogue.
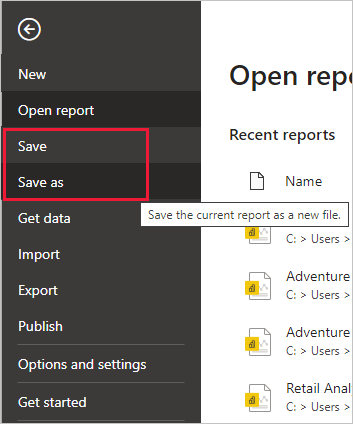
When you’re finished, Power BI Desktop can save your work as a .pbix file. To save your work, go to File > Save (or File > Save As), as seen in the image below.
How to Access Power Query Help in Power BI Desktop?
- There’s a Help tab in the Power Query editor running on Power BI Desktop, but at this time, all of the options go to locations that supply Power BI information.
- You can also reach this same Power BI Help information in the Power Query editor in Power BI Desktop by selecting File > Help and then selecting one of the help options.
- The Power Query Help tab contains links to important sources of information about Power Query.
- The options in the help tab include links to:
- Power Query documentation: Links to the Power Query documentation
- Keyboard shortcuts: Links to the keyboard shortcuts article in the Power Query documentation.
- Support: Links to the support website of the Microsoft product that Power Query is currently running.
- Power Query website: Links to the Power Query website.
- Power Query blog: Links to the Power Query blog.
- Power Query community: Links to the Power Query community.
- Submit an idea: Links to the ideas website of the Microsoft product that Power Query is currently running.
- Send feedback: Opens a window in Power Query. The window asks you to rate your experience with Power Query and to provide any additional information you would like to supply.


What are the Benefits of Power Query Power BI?
Here is a list of benefits that will keep you hooked up with!
- Appropriate Connector: Power Query includes a plethora of data interfaces. Data sources such as TXT, CSV, and Excel files are supported, as well databases such as Microsoft SQL Server and major SaaS services such as Microsoft Dynamics 365 and Salesforce.
- Early Filtering: It’s generally a good idea to filter your data as early as possible in the query process. It’s also a good idea to remove any data that isn’t related to your case. This allows you to concentrate on the task at hand by only displaying data that is important in the data preview section.
- Modular Strategy: It is certainly possible to write a single query that incorporates all of the necessary transformations and calculations. However, if the question comprises a big number of steps, it may be a good idea to separate the query into many inquiries, each of which references the previous one.
- Future-proofing queries: Power Query includes various capabilities that allow your query to be resilient to changes and to refresh even when some components of your data source change.
- Create Reusable functions: If you need to apply the same set of changes to different queries or values, developing a Power Query custom function that can be reused as many times as you need could be advantageous.
Conclusion
In conclusion, Power Query in Power BI provides a robust and user-friendly way to perform data transformations, empowering users to prepare their data for analysis efficiently. Its intuitive interface, combined with powerful transformation features, allows you to clean, shape, and structure data without needing extensive coding expertise. Whether you’re merging datasets, filtering rows, or creating calculated columns, Power Query simplifies the process, enabling more accurate and actionable insights.
Ready to take your data transformations to the next level? While Hevo doesn’t integrate with Power BI, it offers automated, no-code data pipelines to seamlessly migrate and prepare data for advanced analysis in your preferred tools. Try Hevo for free today!
FAQ on Power Query
1. What is a VBA Power Query?
VBA (Visual Basic for Applications) can be used to control Power Query in Excel by automating tasks like loading data and refreshing queries, extending Power Query’s functionality with custom scripts.
2. What is the power of Excel Power Query?
Power Query simplifies data preparation by allowing users to connect, combine, clean, and transform data from multiple sources through an intuitive interface, saving time and enhancing productivity.
3. What is the difference between Power Pivot and Power Query?
Power Query is for data extraction, transformation, and loading (ETL), while Power Pivot is for creating data models and performing advanced calculations using DAX for analysis within Excel.


