

As developers and data engineers build complex applications in Snowflake, monitoring performance is essential for ensuring smooth operation and a positive customer experience. Snowflake operations can be tracked using Snowsight, which provides tools for managing costs, tracking query history, monitoring data loading and transformations, and overseeing data governance activities.
Recently, Snowflake introduced “Snowflake Trail,” a data observability tool for Snowflake monitoring that integrates Snowsight with third-party tools, enhancing performance monitoring and debugging for applications and pipelines.
Hevo allows you to automate and streamline your data flows into Snowflake, ensuring accuracy, consistency, and speed—without any manual coding.
Here’s how Hevo simplifies Snowflake integration:
- No-Code Integration: Connect all your data sources to Snowflake with just a few clicks.
- Real-Time Data Sync: Keep your Snowflake data warehouse up-to-date with real-time data synchronization. Hevo ensures that your data is always fresh and ready for analysis.
- Automated Transformations: Clean, enrich, and transform your data before loading it into Snowflake. Hevo’s powerful drag-and-drop and Python features help you prepare data for analysis with ease.
- Pre-built Connectors: Hevo supports 150+ data sources, from databases to SaaS applications, allowing you to effortlessly integrate all your data into Snowflake.
- Scalable Pipelines: Hevo’s architecture is built to scale with your data, ensuring that you can handle increasing data volumes as your business grows.
Table of Contents
What are the Benefits of Monitoring Snowflake Metrics with Snowflake Trail?
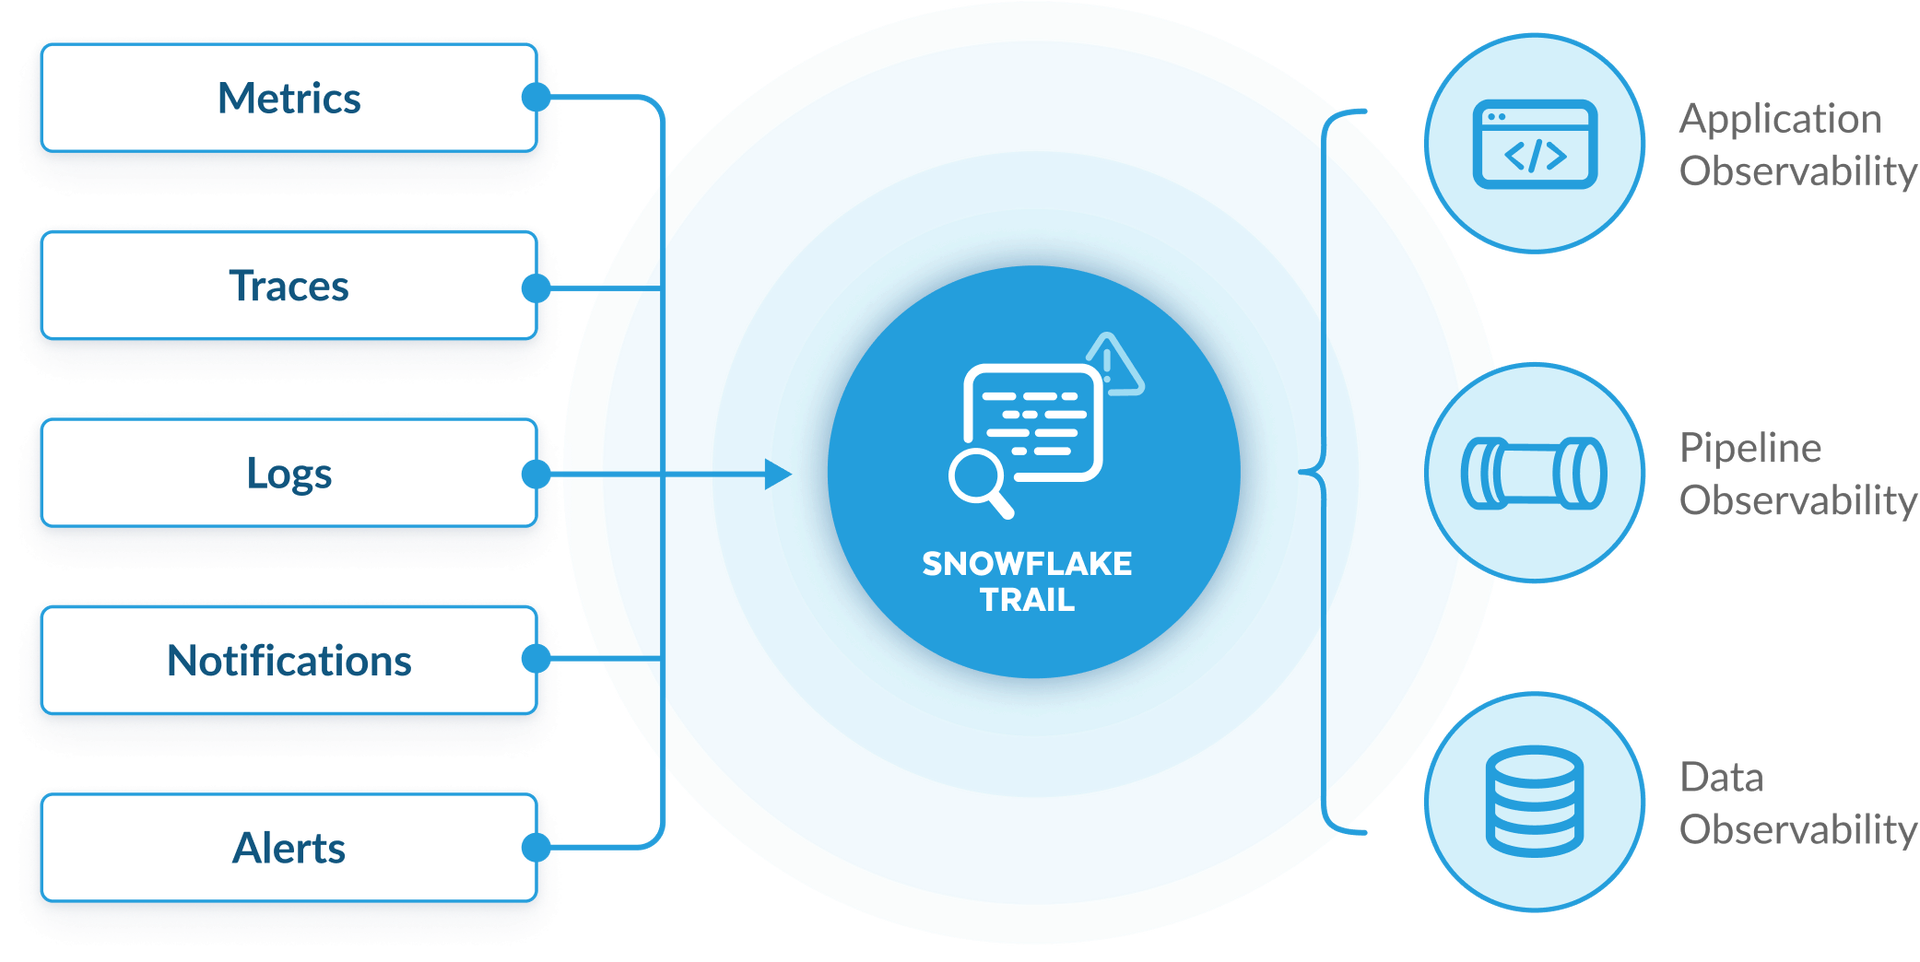
There are various metrics that need to be monitored in Snowflake for observability and good performance that satisfies customers. While using Snowflake Trial, you are able to retrieve fast insights of its applications without setting up any extra agents, you can just enable it quickly in the settings, to quickly diagnose and debug your application. Snowflake Trial does this by creating a default Event Table for each of Snowflake’s databases. It provides insights on your table’s data that is easily provided to customers without developers having to extract diagnosis data.
Key Features
- Log Explorer: Visualize logs, metrics, and tracing.
- Trace Viewer: Troubleshoot calls across objects with distributed tracing for Snowpark.
- Monitor CPU and Memory Consumption: Track the CPU and memory consumption of Snowpark (Python) stored procedures and functions.
- Python Profiler: Attach a profiler to their stored procedure to optimize compute time in stored procedures.
- Serverless Alerts: Monitor costs and optimize resources.
- Data-quality monitoring (coming soon): Built-in data-quality solutions with out-of-the-box system metrics or custom metrics
- Easy integration: Connect with Datadog, Grafana, PagerDuty, Slack, and more.
A Snowflake-native app to monitor Fivetran costs

Step By Step Snowflake Monitoring with Snowflake Trail
- Set up your database model using OrdersDB model
- Set up an event table and connect it your account
The Event Table created above is a special type of table designed to store logging and tracing data generated within your Snowflake environment. It has a predefined set of columns to capture various information, such as timestamps, event types, log messages, and trace details. By associating an event table with your Snowflake account, you can collect and centrally store all logs and traces, making it easier to analyze, troubleshoot, and monitor the health and performance of your data pipelines and applications.
CREATE OR REPLACE DATABASE observability_db;

-- Create an event table to store logs and traces

CREATE OR REPLACE EVENT TABLE observability_db.public.observability_event_table;

-- Associate the event table with your account (requires ACCOUNTADMIN role)

ALTER ACCOUNT SET EVENT_TABLE = observability_db.public.observability_event_table;

-- Set log level to INFO

ALTER SESSION SET LOG_LEVEL = INFO;

-- Enable Tracing

ALTER SESSION SET TRACE_LEVEL = ALWAYS;- Start capturing the log events using Stored Procedures
CREATE OR REPLACE FUNCTION log_customer_counts()

RETURNS VARCHAR

LANGUAGE PYTHON

RUNTIME_VERSION = 3.8

HANDLER = 'run'

AS $$

import logging

import random

# Create a logger instance with a specific name

logger = logging.getLogger("salesdb.customers.customer_processing_logger")

def run():

 # Simulate processing customer records

 customer_count = random.randint(10, 100)

 logger.info(f"Processed {customer_count} customer records.")

 # Simulate different logging scenarios

 if customer_count > 50:

    logger.warning("High customer count detected.")

 elif customer_count < 20:

    logger.debug("Low customer count.")

 else:

    logger.info("Normal customer count.")

 if customer_count == 0:

    logger.error("No customers found!")

 return "SUCCESS"

$$;

Execute it:

select log_customer_counts();
Output:

- Querying the event table
We have added the logging into our handler code, now we want to check the logged events. It’s time for querying the event table. Each logged message contains:
- Timestamp — when was the event logged
- Scope — e.g. name of the class where the log event was created
- severity level of the log — e.g. info, warning, error
- log message itself
-- Query for all types of events in the event table

select * from observability_db.public.observability_event_table;

 -- Query specifically for logs and extract relevant information

SELECT

 TIMESTAMP AS time,

 RESOURCE_ATTRIBUTES['snow.executable.name'] as executable,

 RECORD['severity_text'] AS severity,

 VALUE AS message

FROM

 observability_db.public.observability_event_table

WHERE

RECORD_TYPE = 'LOG';Output:
| TIME | EXECUTABLE | SEVERITY | MESSAGE |
| 2024-09-12 16:46:49.510 Z | “LOG_CUSTOMER_COUNTS():VARCHAR(16777216)” | “INFO” | “Processed 95 customer records.” |
| 2024-09-12 16:46:49.511 Z | “LOG_CUSTOMER_COUNTS():VARCHAR(16777216)” | “WARN” | “High customer count detected.” |
| 2024-09-12 16:42:42.107 Z | “LOG_CUSTOMER_COUNTS():VARCHAR(16777216)” | “INFO” | “Processed 37 customer records.” |
| 2024-09-12 16:42:42.107 Z | “LOG_CUSTOMER_COUNTS():VARCHAR(16777216)” | “INFO” | “Normal customer count.” |
| 2024-09-12 16:43:58.406 Z | “LOG_CUSTOMER_COUNTS():VARCHAR(16777216)” | “INFO” | “Processed 81 customer records.” |
| 2024-09-12 16:43:58.406 Z | “LOG_CUSTOMER_COUNTS():VARCHAR(16777216)” | “WARN” | “High customer count detected.” |


- Tracing the Table:
Another use case for event tables is collecting trace data from your code. Trace data is structured logging information in the form of key-value pairs which can provide a more detailed overview of code’s behavior than log data usually provides.
You need to use a third party tool called snowflake telemetry in python, which needs to be configured in your account. Select Admin » Billing & Terms and in the Anaconda section, select Enable.
Utilize your OrdersTableDB here.
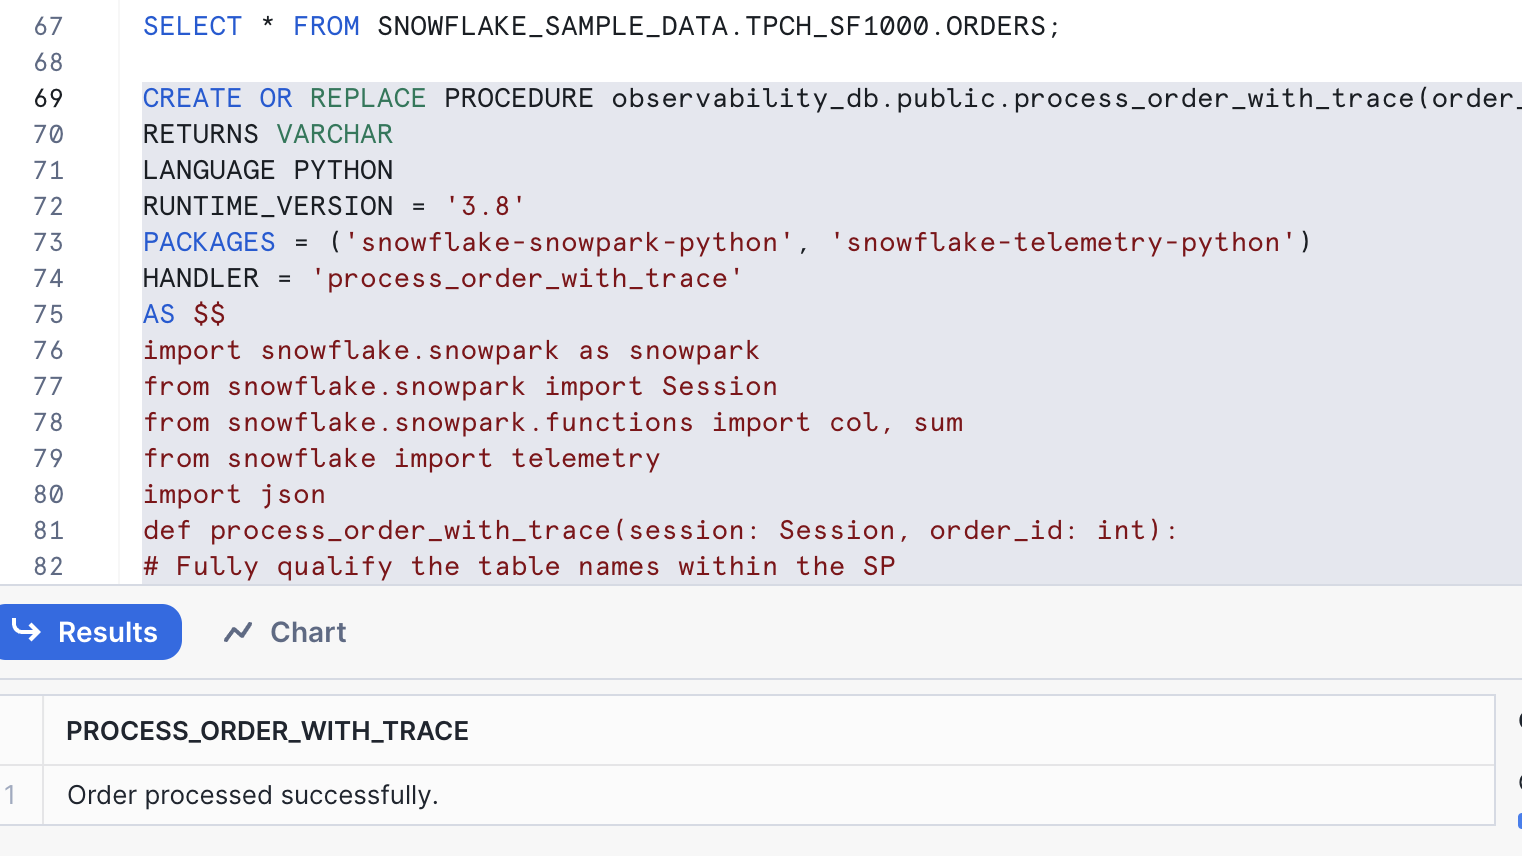
CREATE OR REPLACE PROCEDURE observability_db.public.process_order_with_trace(order_id INT)

RETURNS VARCHAR

LANGUAGE PYTHON

RUNTIME_VERSION = '3.8'

PACKAGES = ('snowflake-snowpark-python', 'snowflake-telemetry-python')

HANDLER = 'process_order_with_trace'

AS $$

import snowflake.snowpark as snowpark

from snowflake.snowpark import Session

from snowflake.snowpark.functions import col, sum

from snowflake import telemetry

import json

def process_order_with_trace(session: Session, order_id: int):

# Fully qualify the table names within the SP

    sales_order_table = "OrdersDB.public.sales_order"

    customer_table = "OrdersDB.public.customer"

    # Add order_id as a span attribute

    telemetry.set_span_attribute("order_id", order_id)

    # Fetch order details

    telemetry.set_span_attribute("process_step", "fetch_order_details")

    # Debug: Check if order_id is passed correctly

    print(f"Fetching order details for order_id: {order_id}")

    order_df = session.table(sales_order_table).filter(col("order_id") == order_id)

    # Debug: Check what the order DataFrame contains

    print(f"Order DataFrame Query: {order_df.show()}")  # This will show the first few rows of the DataFrame

    order_list = order_df.collect()  # Collect results from order_df

    # If order doesn't exist, log an event and return

    if len(order_list) == 0:  # Check if the query returned results

        print(f"Order not found for order_id: {order_id}")

        telemetry.add_event("order_not_found", {"order_id": order_id})

        return "Order not found."

    order = order_list[0]  # Extract the first row as dictionary

    print(f"Order found: {order}")

    # Fetch customer details

    telemetry.set_span_attribute("process_step", "fetch_customer_details")

    customer_id = order["CUSTOMER_ID"]

    customer_df = session.table(customer_table).filter(col("customer_id") == customer_id)

    # Debug: Check customer query and results

    print(f"Customer DataFrame Query: {customer_df.show()}")

    customer = customer_df.collect()[0] if customer_df.count() > 0 else None

    telemetry.add_event("fetch_customer_details", {"order_id": order_id, "status": "SUCCESS"})

    # Calculate total using snowpark functions. Do not iterate over the columns

    telemetry.set_span_attribute("process_step", "calculate_total")

    # Debug: Check if the order_price column exists and if we can calculate it

    order_price_df = order_df.select(sum(col("order_price").cast("float")).alias("order_price"))

    print(f"Order Price DataFrame: {order_price_df.show()}")

    order_price = order_price_df.collect()[0]["ORDER_PRICE"]

    telemetry.set_span_attribute("order_price", order_price)

    telemetry.add_event("calculate_price", {"order_id": order_id, "status": "SUCCESS"})

    # Update order status

    telemetry.set_span_attribute("process_step", "update_order_status")

    updated_order = {"ORDER_ID": order["ORDER_ID"], "ORDER_STATUS": 'Shipped'}

    # Use SQL to update the order status

    session.sql(f"""

        UPDATE {sales_order_table}

        SET ORDER_STATUS = 'Shipped'

        WHERE ORDER_ID = {order_id}

    """).collect()

    telemetry.add_event("updated_order_status", {"order_id": order_id, "status": "SUCCESS"})

    # Log the high-value order information

    log_message = f"High-value order placed: Order ID={str(order['ORDER_ID'])}, Customer ID={str(order['CUSTOMER_ID'])}, Total Amount={str(order_price)}"

    print(log_message)

    return "Order processed successfully."

$$;

Call the function:

CALL process_order_with_trace(480006);#order_id=480006 in sales_order
This procedure not only processes the order by fetching details, checking inventory, calculating the total, and updating the status, but also incorporates tracing using Snowflake’s telemetry framework.
- Query for Traces and Span Events:
SELECT

 RECORD_ATTRIBUTES['order_id']::INT AS order_id,

 RECORD['name']::VARCHAR AS span_name,

 TIMESTAMP AS start_time,

 LEAD(TIMESTAMP) OVER (ORDER BY TIMESTAMP) AS end_time,

 DATEDIFF('MILLISECOND', TIMESTAMP, LEAD(TIMESTAMP) OVER (ORDER BY TIMESTAMP)) AS duration_ms

FROM observability_db.public.observability_event_table

WHERE RECORD_TYPE = 'SPAN_EVENT'

 AND RESOURCE_ATTRIBUTES['snow.executable.name']::VARCHAR = 'PROCESS_ORDER_WITH_TRACE(ORDER_ID NUMBER):VARCHAR(16777216)'

ORDER BY TIMESTAMP;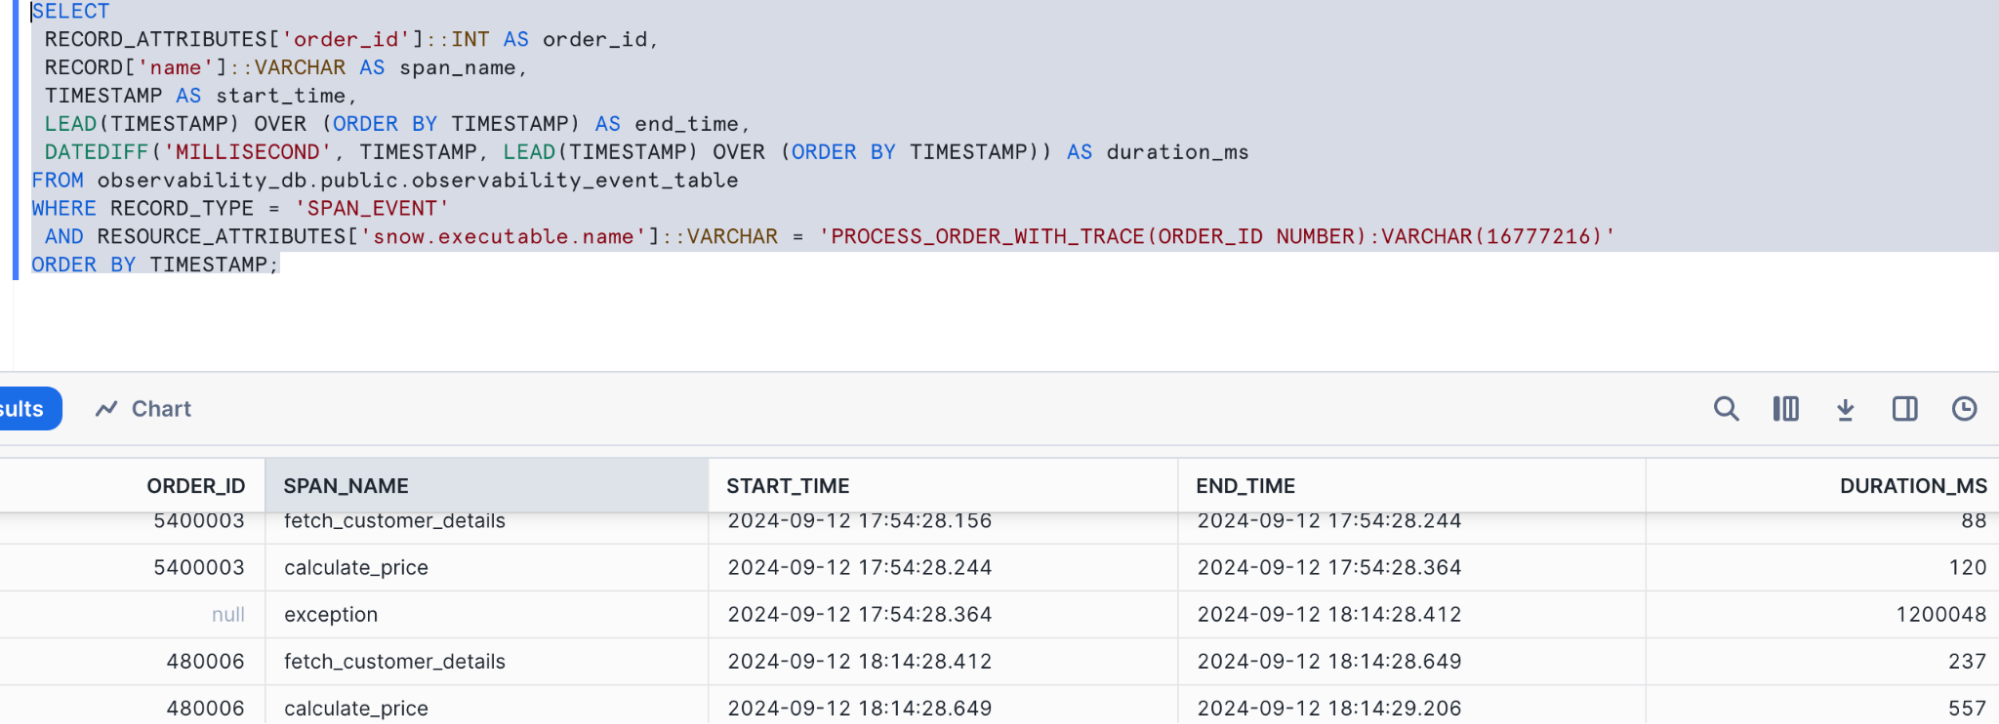
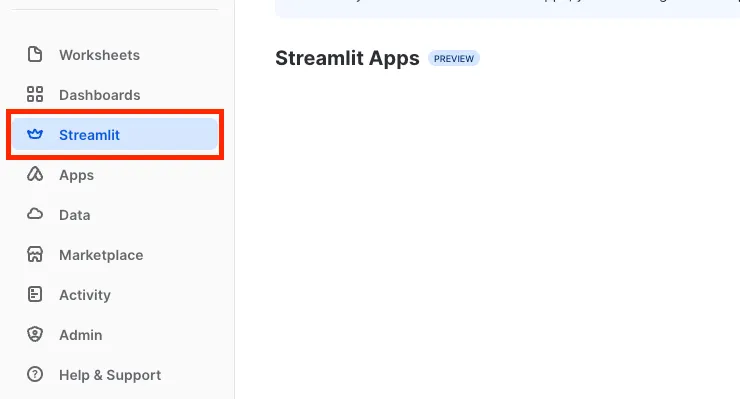
- Using a simple Streamlit app to visualize the order flow through the stages:
import streamlit as st

import pandas as pd

import plotly.express as px

from snowflake.snowpark.context import get_active_session

def fetch_telemetry_span_data(session):

    query = """

    SELECT

        RECORD_ATTRIBUTES['order_id']::INT AS order_id,

        RECORD['name']::VARCHAR AS span_name,

        TIMESTAMP AS start_time,

        LEAD(TIMESTAMP) OVER (ORDER BY TIMESTAMP) AS end_time,

        DATEDIFF('MILLISECOND', TIMESTAMP, LEAD(TIMESTAMP) OVER (ORDER BY TIMESTAMP)) AS duration_ms

    FROM observability_db.public.observability_event_table

    WHERE RECORD_TYPE = 'SPAN_EVENT'

        AND RESOURCE_ATTRIBUTES['snow.executable.name']::VARCHAR = 'PROCESS_ORDER_WITH_TRACE(ORDER_ID NUMBER):VARCHAR(16777216)'

    ORDER BY TIMESTAMP;

    """

    # Execute query and fetch data

    df = session.sql(query).to_pandas()

    return df

# Streamlit app layout

st.title("Trace Visualization for PROCESS_ORDER_WITH_TRACE")

# Create Snowpark session

session = get_active_session()

# Fetch telemetry span data

df = fetch_telemetry_span_data(session)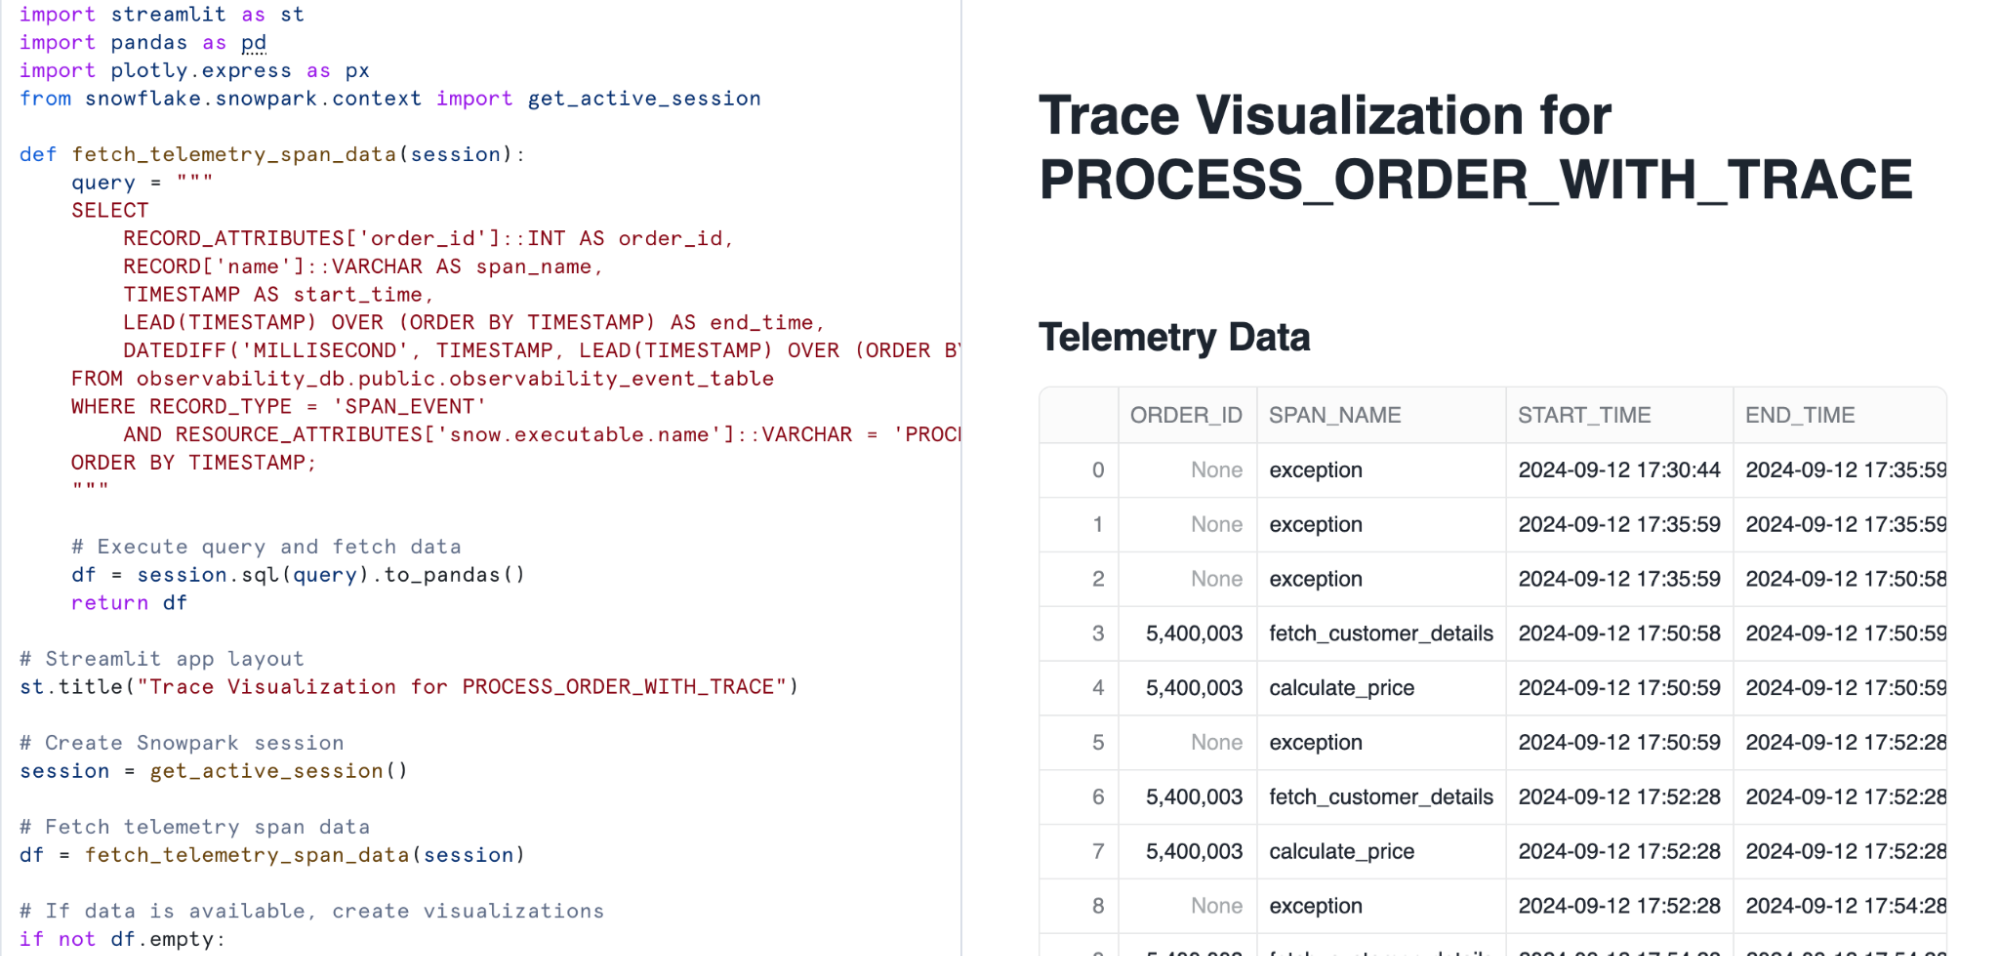
# If data is available, create visualizations

if not df.empty:

    st.write("### Telemetry Data")

    st.dataframe(df)

    # Visualization 1: Gantt chart for span duration

    st.write("### Span Duration Gantt Chart")

    fig = px.timeline(

        df,

        x_start="START_TIME",

        x_end="END_TIME",

        y="SPAN_NAME",

        color="SPAN_NAME",

        title="Span Events Over Time",

        labels={"SPAN_NAME": "Span Name", "start_time": "Start Time", "end_time": "End Time"}

    )

    st.plotly_chart(fig)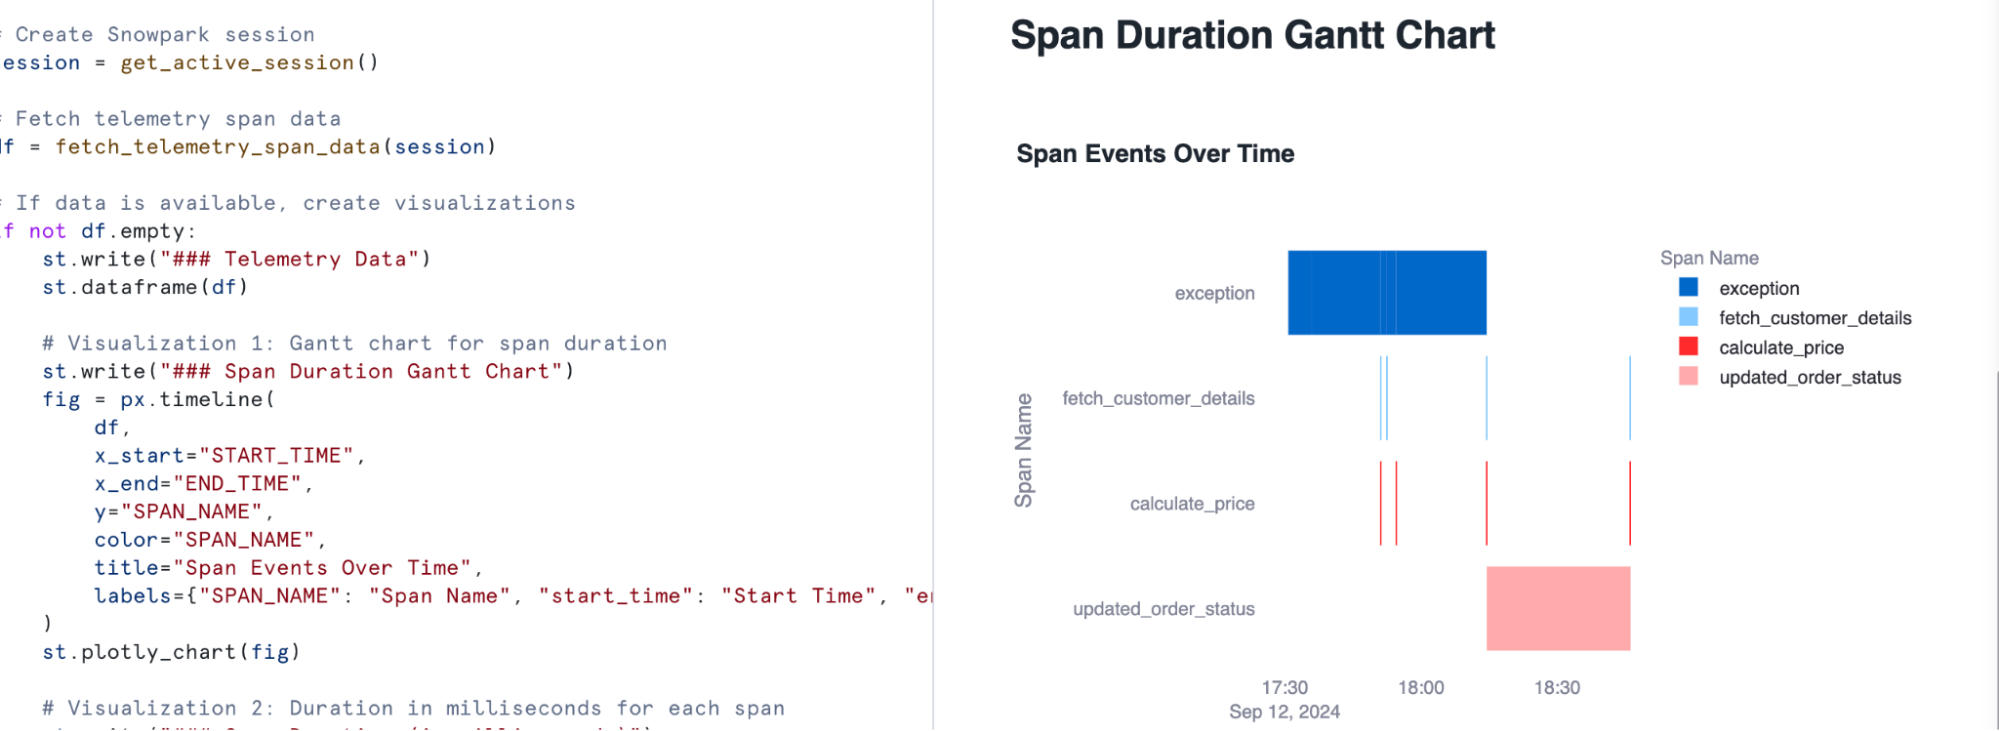
# Visualization 2: Duration in milliseconds for each span
st.write("### Span Duration (in milliseconds)")

    fig = px.bar(

        df,

        x="SPAN_NAME",

        y="DURATION_MS",

        title="Duration of Each Span",

        labels={"SPAN_NAME": "Span Name", "DURATION_MS": "Duration (ms)"}

    )

    st.plotly_chart(fig)

else:

    st.write("No telemetry data found for the specified query.")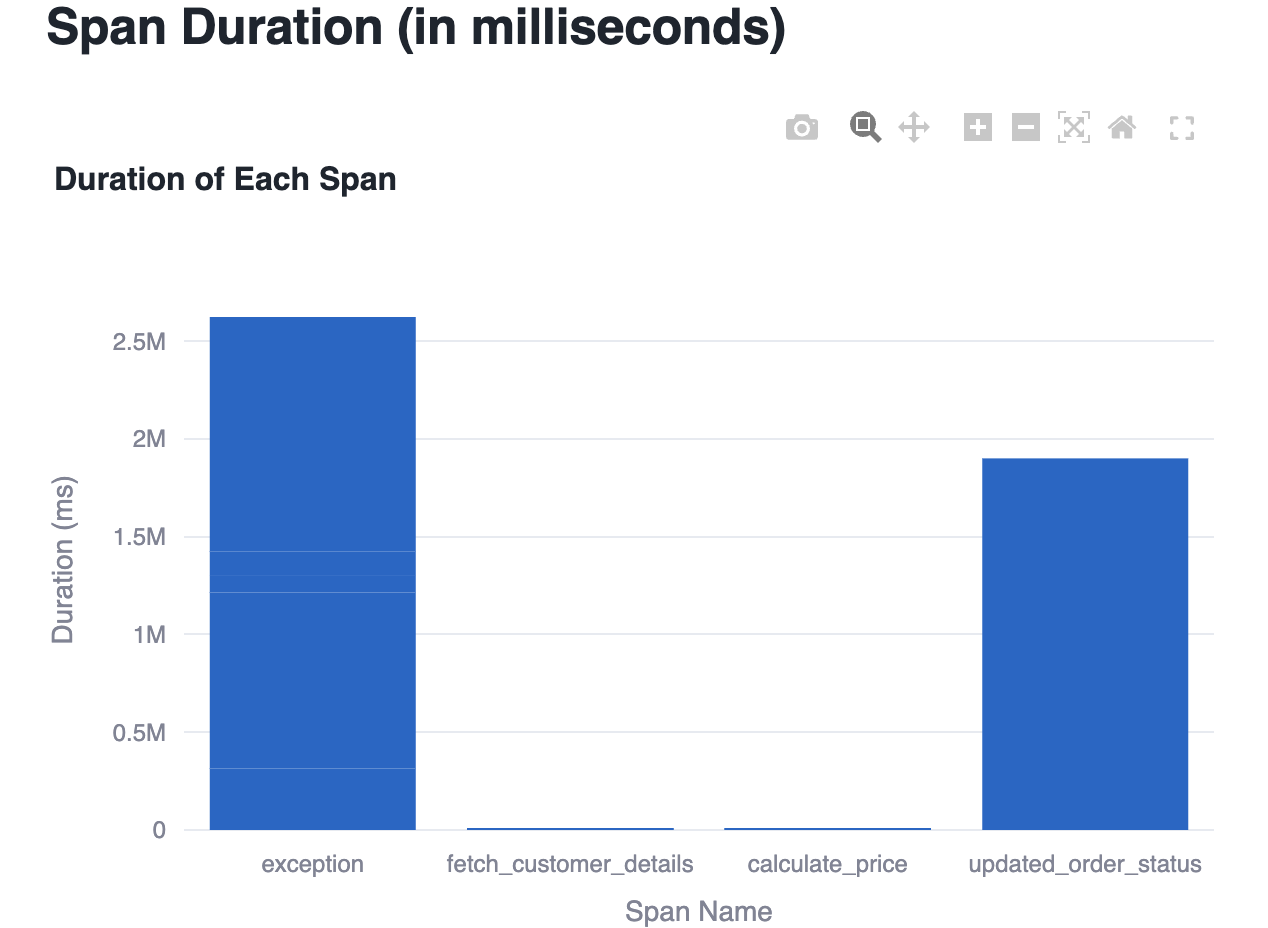
As we’ve seen, Snowflake’s observability framework — comprising logging, tracing, and events — is a powerful toolkit for understanding and optimizing your data pipelines.
Discover how to create Streamlit apps on Snowflake in this step-by-step guide, enhancing your Snowflake monitoring with dynamic visualizations.
Other ways for Snowflake Monitoring
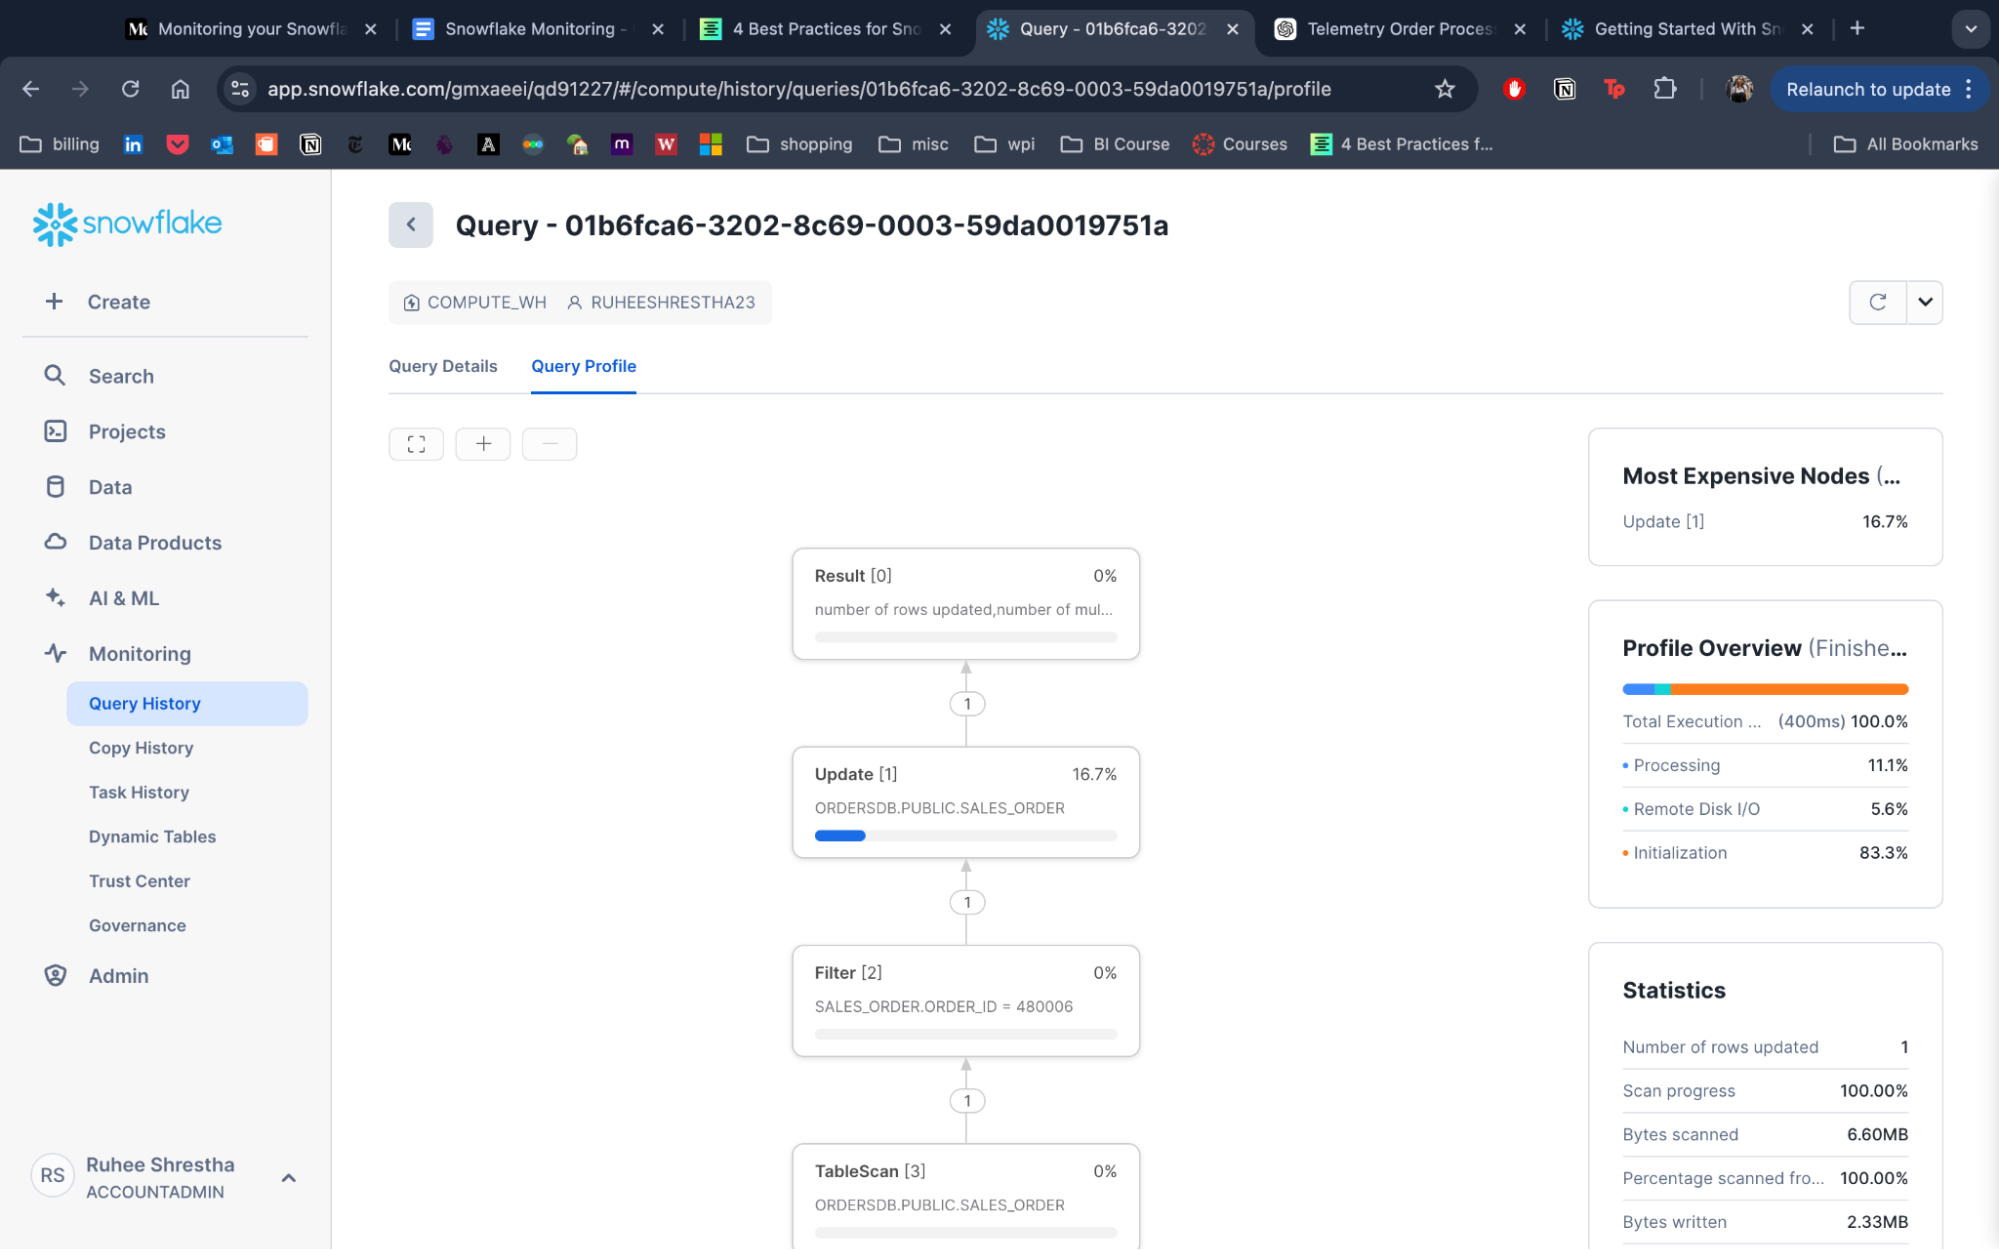
- Under Monitoring: navigate to Query History
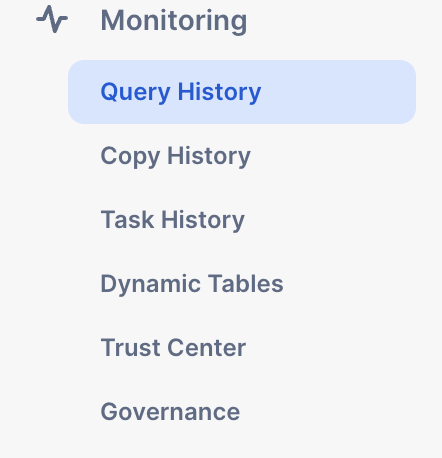
Go to a single query and its query profile to view different metrics and statistics.
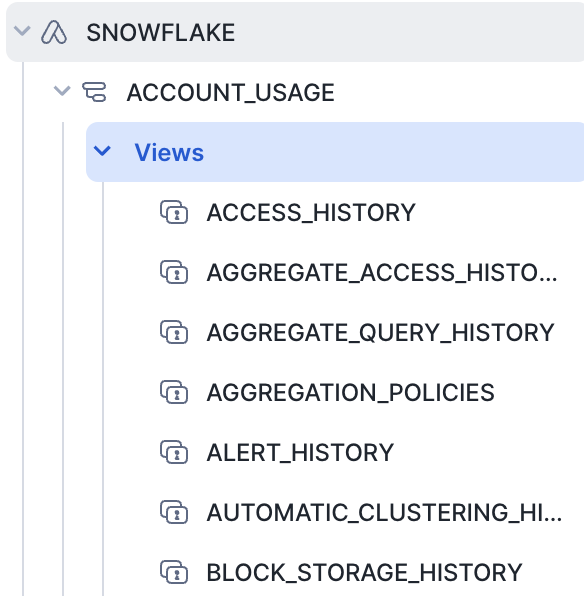
- Check ACCOUNT_USAGE:
ACCOUNT_USAGEis a schema in your Snowflake that stores various metrics fromQUERY_HISTORYtoDATABASE_STORAGE_USAGE_HISTORY, and is useful to track query object metadata, as well as historical usage data, for their account.
- Implement a Comprehensive third-party Snowflake Observability Solution
While Snowflake provides built-in tools for monitoring usage, they may lack the specific details that you actually require. To effectively manage Snowflake usage, leveraging third-party Snowflake observability tools becomes necessary. There are numerous tools in the market that can help monitor and create alerts for Snowflake usage. Here are a few popular ones that can greatly assist you:
- Chaos Genius
- New Relic
- Monte Carlo
- Datadog – Snowflake Integration
- Set Up Effective Snowflake Alerts Mechanisms for Key Metrics
In some cases, you might want to be notified or take action when data in Snowflake meets certain conditions. For example, you might want to receive a notification when the warehouse credit usage increases by a specified percentage of your current quota or the resource consumption for your pipelines, tasks, materialized views, etc. increases beyond a specified amount.
For example, suppose that you want to send an email notification when the credit consumption exceeds a certain limit for a warehouse. Suppose that you want to check for this every 30 minutes. You can create an alert with the following properties:
Condition: The credit consumption for a warehouse (the sum of the credits_used column in the WAREHOUSE_METERING_HISTORY view in the ACCOUNT_USAGE) schema exceeds a specified limit.
Action: Email the administrator.
Frequency / schedule: Check for this condition every 30 minutes.
You can configure Snowflake to send notifications about Snowpipe and task errors to a cloud provider queue (Amazon SNS, Microsoft Azure Event Grid, or Google Cloud Pub/Sub). You can also use a SQL statement to send a notification to an email address, a cloud provider queue, or a webhook.
Best Practices for Monitoring in Snowflake
- Utilize Snowsight Dashboards: Leverage Snowsight’s built-in dashboards to monitor key performance metrics such as query execution time, warehouse usage, and storage consumption.
- Enable Alerts: Set up serverless alerts to detect anomalies in cost, long-running queries, and resource usage to maintain optimal performance.
- Analyze Query Performance: Regularly review Query History in Snowsight to identify and optimize slow or expensive queries, ensuring efficient workload management.
- Track Compute Usage: Monitor auto-scaling and warehouse activity to align compute resources with demand, preventing inefficiency.
- Use Snowflake Trail for Debugging: Snowflake Trail enhances observability by providing detailed logs, distributed tracing, and CPU/memory monitoring, helping troubleshoot and optimize applications.
- Monitor Data Quality and Governance: Use Snowsight to track data quality metrics (e.g., null counts) and enforce governance policies to ensure data accuracy and compliance.
- Integrate with Third-Party Tools: Easily integrate Snowflake Trial with observability tools like Datadog and PagerDuty for real-time alerts and issue detection.
Explore additional data loading solutions in our blog on Snowpipe alternatives to enhance your Snowflake monitoring strategy.
Conclusion
Monitoring your Snowflake environment effectively is essential for ensuring optimal performance, efficient cost management, and a seamless customer experience. Snowflake provides a range of built-in monitoring tools and features through its Snowsight interface, which allows developers and data engineers to track query history, manage data governance, and oversee various activities within their Snowflake environment.
The introduction of Snowflake Trail expands these capabilities significantly. Snowflake Trail integrates seamlessly with Snowsight and third-party tools to offer enhanced observability and troubleshooting features. With Snowflake Trail, users can leverage advanced metrics like CPU and memory consumption, Python profiler data, and distributed tracing to gain deeper insights into their data pipelines and application performance.
Schedule a personalized demo with Hevo for a seamless data integration experience.
Share it with your connections.
-
 Share To LinkedIn
-
 Share To Facebook
-
 Share To X
-
 Copy Link


