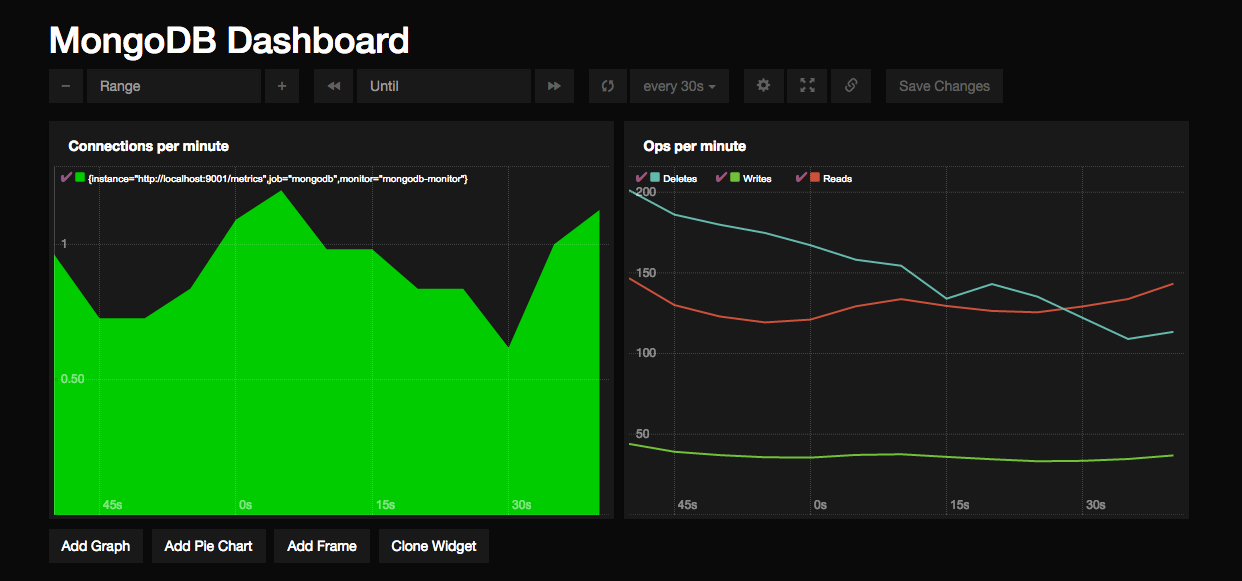
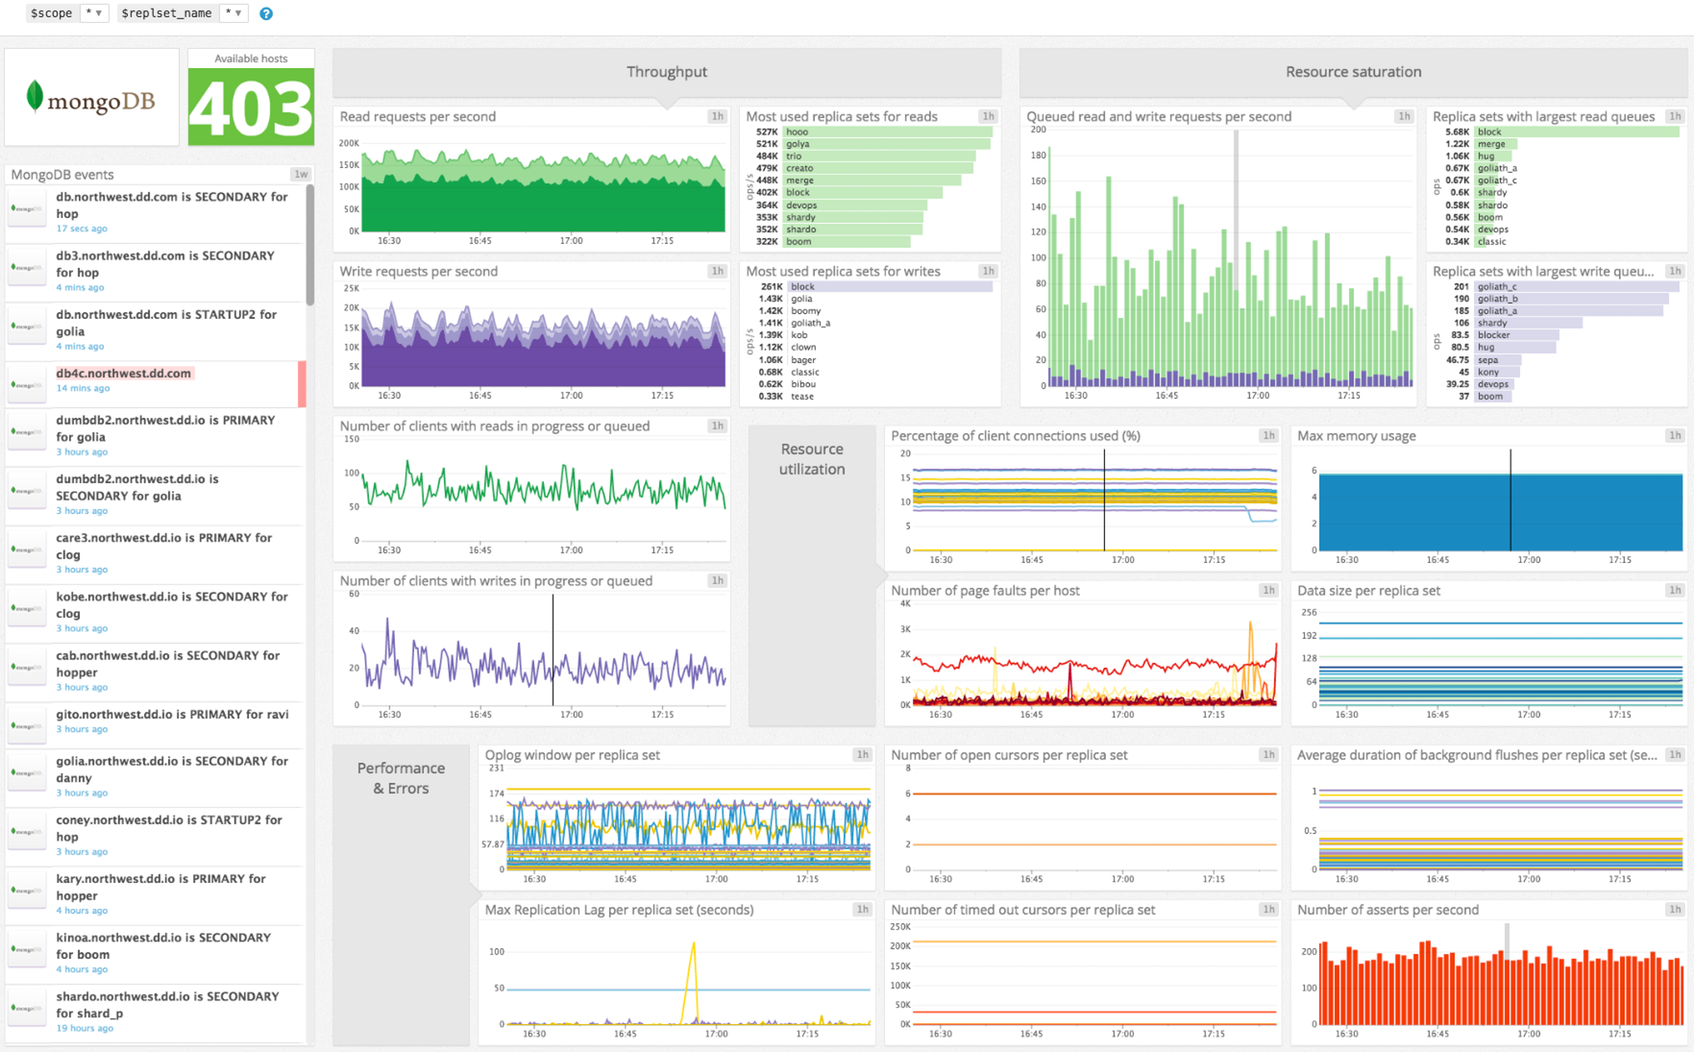
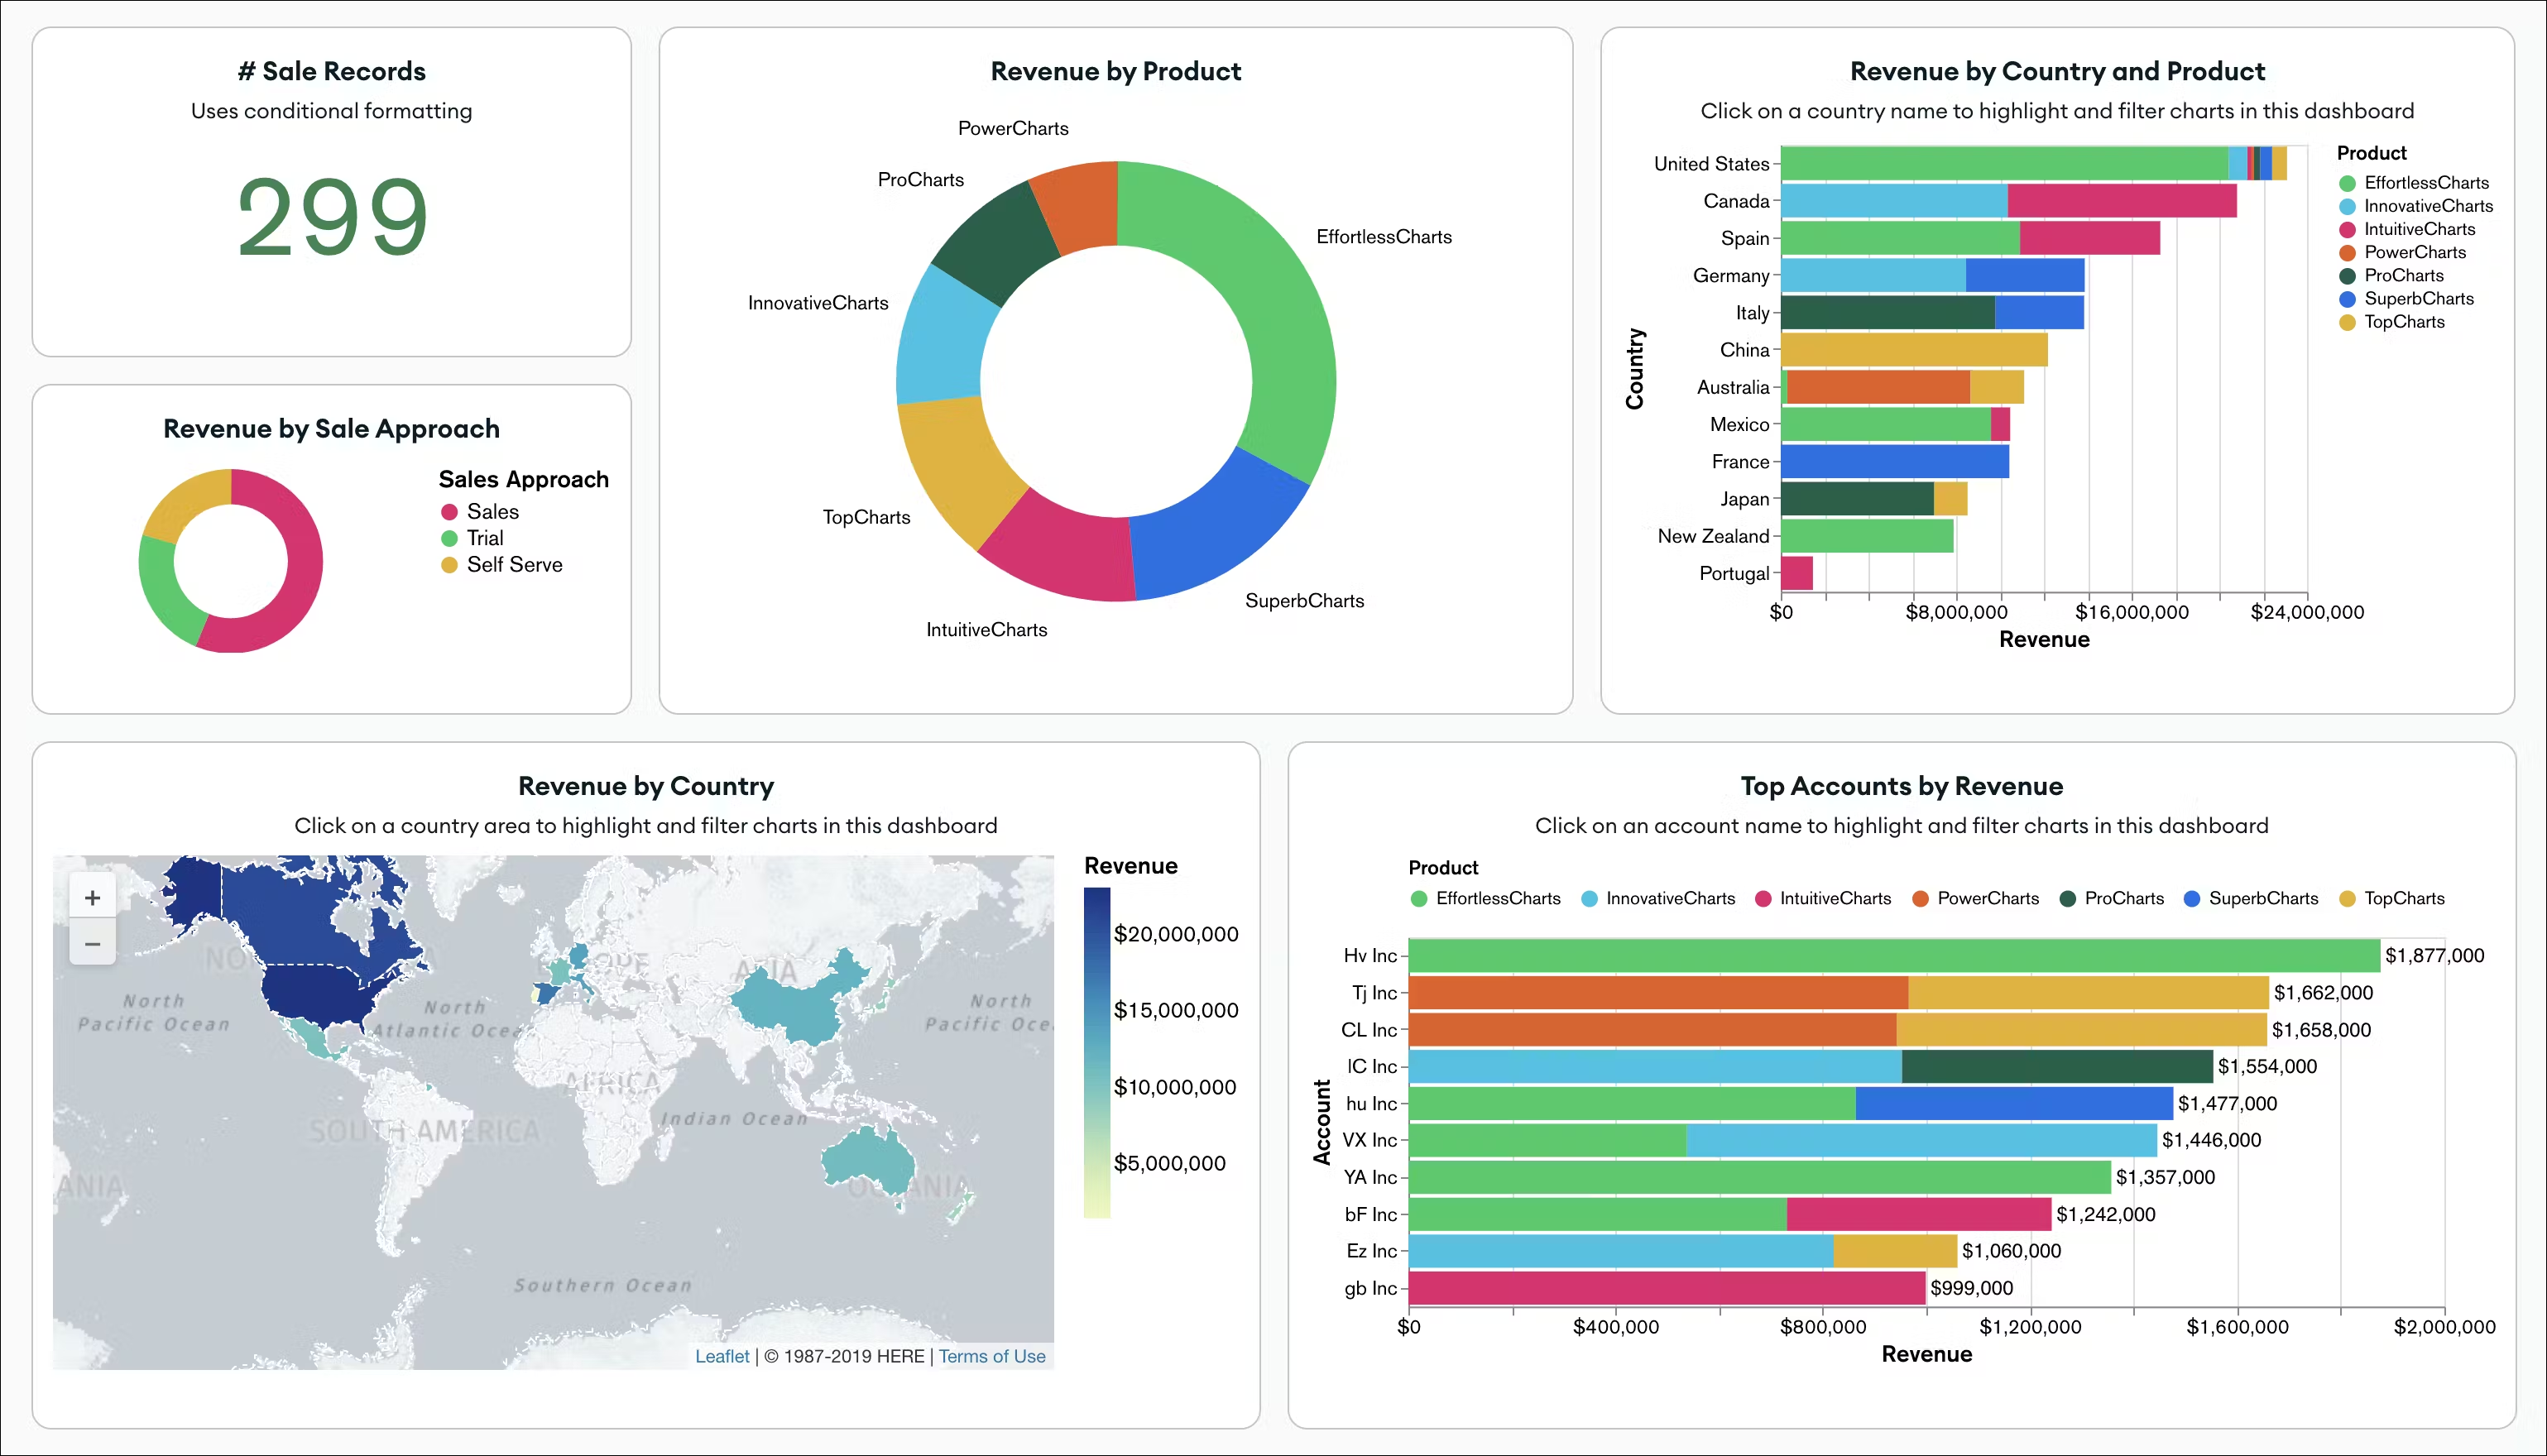
MongoDB is a non-relational database that accommodates various data formats. Rather than storing data in tables, MongoDB groups them into documents and collections. A document refers to a single data unit, which is the equivalent of a record in SQL databases. MongoDB collections are similar to the tables in relational databases.
Prometheus MongoDB Metrics helps programmers observe the performance of their database in real-time. This software documents the information observed in the form of metrics, and stores the data in self-owned databases.
Your customers are probably requesting information from your MongoDB database from time to time. With the Prometheus MongoDB Metrics, you can measure how fast your server responds to their request, and optimize your database to improve their experience.
This tutorial will tell all about Prometheus MongoDB Metrics. We will also explore the importantance of the Prometheus MongoDB Metrics and MongoDB dashboards that Prometheus uses.
Table of Contents
What is MongoDB?
MongoDB, developed by MongoDB inc, is a NoSQL schema-free database. It was designed and created using c++ and javascript allowing for higher connectivity. It uses a collection of Documents and has an option for creating schemas as well. It doesn’t follow the same structure of a traditional database wherein the data is stored in form of rows.
Since general RDBMS are easier to use same is the case with MongoDB. MongoDB uses a NoSQL platform making it easier for individuals having less or no prior programming knowledge. MongoDB processes the data in a semi-structured format, allowing for processing large volumes of data in one go simultaneously. It can be hosted on mostly all the cloud platforms be it Google’s Cloud, Microsoft Azure, or even Amazons’ Web Services.
MongoDB uses Binary JSON and MQL as an alternative to SQL. BSON allows for data types such as the floating-point, long, date, and many more that are not supported by regular JSON. MQL offers additional capabilities when compared to regular SQL making it more relevant for MongoDB as it processes JSON-type documents.
MongoDB is a NoSQL Server in which data is stored in BSON (Binary JSON) documents and each document is essentially built on a key-value pair structure. As MongoDB easily stores schemaless data, make it appropriate for capturing data whose structure is not known. This document-oriented approach is designed to offer a richer experience with modern programming techniques.
To install MongoDB click here.
Effortlessly manage and migrate your sharded MongoDB data with Hevo. Hevo supports MongoDB as one of its 150+ data sources, ensuring seamless data integration and real-time synchronization.
- No-Code Solution: Easily connect and manage your MongoDB data without writing a single line of code.
- Flexible Transformations: Use drag-and-drop tools or custom scripts for data transformation.
- Real-Time Sync: Keep your destination data warehouse updated in real time.
- Auto-Schema Mapping: Automatically handle schema mapping for a smooth data transfer.
Join over 2000 satisfied customers, including companies like Voiceflow and Playtomic, who trust Hevo for their data integration needs. Check out why Hevo is rated 4.7 stars on Capterra.
Get Started with Hevo for FreeUsing the Prometheus MongoDB Metrics

According to devconnected.com, here’s how to use the Prometheus MongoDB Metrics:
- Prometheus MongoDB Metrics: Prometheus Download
Take the following steps to install Prometheus to your system:
- Type ‘https://prometheus.io/download/’ into your browser.
- Next, enter the following wget command to access the Prometheus archive for your operating system:
wget https://github.com/prometheus/prometheus/releases/download/v2.9.2/prometheus-2.9.2.linux -amd64.tar.gz- Extract the archive and open the main folder. To do this, you need to input the following code into your Command Prompt:
> tar xvzf prometheus-2.9.2.linux-amd64.tar.gz > cd prometheus-2.9.2.linux-amd64/- Next, scroll the ‘global’ section and adjust the ‘scrape_interval’ property to one second by writing the code below:
global: scrape_interval: 1s- Then, move to the ‘scrape_configs’ section and enter this under ‘static_configs’:
static_configs: - targets: ['localhost:9090', 'localhost:9091']- Now, look for the Prometheus executable in the folder and run it. If you’ve followed the steps correctly, Prometheus should start while you are running this command.
- If you want to ascertain that everything is in order, go to
‘http://localhost:9090/graph’- You have installed Prometheus successfully if you can access the Prometheus web console on the webpage.
- Prometheus MongoDB Metrics: Downloading MongoDB Exporter
The MongoDB exporter lets you bind your MongoDB databases to Prometheus. You can find the MongoDB exporter on Percona’s GitHub. Although the MongoDB exporter exists as a binary file, you have to configure it to your system to run it.
- Enter the following command line into Command Prompt to download the MongoDB exporter:
$ mkdir mongodb-exporter $ cd mongodb-exporter $ wget https://github.com/percona/mongodb_exporter/releases/download/v0.7.1/mongodb_exporter-0.7.1.linux-amd64.tar.gz- Next, use the code below to open the archive in a folder
$ tar xvzf mongodb_exporter-0.7.1.linux-amd64.tar.gz- Create an authenticated user in Prometheus if you don’t have one yet. You need this user account to run the MongoDB exporter:
$ sudo useradd -rs /bin/false prometheus $ sudo mv mongodb_exporter /usr/local/bin/- Prometheus MongoDB Metrics: Setting up MongoDB Authentication for your MongoDB Exporter
The MongoDB exporter links your MongoDB database to Prometheus. So, you need authenticated user accounts on both software to work with the Prometheus MongoDB Metrics.
- First, connect to MongoDB authentication through localhost using the following command:
$ ps aux | grep mongod mongodb 13468 1.1 6.9 1490632 281728 ? Ssl Jan05 2838:27 /usr/bin/mongod --unixSocketPrefix=/run/mongodb --config /etc/mongodb.conf- Next, link to MongoDB instance with mongo:
$ mongo --port 27017- Then, open a new administrator account for your MongoDB exporter:
use admin db.createUser( { user: "mongodb_exporter", pwd: "password", roles: [ { role: "clusterMonitor", db: "admin" }, { role: "read", db: "local" } ] } )- After typing in the code for your administrator account, you should get this message:
Successfully added user: { "user" : "mongodb_exporter", "roles" : [ { "role" : "clusterMonitor", "db" : "admin" }, { "role" : "read", "db" : "local" } ] }- Next, shut down your MongoDB instance. Then, restart it.
$ db.adminCommand( { shutdown: 1 } ) $ exit $ sudo mongod --auth --port 27017 --config /etc/mongodb.conf &- Finally, set up your MongoDB environment variable:
$ export MONGODB_URI=mongodb://mongodb_exporter:password@localhost:27017- Prometheus MongoDB Metrics: Create a Service File for Your MongoDB Exporter in the Prometheus MongoDB Metrics
- Open the /lib/system/system to set up a new service file for your MongoDB exporter:
$ cd /lib/systemd/system/ $ sudo touch mongodb_exporter.service- Input the following configuration into the service file:
[Unit]
Description=MongoDB Exporter
User=prometheus

[Service]
Type=simple
Restart=always
ExecStart=/usr/local/bin/mongodb_exporter

[Install]
WantedBy=multi-user.target
- Next, restart your system daemon.
$ sudo systemctl daemon-reload $ sudo systemctl start mongodb_exporter.serviceThe service should start running once you do this.
- If you want to check that the service is working, enter the following command on port 9216:
$ sudo curl http://localhost:9216/metrics # HELP go_gc_duration_seconds A summary of the GC invocation durations. # TYPE go_gc_duration_seconds summary go_gc_duration_seconds{quantile="0"} 0 go_gc_duration_seconds{quantile="0.25"} 0 go_gc_duration_seconds{quantile="0.5"} 0 go_gc_duration_seconds{quantile="0.75"} 0 go_gc_duration_seconds{quantile="1"} 0 go_gc_duration_seconds_sum 0 go_gc_duration_seconds_count 0
Your service file is in good shape if some Prometheus metrics start appearing.
- Configuring the Prometheus MongoDB Metrics
Prometheus MongoDB Metrics works by scrapping targets and collating metrics from the target. That said, you have to configure your MongoDB exporter as a Prometheus target:
- Search for your Prometheus configuration file on your computer. The title of the configuration file should look like this:
/etc/Prometheus/Prometheus.yml- Add the following command to configure the MongoDB exporter:
static_configs: - targets: ['localhost:9090', 'localhost:9216']MongoDB Key Metrics

Given that Prometheus offers you insight into many MongoDB metrics, it might be difficult to keep track of all of them. This is why we will discuss the important MongoDB metrics you should consider.
Out of all MongoDB metrics, 3 categories are the most important. These categories are:
- MongoDB Operation and Connection Metrics
These metrics address the performance of your application. If your application provides slow responses to customer requests, you should study your operation and connection metrics. Examples of operation and connection metrics are:
- Opcounters: Opcounters refer to the number of operations per second.
- Connections: This points to the number of open connections on your MongoDB instance. If this metric has a high number, your server might be unresponsive.
- Operation Execution Times: This refers to the amount of time an average operation takes.
- Scan and Order: This is the average rate at which the data returns results of unsuccessful operations.
- Queues: Your queues state the number of operations waiting to be executed. A large number of queues might indicate that your database resources are insufficient for your client size.
- MongoDB Replication Metrics
Replication metrics explore how your MongoDB database shares information across your clients. Common MongoDB replication metrics are:
- Replication Lag Window: The Replication lag window refers to the number of seconds your secondary node is lagging behind the primary node. If the replication lag window is high, it means that your secondary node takes longer to replicate.
- Replication Headroom: This is the difference in value between your secondary replication lag and primary replication operation log (operation log).
- Replication Window: Replication Window refers to the number of hours in your primary replication oplog.
- Opcounters – repl: This refers to the number of replication operations performed per second.
- Oplog GB/Hour: This is the amount of gigabytes of oplog the primary produces per hour.
- MongoDB Hardware Metrics
MongoDB hardware metrics analyze the hardware occupied by your MongoDB databases.
Examples of Prometheus MongoDB Metrics are:
- Disk Latency: This refers to the average amount of seconds it takes to complete a read or write operation on the disk location used by MongoDB.
- Swap Usage: This states the amount of memory on your swap device. If the swap usage count is too high, the memory on your swap device may be inadequate for your workload.
- Disk Space Free: This points to the amount of free disk space available on the disk area occupied by MongoDB.
- Disk IOPS: This describes the number of input or output operations performed per second on the disk space occupied by MongoDB.
- System Memory: System Memory is the average number of used memory bytes in a disk divided by the amount of unused disk space.
MongoDB Dashboards
Percona, the IT company that develops the MongoDB software, has built 6 MongoDB dashboards till date:
- MongoDB Overview
- MongoDB RocksDB
- MongoDB inMemory
- MongoDB ReplSet
- MongoDB MMAPv1
- MongoDB WiredTiger
- MongoDB Overview

This gives an overview of your MongoDB database.
MongoDB RocksDB
RocksDB is MongoDB’s engine for quick storage. If you want to run a simple query, it might take a long time to run the command in Mongodb. RocksDB allows you to run simple queries fast and store them in seconds.
MongoDB inMemory
MongoDB inMemory dashboard displays data that is stored in your computer’s RAM, rather than the hard disk.
MongoDB ReplSet
MongoDB ReplSet displays a set of MongoDB instances that contain the same data set.
MongoDB MMAPv1
MongoDB MMAPv1 dashboard shows memory-mapped files. Memory-mapped files are stored in the virtual memory, such as a hard disk drive.
MongoDB WiredTiger
The MongoDB WiredTiger dashboard shows data stored in MongoDB’s default storage engine. If you haven’t specified your storage engine, MongoDB will keep your files here.
Conclusion
Using Prometheus to monitor MongoDB metrics may seem a little complicated. But if you follow the guide in this article, you will find the process much easier. That said, you can contact Technical Support if you encounter any issues while using the database.
Hevo Data is a No-code Data Pipeline that provides you with a consistent and reliable solution to manage data transfer between a variety of sources and a wide variety of Desired Destinations with a few clicks.
Hevo Data with its strong integration with 150+ data sources (including 60+ Free Sources) allows you to not only export data from your desired data sources & load it to the destination of your choice but also transform & enrich your data to make it analysis-ready. Hevo also allows integrating data from non-native sources using Hevo’s in-built Webhooks Connector. You can then focus on your key business needs and perform insightful analysis using BI tools.
FAQs
How to Connect MongoDB with Prometheus?
1. Use the MongoDB Exporter to expose MongoDB metrics in a format compatible with Prometheus.
2. Install and configure the exporter with your MongoDB instance.
3. Update Prometheus’ configuration file (prometheus.yml) to scrape the exporter endpoint.
4. Restart Prometheus to start collecting metrics.
How to Check Performance of MongoDB?
1. Use MongoDB Atlas Monitoring (if hosted).
2. Enable the mongostat or mongotop commands for real-time metrics.
3. Monitor slow query logs and set appropriate profiling levels.
4. Use external tools like Prometheus, Grafana, or Percona Monitoring to analyze performance metrics.
How to Check Metrics in Prometheus?
1. Access Prometheus via its web interface by navigating to <prometheus-server-ip>:9090.
2. Use the Graph tab to query metrics using PromQL (e.g., up, mongodb_connections_current).
3. Integrate Grafana for advanced visualization and dashboards.
4. Check Targets to verify if endpoints are being scraped successfully.


