Marketing Reporting is essential to gain valuable and actionable insights on the perception and engagement of a customer with your products and services. Building Digital Marketing Reports help Marketers monitor their performance based on the data collected from their customers. On the other hand, manual reporting to analyze complex Marketing Data is highly error-prone. Hence, it is essential to implement a reliable automated reporting approach to tackle issues put forth by the time-consuming and error-prone manual process.
Another problem with the traditional techniques of Marketing Reporting is that Analysts cannot readily leverage the Marketing Data because it is present across diverse platforms. This is because the data collected from multiple data sources is not formatted and requires to be cleaned in order to be used for Analytics. Hence, to tackle these issues, having an automated solution for building accurate Marketing Reports is an absolute must.
In this article, you will get an in-depth understanding of how to automate the reporting process for your Marketing data. Further, this article will also provide you with a brief overview of the robust modern Reporting and Analytics stack, along with some common challenges you may encounter. Excited to learn more about this topic in detail? Before we get into the details, watch this video to get a gist of our detailed course on Automating Marketing Reporting with Unified Data.
P.S. This course is a part of our Marketing Analytics Masterclass curated by Global Marketing Leaders. Click here to register for this Masterclass and upgrade your Marketing skills to effectively automate your Marketing Reporting with Unified Data.
Table of Contents
Current Reporting & Analytics Challenges
With the exponential increase in the volume of marketing and customer data, most Marketers struggle to extract accurate and actionable insights. As many Marketing tools gather data from multiple data sources, they can confuse Marketers in deciding what parts of the data need to be analyzed to gain value from it. These challenges make the jobs of Marketers tedious and hamper their performance.
The following are 5 of the most significant challenges Marketers face while carrying out Analytics and perform Marketing Reporting:
- Access
- Quality
- Alignment
- Expertise
- Intuition
1) Access
Data Access is a problem that arises when Marketers do not have access to data every step of the way. Without proper Data Access, Marketers cannot accomplish any business goals and make sharp and accurate reports.
2) Quality
The quality of your Marketing Dashboards and Reports depends significantly on the data quality. Hence, ensuring the availability of accurate & error-free data and transforming it into an analysis-ready form is essential to carry out an effective analysis.
3) Alignment
A proper alignment between all your teams is important to produce insightful and valuable reports. Furthermore, if you want to prioritize the requirements of your customers, you need to align your vision and the goals needed to achieve it.
4) Expertise
When you want to create powerful and impactful reports, upper management plays a pivotal role. Upper management cannot afford to be lazy when leveraging Marketing Data.
5) Intuition
Setting up effective Marketing strategies requires leveraging the right mix of analytics and expertise-based inputs. Hence, Marketers must gain expertise in their respective domains & markets, thereby enhancing their ability to ask the right questions and leverage data for value creation.
The figure below highlights the top 5 challenges of the current Marketing Reporting & Analytics Stack:

If you want to understand how to overcome some of these challenges, click this link.
Overview of Analytics & Reporting Stack
Modern-day Marketing Reporting & Analytics Stack helps Marketers unify data from numerous cross-functional sources, transform it into an analysis-ready form and then leverage intuitive BI tools to create informative reports and dashboards. Marketers can then carry out an insightful analysis and draw actionable insights into their Marketing performance.
The below figure gives an overview of all the processes involved in the Marketer’s Tech Stack.

Components of the Analytics & Marketing Reporting Stack
The Modern Marketing Reporting and Analytics Stack encompass 3 main components:
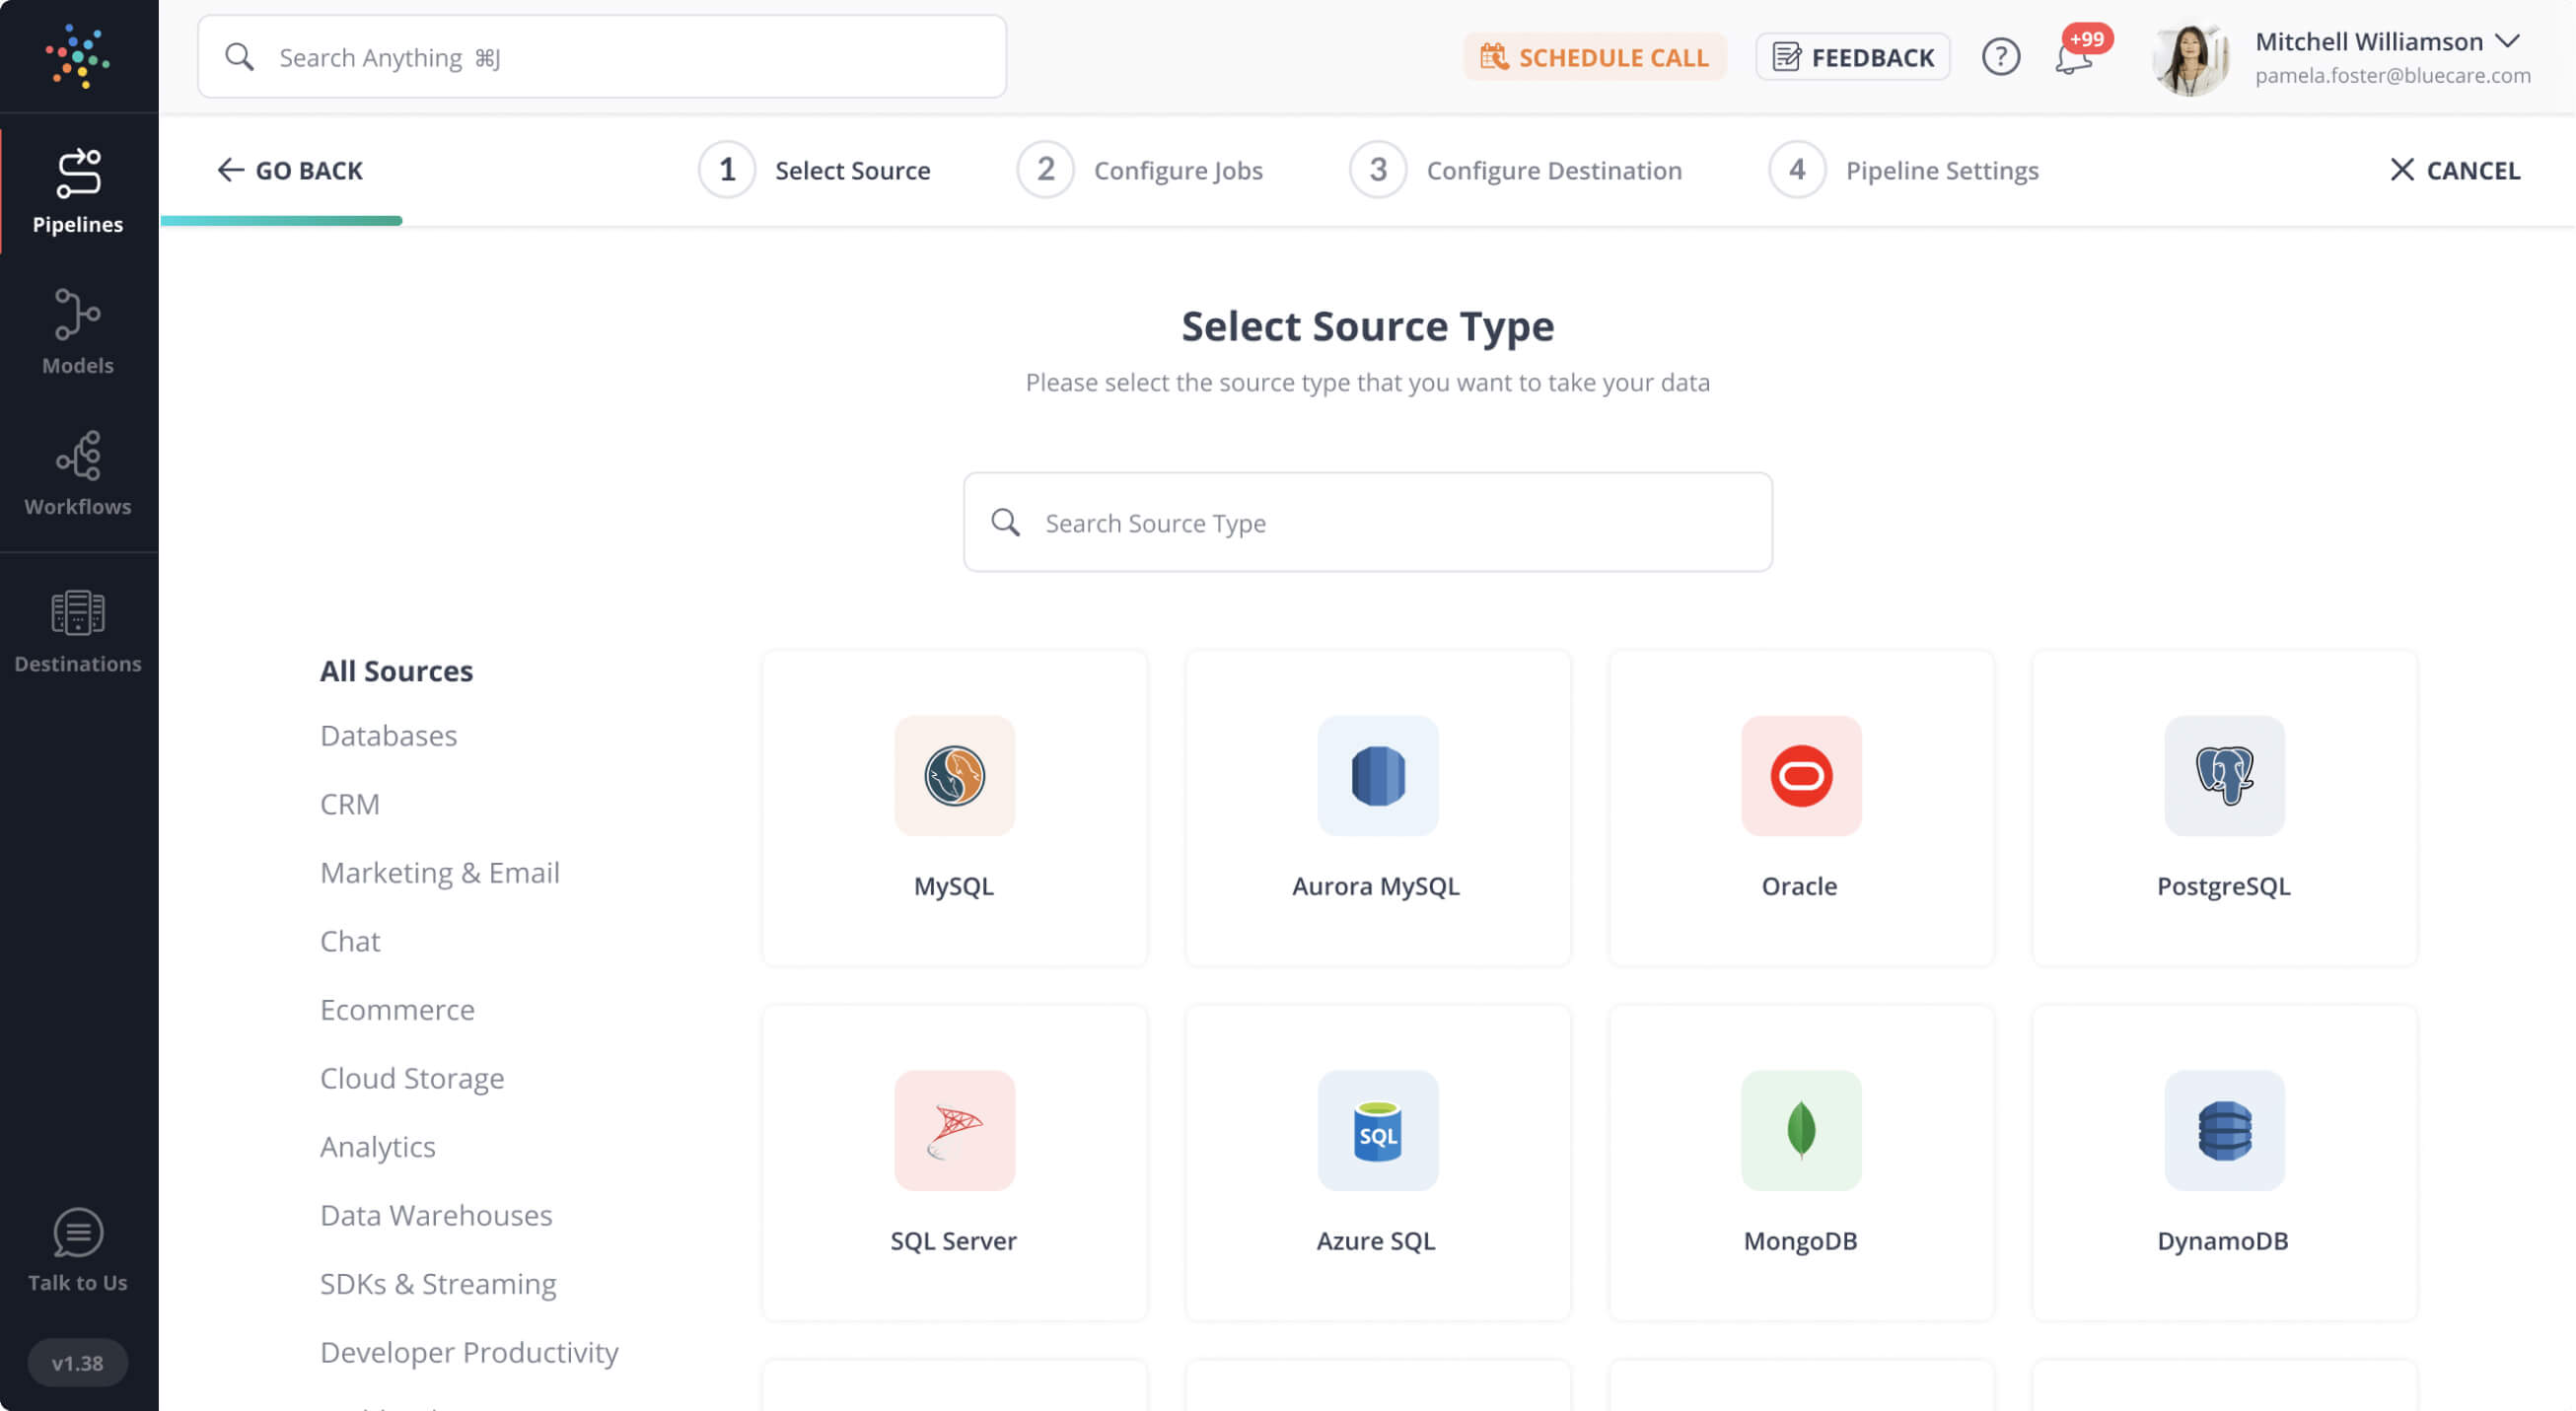
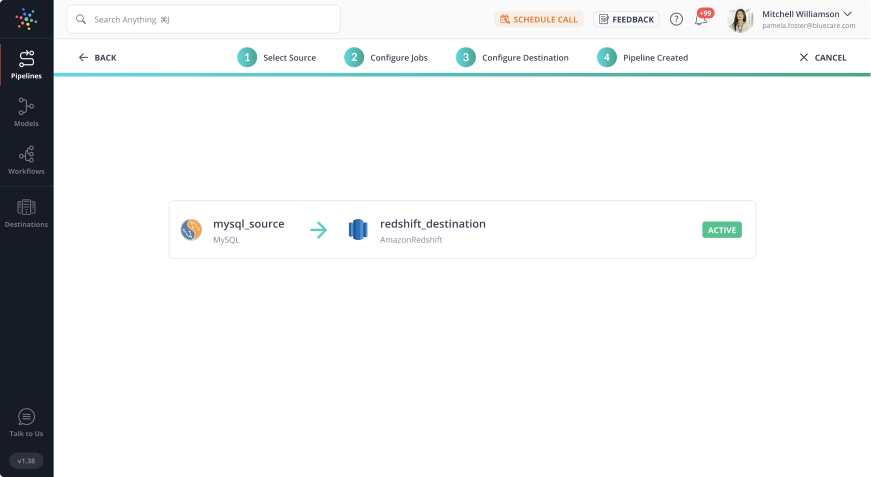
- Data Pipeline: A Data Pipeline moves your data from one system to another and can also transform it along the way. A robust Data Pipeline helps Marketers ETL (Extract, Transform & Load) unified data from numerous data sources to the destination of their choice, allowing them to create a Marketing SSOT (Single Source of Truth) with ease.
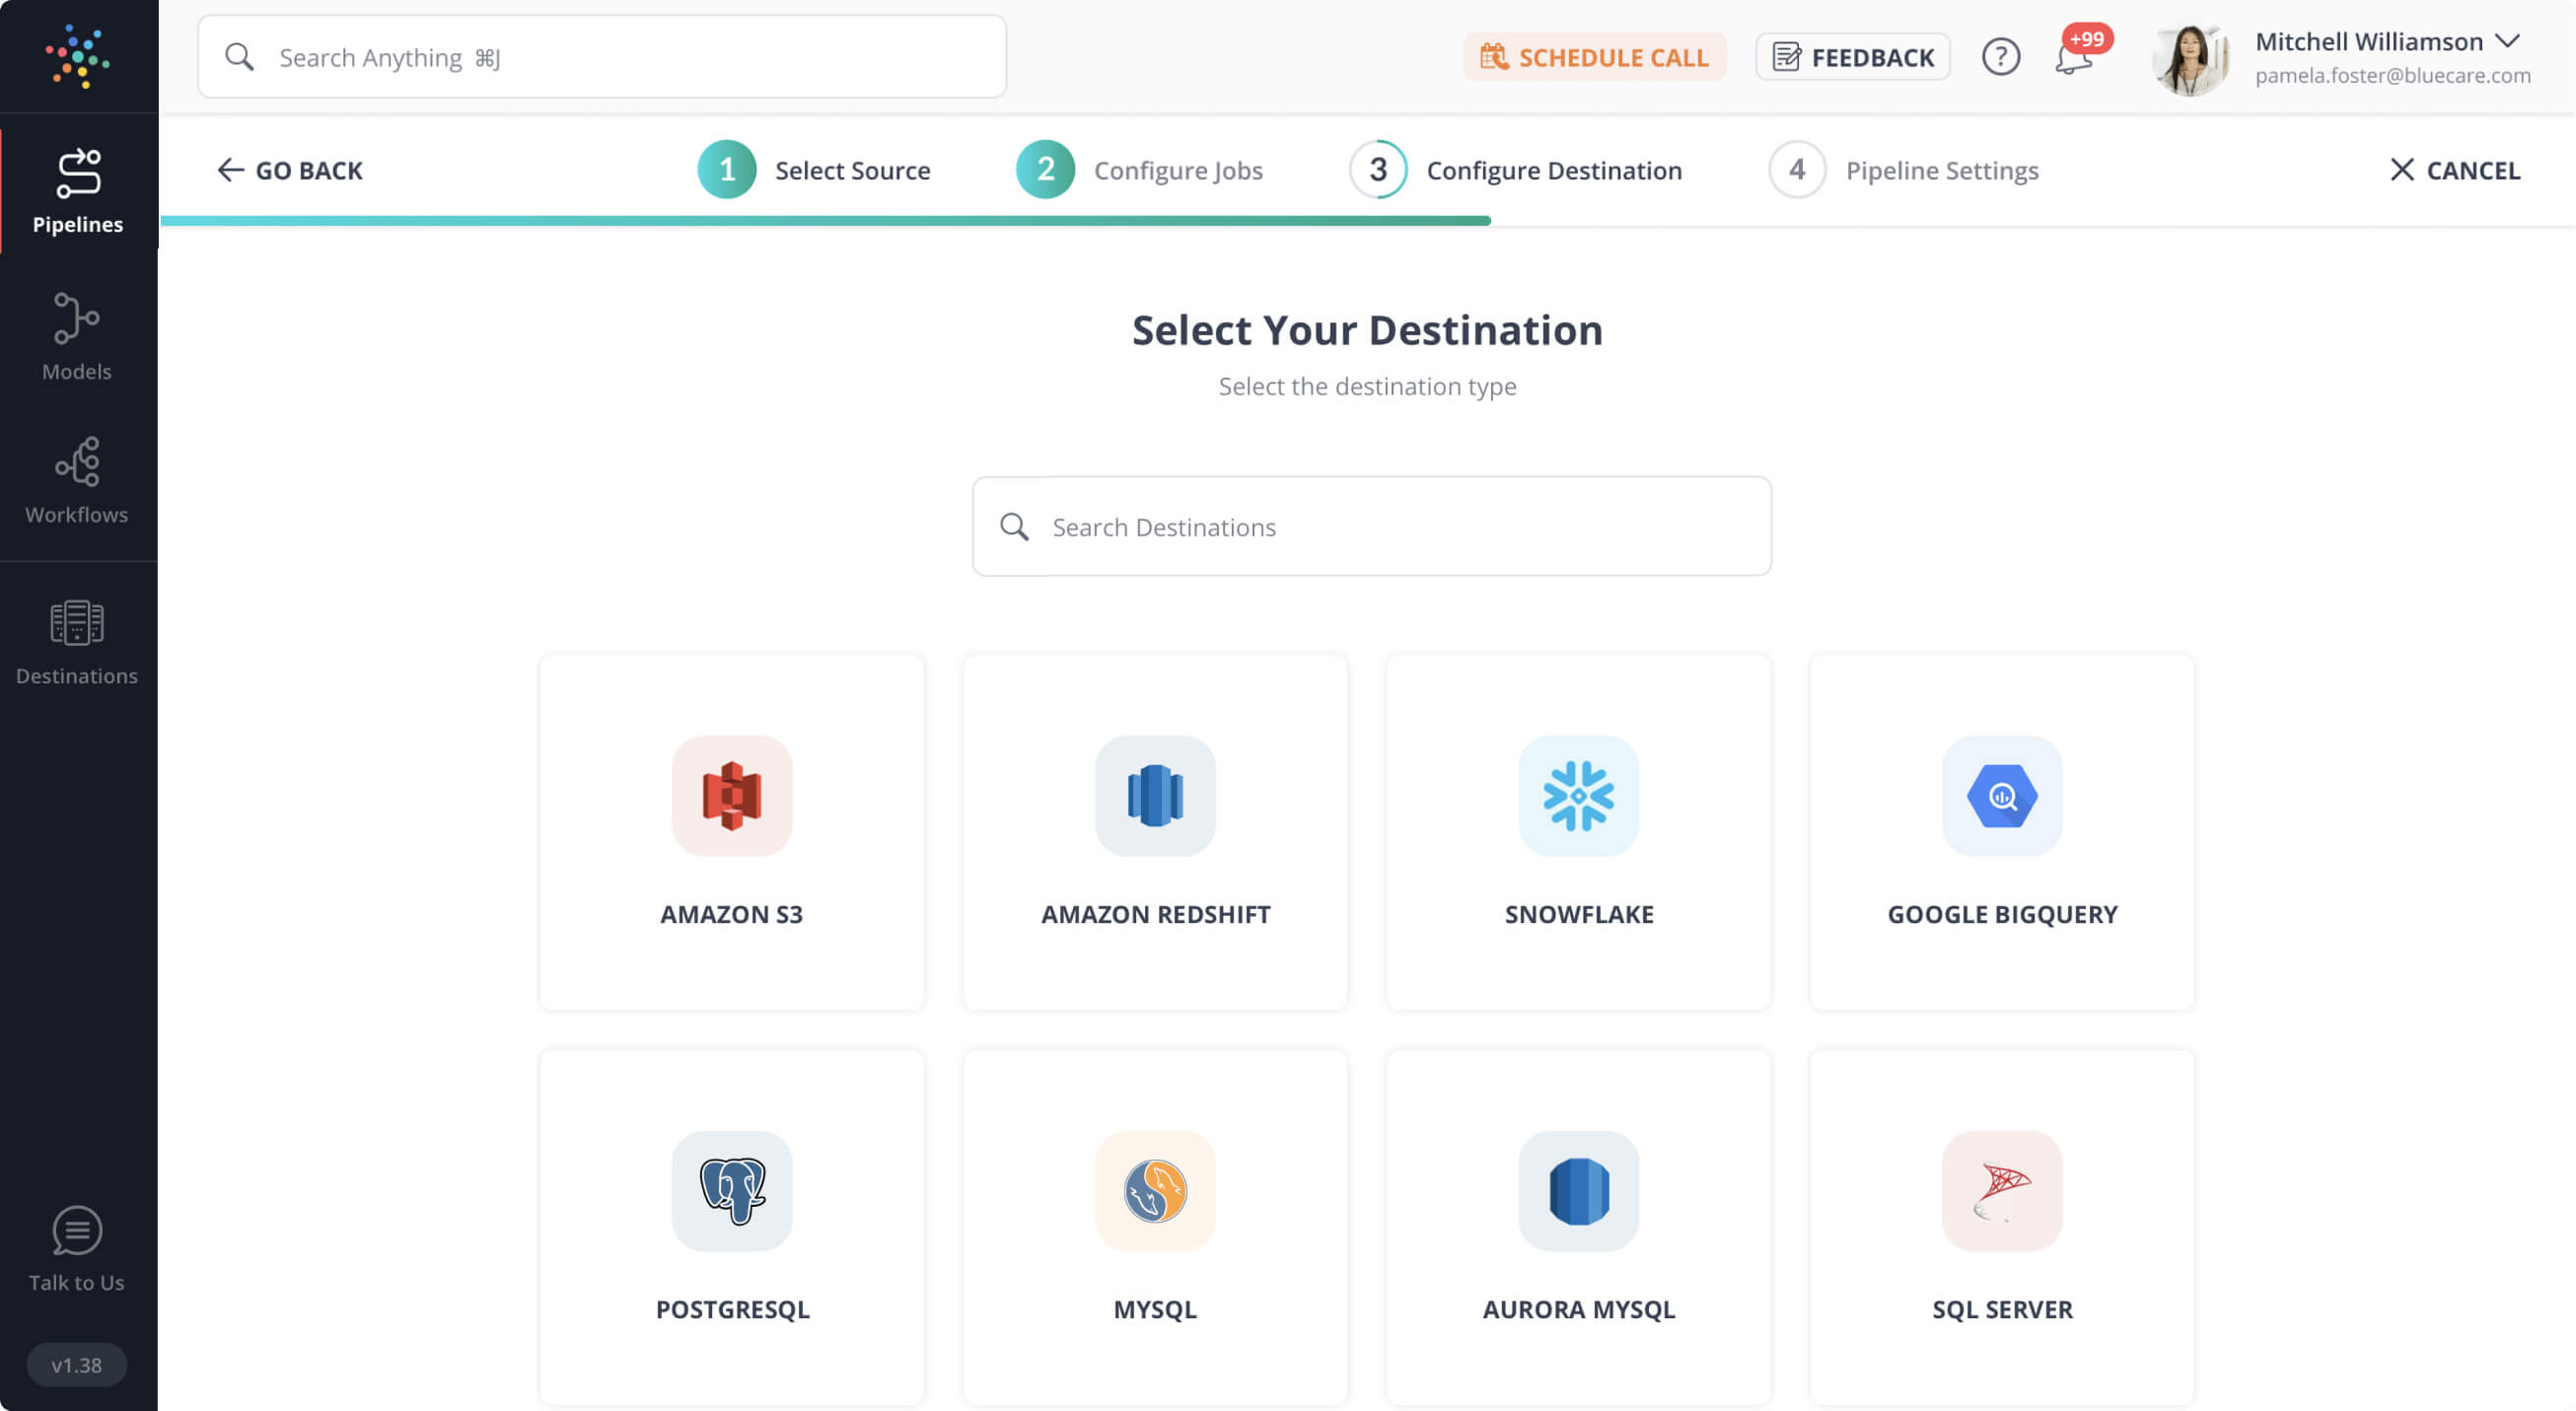
- Data Warehouse: Data Warehouses have the ability to handle vast volumes of complex data with ease. These further provide a holistic view and comfort of access to employees/users across an organization’s departments. Some of the popular Data Warehouses are Amazon Redshift, Google BigQuery, and Snowflake.
- Data Visualization: Data Visualization enables users to analyze and visualize their complex data gathered from numerous data sources as Informative Reports and Dashboards.
The figure below highlights the components of the Analytics & Marketing Reporting Stack:

The Extract, Transform & Load Process
Modern Marketing Reporting & Analytics Stack leverages the ETL process to extract data from data sources such as Social Media Platforms, Email/SMS services, Customer Service Platforms, Surveys, and a lot more. The ETL process consists of 3 steps:
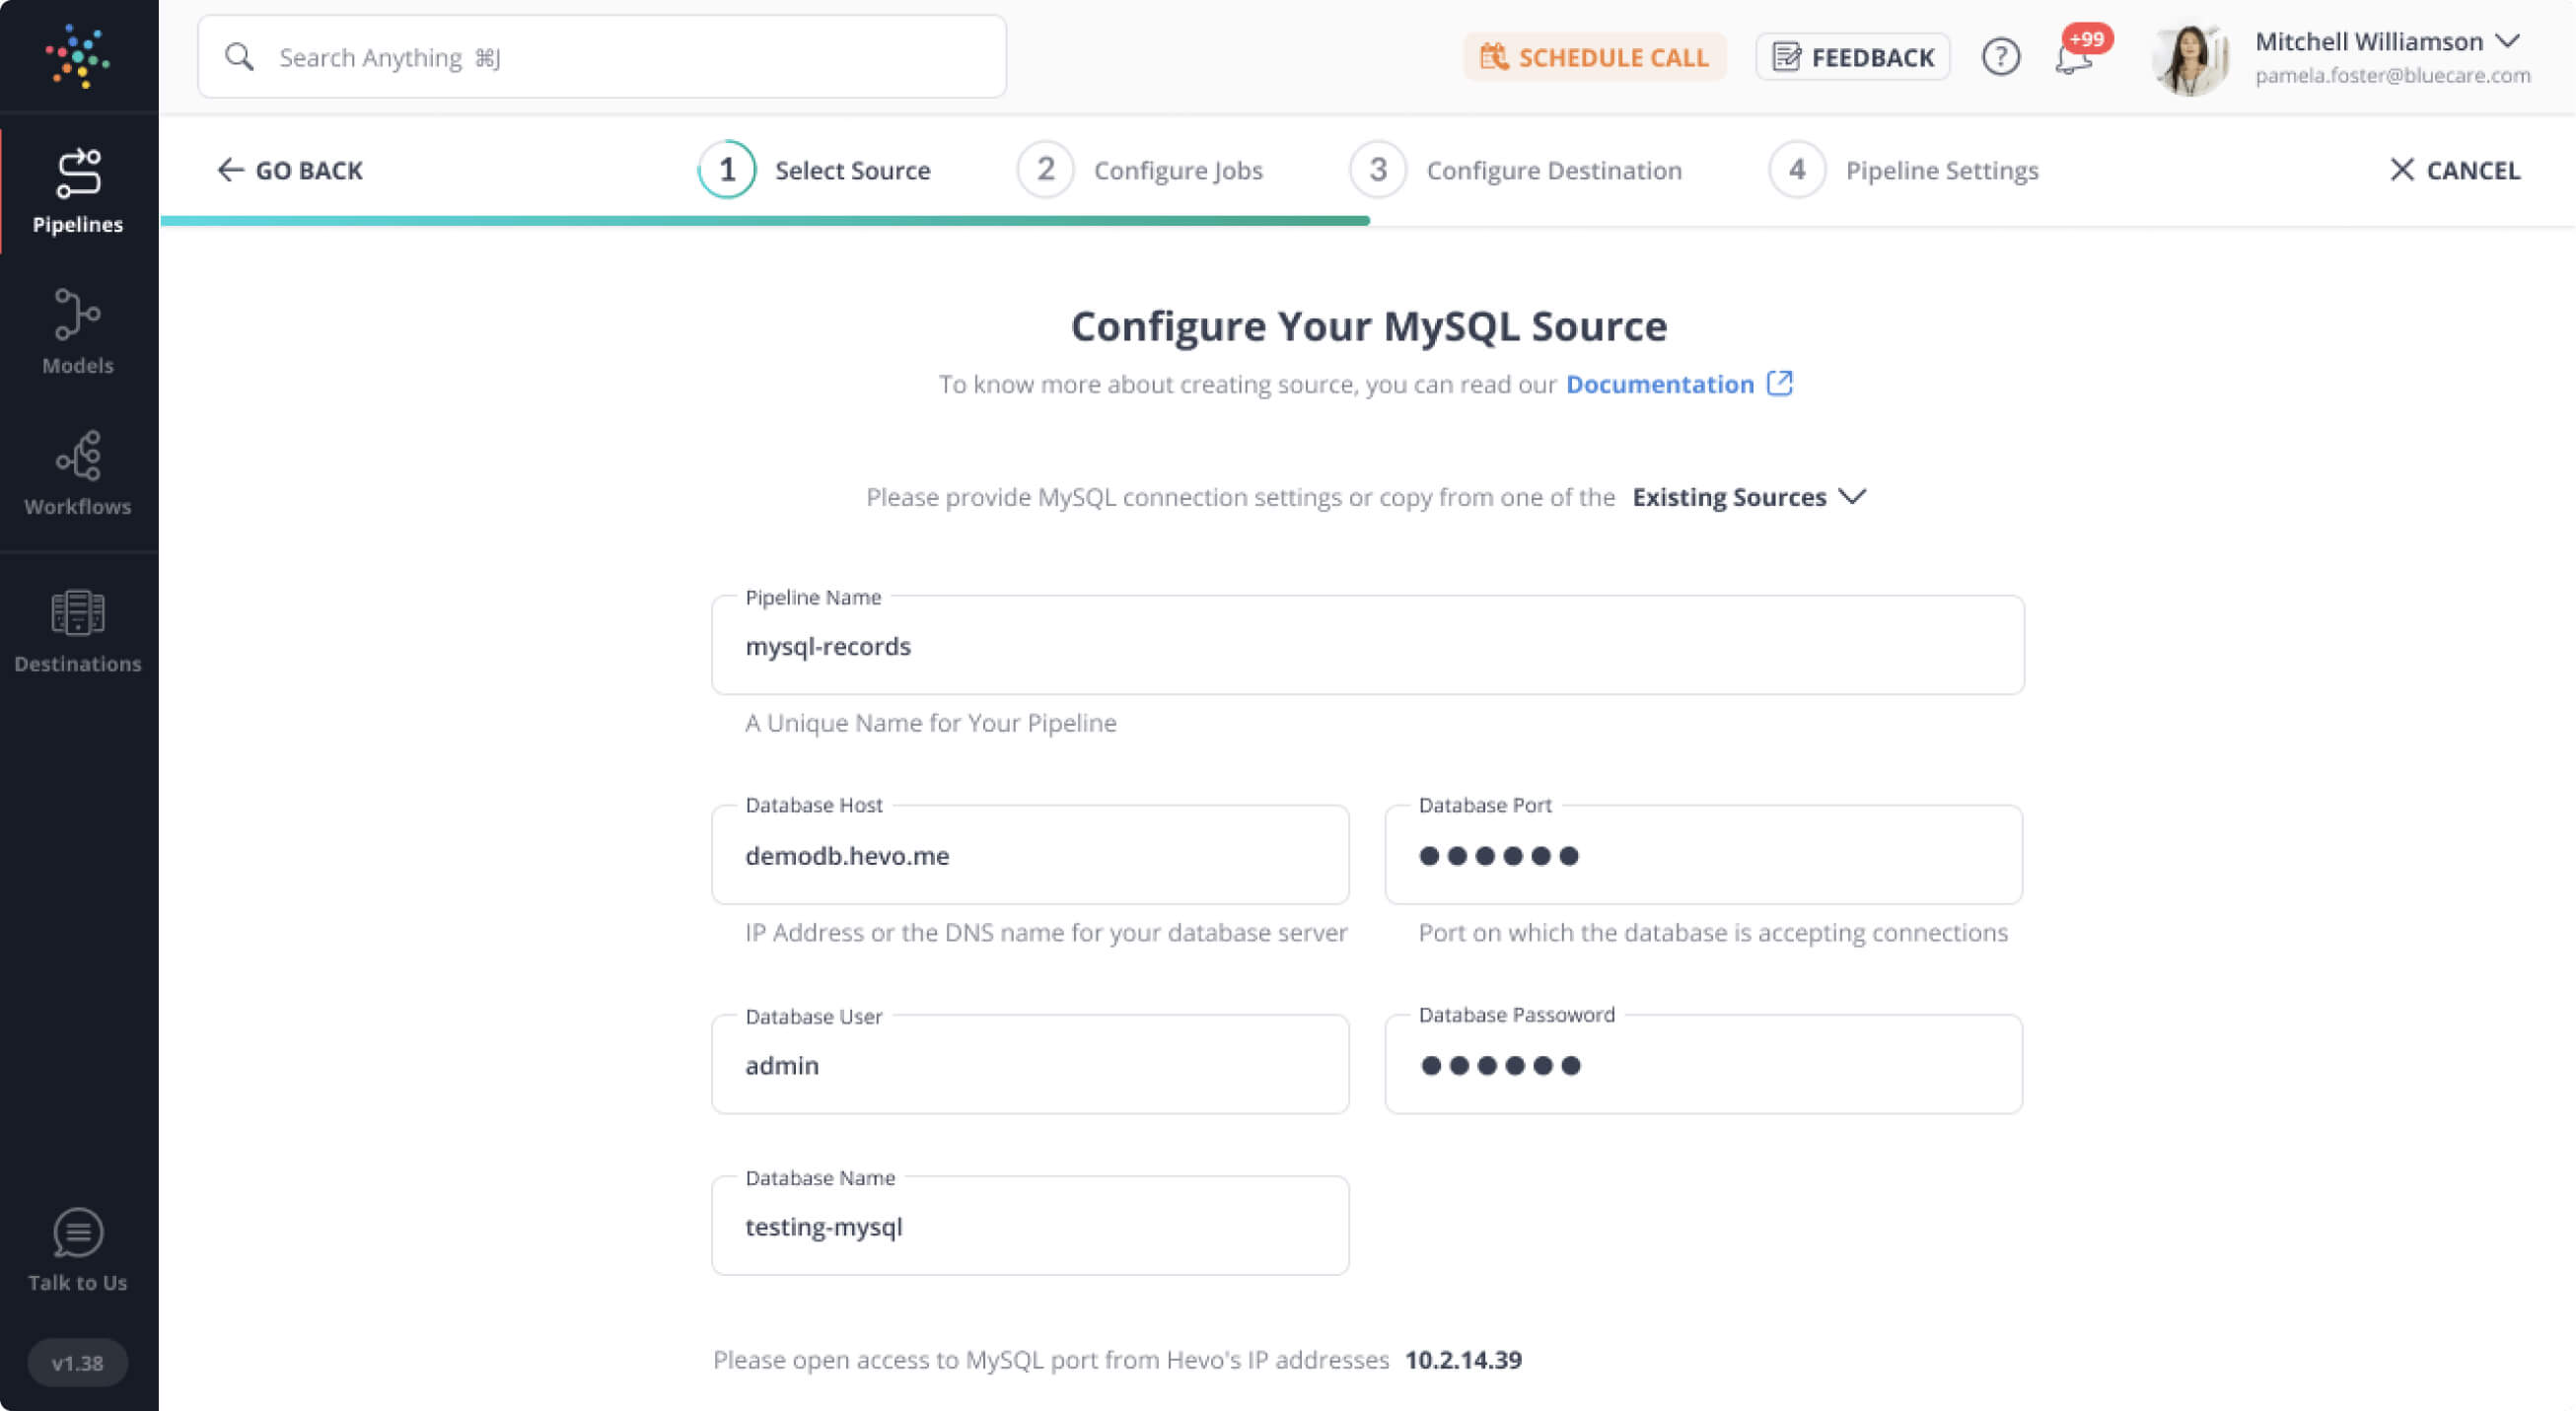
- Extraction: Extraction is an essential part of the ETL process as it helps unify Structured and Unstructured data from a diverse set of data sources such as Databases, SaaS applications, files, CRMs, etc. Extraction Tools simplify this process by allowing users to extract valuable information in a matter of a few clicks. All this is done without having to write any complex code.
- Transformation: Transformation is the process of converting the extracted data into a common format so that it can be better understood by a Data Warehouse or a BI tool. Some transformation techniques include Sorting, Cleaning, Removing Redundant Information, and Verifying the Data from data sources.
- Loading: Loading is the process of storing the transformed data into a destination, normally a Data Warehouse, and also supports analysis of the data using various BI (Business Intelligence) tools to gain valuable insights and build reports and dashboards. The Loading stage is crucial in Marketing Reporting as reports are made using the data present after this stage.
The given figure highlights the stages of the ETL process:

How to Create Insightful Marketing Reports with Unified, Accurate, and Real-Time Data?
To enhance Marketing Performance, having accurate and actionable customer insights is of paramount importance. Hence, implementing an effective Marketing Reporting process is essential. Marketers must ensure the real-time availability of accurate & consistent unified data and leverage the right set of tools to build Reports aligned with business objectives. This can be done in 3 steps:
- Picking a Sensible Decision for your Marketing Report
- Laying Out & Styling the Marketing Report
- Creating Effective Graphs for your Marketing Report
1) Picking a Sensible Decision for your Marketing Report
One of the main goals of a Marketer is to design Marketing Reports to better understand customers and help the company make strategic decisions. This decision helps to design dashboards that can visualize your thoughts and ideas around that decision. After arriving at the decision, you need to make a list of all the data that might be relevant.
Some of the most crucial factors, you must take into consideration while capturing data are as follows:
- What are the odds the data collected can make you change your decision?
- Can the data be segmented for better understanding?
- How long will it take to add this data to the report?
- Is the information for ruling something out or helping weigh a decision?
To answer all the above questions, Marketers must understand the type of data they need to deal with. This includes Individual Keyword Ranking, Individual Keyword Clicks, and the Number of Indexed Words.
2) Laying Out & Styling the Marketing Report
The appearance of a Marketing Report is as crucial as the content it has. Hence, Marketing Reports must be designed keeping in mind the layout you need. It is completely fine if reports are large as long as they can explain to customers the details of your product/service in a simple manner. Complexity is good as long as it is accompanied by depth all in one frame.
You can design multiple reports too as long as you can make all your customers and employees better understand the product/service and the decisions you make. One way to do this is by dividing reports into sections and focussing on each section individually. You can use tools like Google Data Studio to divide reports into sections so that you can focus on each section of the report individually.
An example of this technique is shown below.

3) Creating Effective Graphs for your Marketing Report
Graphs are one of the most crucial elements of Marketing Reports and Dashboards as these not only make the Reports visually appealing but also help users understand the data better. Additionally, these graphs help break down & simplify complex metrics, thereby summarizing the data effectively.
Conclusion
Marketing Reporting and Analytics plays a pivotal role in helping Marketers analyze their customers, business requirements and effectively refine their strategies, allowing them to provide a more personalized experience and enhance customer loyalty & engagement. It is imperative to automate the traditional ways of Marketing Reporting as this helps Marketers get a holistic view of their customers and processes easily. By automating their Marketing data reporting process, Marketers can make informed data-driven decisions, build insightful reports, and draw quality insights from their unified data.
If you’re wondering how you can truly automate your Marketing Reporting process, then our Masterclass on Marketing Analytics can be your one-stop-shop solution! In this Masterclass, you will also learn the latest Marketing Analytics trends, tips, and strategies directly from the global marketing thought leaders. There will be 7 on-demand video courses covering 26 different topics and 1 live Q&A session at the end of this course. Book your seat today and get ready to automate your Marketing Reporting with Unified Data like never before.
Sign up today for our Dcode Marketing Analytics Masterclass and join us with Claudia Ring (Head of Growth at DeepGram) and six other industry thought leaders. It’s a free, on-demand virtual Masterclass specially designed for Marketers & Growth Analysts. Learn how to harness the power of Marketing Data & Analytics to drive business growth like never before!
You can check out our highlight video below:
Share it with your connections.
-
 Share To X
-
 Share To LinkedIn
-
 Share To Facebook
-
 Copy Link