


Every business should do whatever it takes to understand its customers better. It will help the business to know what its customers like and what they don’t like about their products. The best way for a business to understand its customers is by analyzing their behaviour. However, it’s difficult to analyze numerical customer behaviour data. There is a need for a technical tool that can help businesses extract insights from customer behaviour data and Amplitude is considered one of the best tool for it.
Amplitude helps you create a dashboard with several graphical elements to visualize data. It becomes easy for the business to extract meaningful insights from numerical data for sound decision making. In this article, you will be learning how to set up an Amplitude dashboard.
Table of Contents
Prerequisites
This is what you need for this article:
- An Amplitude account.
Effortlessly manage and migrate your Amplitude data with Hevo. Hevo supports MongoDB as one of its 150+ data sources, ensuring seamless data integration and real-time synchronization.
- No-Code Solution: Easily connect and manage your Amplitude data without writing a single line of code.
- Flexible Transformations: Use drag-and-drop tools or custom scripts for data transformation.
- Real-Time Sync: Keep your destination data warehouse updated in real time.
- Auto-Schema Mapping: Automatically handle schema mapping for a smooth data transfer.
Join over 2000 satisfied customers, including companies like Voiceflow and Playtomic, who trust Hevo for their data integration needs. Check out why Hevo is rated 4.7 stars on Capterra.
Get Started with Hevo for FreeWhat is Amplitude?
Amplitude is a tool for analyzing user behaviour data. Product, marketing, and growth teams use it to extract insights about user behaviour from numerical data for decision making. Knowledge about user behaviour can help a company come up with new strategies to improve user engagement, retention, and revenue.
The following are the key features offered by Amplitude:
- Real-time User Analytics: It includes retention, funnels, revenue analysis, and flexible user segmentation.
- Growth Discovery Engine: It helps you to predict behaviours that predict conversation or retention and drive exponential user growth.
- Microscope: It helps you to analyze the user behaviour behind any data point. You can also make a comparison between the behaviour of engaged and churned users.
You can create an Amplitude dashboard and add various visual elements to it. Amplitude is highly preferred over its competitors by managers. The reason is that it makes it easy to extract insights from data. Some of the most popular companies that use Amplitude are OrderAhead, StackShare, and Intuit. In the next few sections, you will be learning how to create and edit an Amplitude dashboard.
How to Set up an Amplitude Dashboard?
In this section, you will learn how to work with Amplitude dashboard in detail.
This section is structured as follows:
- Create a New Dashboard
- Add to the Sidebar
- Add a Chart to the Dashboard
- Add Behavioral Cohort to Dashboard
- Chart Width
- TV Mode
- More Options
- Share
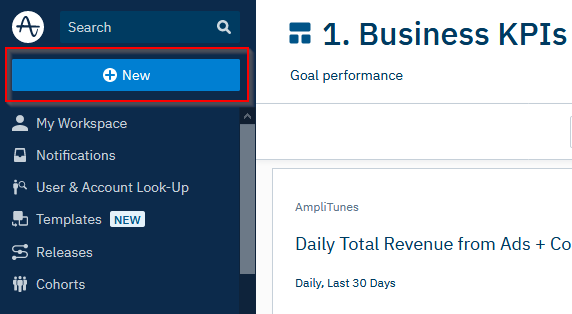
Create a New Dashboard
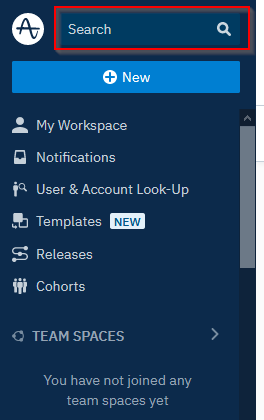
To create a new dashboard, click the “+ New” button located on the top left corner of the screen.
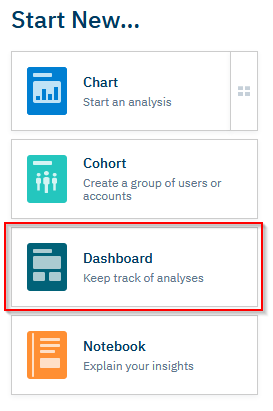
A new window will be opened, showing several options. Choose the “Dashboard”.
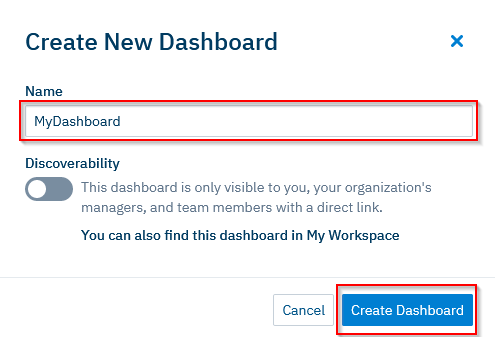
Type the name of the dashboard in the new window and click the “Create Dashboard” button.
The new dashboard will be shown in the workspace.

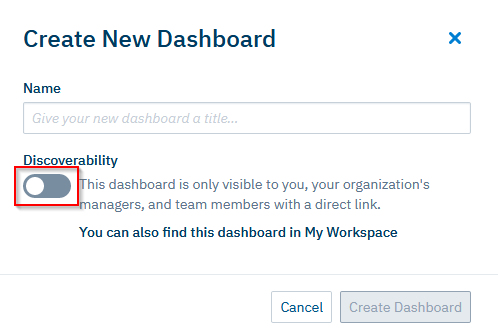
By default, the dashboards are private or undiscoverable. However, you can make them discoverable using the Discoverability toggle button.
You can use the search bar shown on the top left corner of the screen to search for discoverable dashboards and charts.
Add to the Sidebar
When you create a dashboard, it will be automatically added to the left sidebar. You can find it by scrolling downwards using the vertical navigation bar.
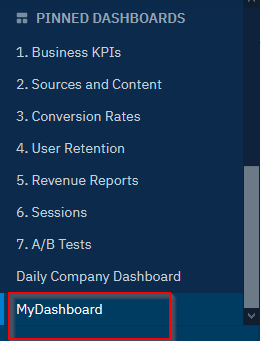
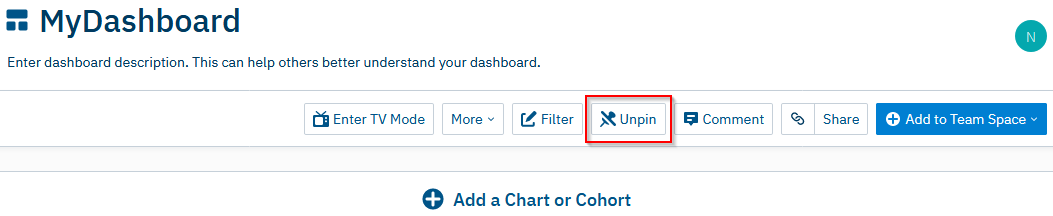
You can browse for any discoverable dashboards and pin it to the left sidebar. In the Dashboard menu, Pin will pin the dashboard to the left sidebar while Unpin will remove the dashboard from the left sidebar.
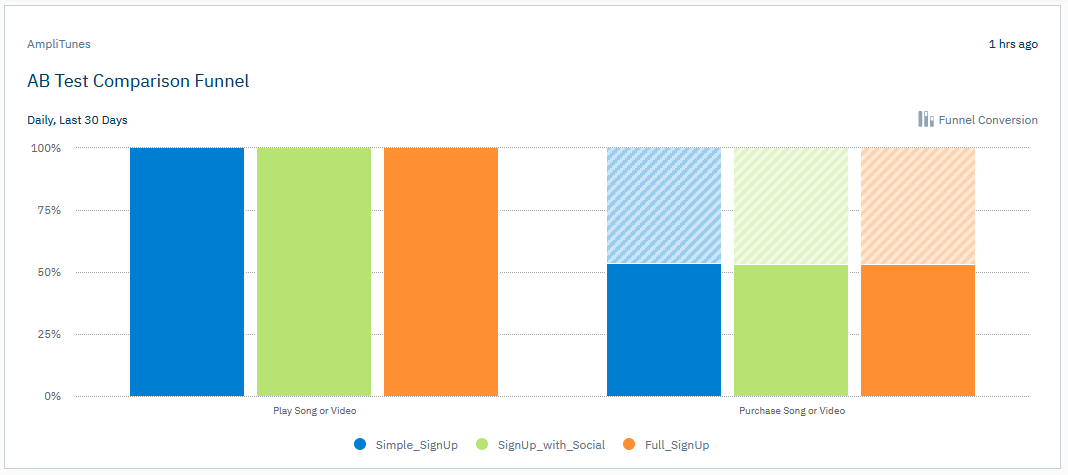
Add a Chart to the Dashboard
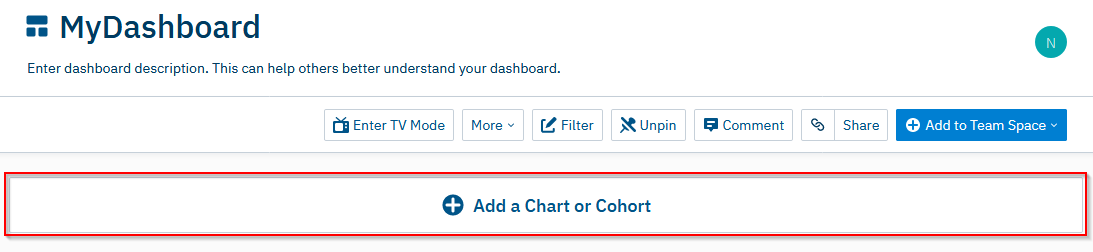
A chart is a used for visualizing data. Amplitude allows you to add a single chart or multiple charts to your dashboard. You should save the chart before adding it to the dashboard. You can add the chart to your dashboard when saving the chart. Click the “+ Add a Chart or Cohort” button from the dashboard workspace.
The “Add to Dashboard” window will pop up from the right side of the screen. Identify the chart that you need to add to the dashboard, point to it with the mouse cursor, and click the “Add Item” button.
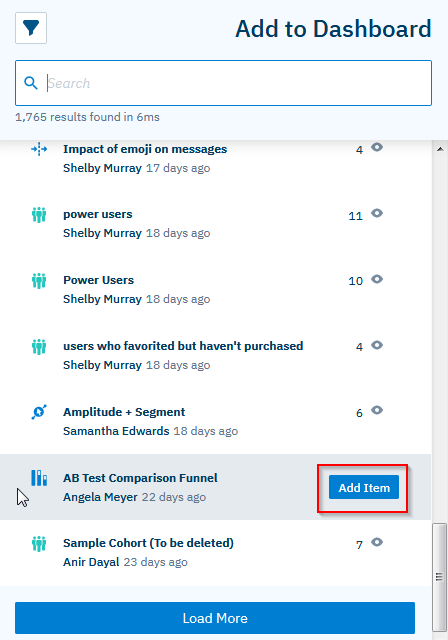
You can also search for the chart that you need using the search bar.
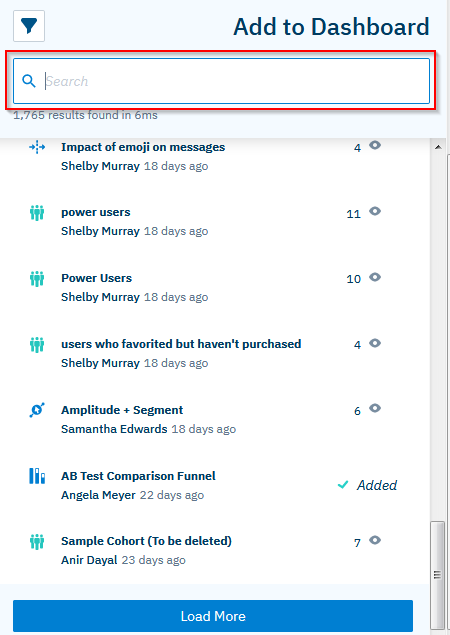
The chart you’ve chosen will be added to the dashboard.
You can also open the chart to be added to the dashboard, click the “+ Add to” button and select the dashboard where the chart needs to be added.

Add Behavioral Cohort to Dashboard
You can add a Behavioral Cohort to your dashboard, and see the number of users in a cohort and the last time it was computed. You have to open the Cohort, and click the “+ Add to” button. You can select the dashboard to which you need to add the cohort.

You will be able to monitor the number of users in a cohort from the dashboard.
Chart Width
You may want to have a full-width chart. Click the settings icon and choose “Resize”.
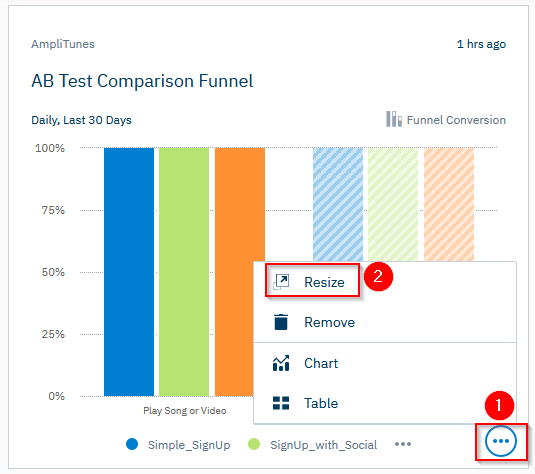
The chart will be made full-width.
TV Mode
If you want to show your dashboard in full-screen mode, click the “Enter TV Mode” button.
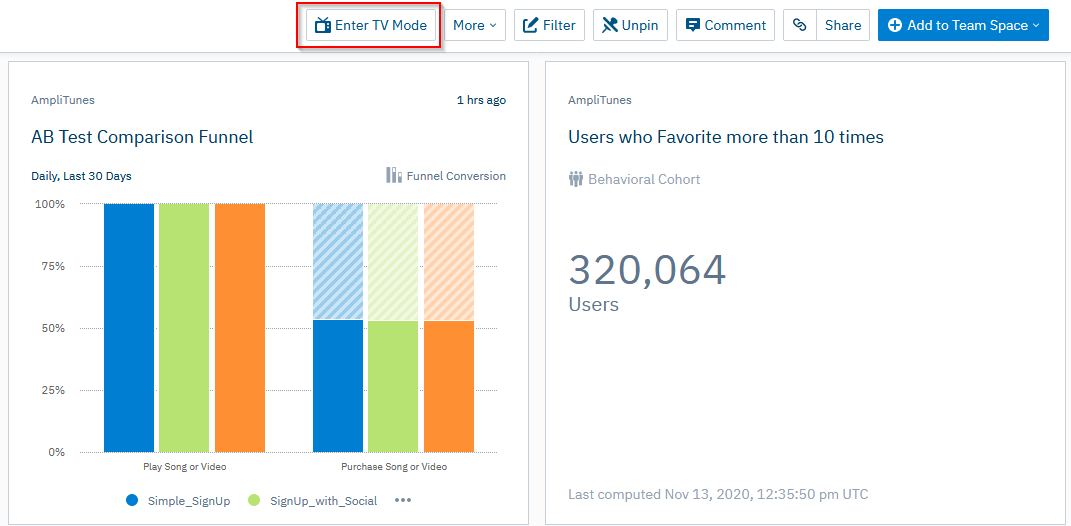
It is good for displaying dashboards on shared monitors or TV screens. When you are in the TV mode, the dashboard will be refreshed after every 5 minutes. However, the charts added to the dashboard will be refreshed according to the rates listed in Cache Times.
More Options
The “More” button comes with a number of options as shown below:

These options are described below:
- Copy: It creates a duplicate version of the dashboard for you to edit. You will become the owner of the copied dashboard.
- Subscribe: It helps you to subscribe to a dashboard to get an HTML formatted email report with optional CSV files.
- Download Chart CSVs: It creates a CSV downloadable file for every chart on the dashboard, and each file will have a summary of the chart and the URL to the dashboard, the events, and the segments and/or user properties.
- Templatize: It allows you to create a template based on an existing dashboard.
- Refresh All Charts: It refreshes all charts and re-computes all cohorts in the dashboard to get the latest information.
- Archive: You can archive your dashboard. It should be done when the dashboard is no longer supported or used.
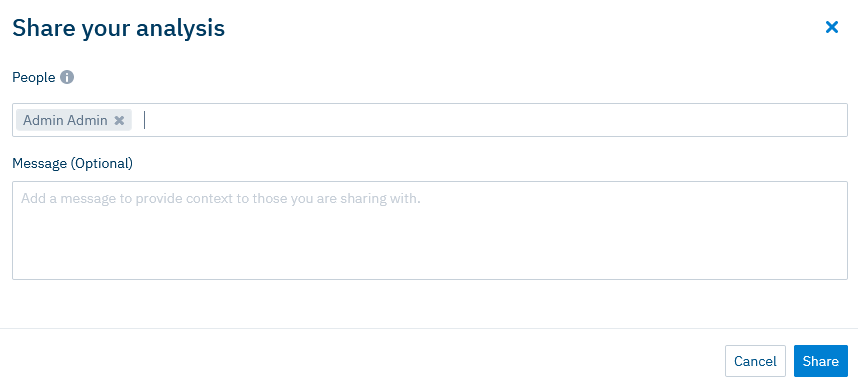
Share
This button allows you to share your dashboard with more viewers via email. When you click it, a new window will pop up asking you to enter the email addresses of the dashboard recipients.
Limitations
The following are the limitations associated with Amplitude dashboard:
- Amplitude does not provide its users with standard dashboards – ready for use. You have to set up a dashboard from scratch.
- Amplitude dashboards have limited functionality. You can only add basic tools to your Amplitude dashboard, and these only provide limited functionality.


Conclusion
In this blog, you’ve learned more about Amplitude, how to set up an Amplitude dashboard from scratch, and the limitations of Amplitude dashboards. You can use Amplitude to analyze user behaviour and draw insights from it. But, if you want to consolidate your user data from multiple sources before analysis, then try Hevo.
Hevo is a No-code Data Pipeline. It supports pre-built integrations from free sources like Amplitude along with other 100+ data sources at a reasonable price. With Hevo, you can integrate your user data in real-time and get useful insights with Amplitude.
Share your experience of creating an Amplitude dashboard in the comment section below. You can also have a look at the unbeatable pricing that will help you choose the right plan for your business needs.

Share it with your connections.
-
 Share To X
-
 Share To LinkedIn
-
 Share To Facebook
-
 Copy Link


