


Are you looking to perform Amplitude data analytics? We have you covered. Data is a rich source of knowledge. A business that uses data to make its decisions will have a competitive advantage over its competitors. The business will be able to make sound decisions regarding running and management of the business. However, it’s not always easy for businesses to extract knowledge from data, especially when huge volumes of data are involved.
There is a need for a tool to help businesses extract knowledge and information from raw data in the easiest way possible. Amplitude is the right tool for this. It helps businesses understand their customers better by analyzing customer data. In this article, we will be discussing how to use Amplitude for Data analytics.
Eliminate repetitive data requests and empower teams to self-serve insights with AI-driven automation.
- Reduce manual reporting and focus on analytics
- Get real-time insights without writing SQL
- AI-powered responses tailored to your data
- Connects with your existing business tools
Table of Contents
What is Amplitude?
Amplitude is a tool for analyzing user behaviour data. Product, marketing, and growth teams use it to extract insights about user behaviour from data for decision making. Knowing more about user behaviour can help a company come up with new strategies to improve user engagement, retention, and revenue. This is exactly what Amplitude helps businesses achieve.
The following are the key features offered by Amplitude:
- Real-time user analytics including retention, funnels, revenue analysis and flexible user segmentation.
- Growth Discovery Engine- Helps you predict behaviours that predict conversation or retention and drive exponential user growth.
- Microscope- Helps you to analyze the user behaviour behind any data point. You can also make a comparison between the behaviour of engaged and churned users.
You can create an Amplitude dashboard and add various visual elements to it to visualize your data. Amplitude is highly preferred by managers compared to its competitors. The reason is that it makes it easy to extract insights from data. Some of the most popular companies that use Amplitude are OrderAhead, StackShare, and Intuit. In the next few sections, I will be showing you how to create and edit dashboards in Amplitude.
Data Analytics with Amplitude
Customer data is everywhere. Collecting data is one thing, but understanding it is another. That’s why you need data analytics. It takes raw data and turns it into something useful for your business.
It will tell you more about your customers in terms of how they interact with your app or website, the steps they take in a purchase funnel, customer retention rate, etc. In the next few sections, we will be discussing the various tasks involved when doing data analytics with Amplitude:
Event Segmentation
You can use event segmentation to create charts from events and event properties. These can be simple charts like users performing a particular event or complex formulas of events. Event Segmentation forms the core Amplitude chart that shows what users are doing in your product.
It offers the following capabilities:
- Measuring the events performed most over a selected period of time.
- Analyzing how frequently events are performed.
- Determining the number of unique users performing events on a particular product.
- Understanding the users who trigger certain events.
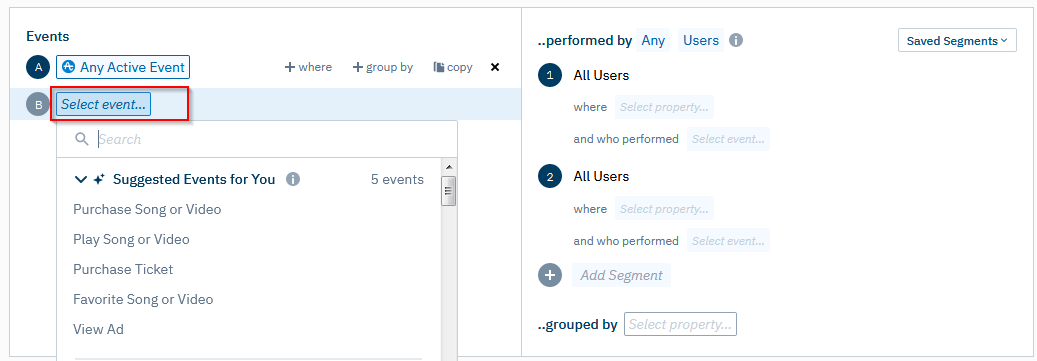
Click “Select Event” in the events module to see the available events. You will then be able to select the event whose data you need to view from the events module.
Types of Segments
There are different types of segmentation that you can choose on a chart. The Event Segmentation chart sets the right module for events to be “… performed by [Any] [Users]”.
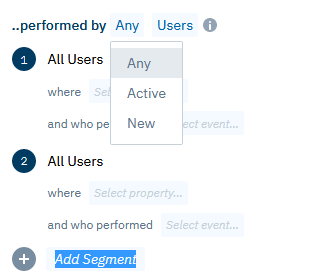
So, there are three options namely Any, Active, and New. Any denotes all users who’ve performed these events. Active denotes a user who has logged in one or more events during the specified time range. New denotes a user who logs their event for the first time with Amplitude.
Adding More Segments
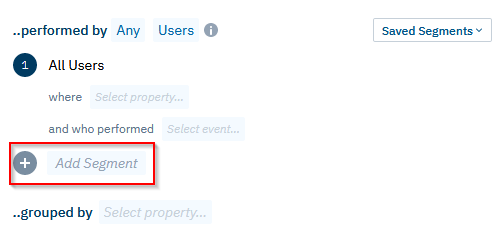
To add a new segment, simply click the “+ Add Segment” button.
Retention Analysis
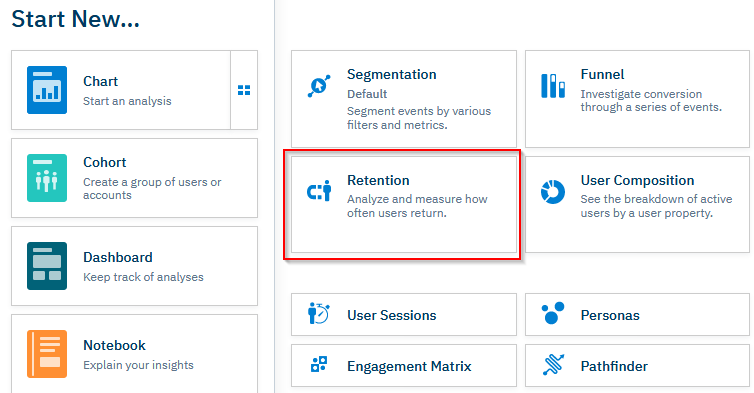
Retention analysis helps you know how often users return to your product after taking a particular action. Amplitude calculates retention data by comparing the date of that starting event to the date of return event that you have specified. When creating a retention analysis chart, you may choose any event that you like for the starting and return events. To create a new Retention Analysis chart, click the “+ New” button and choose “Retention”.
You will then be taken to the Retention analysis page where you can see the retention Analysis chart for your product.
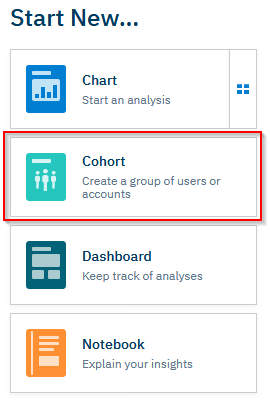
User Cohorting
User Cohorting helps you define a group of users depending on their actions. You can save that group for further analysis and understand the user behaviour better. You can also group the users based on their attributes like region, country, platform, etc. To define a new Cohort, click the “+ New” button and choose “Cohort”.
You will be taken to the Create Cohort page in which you can set parameters for the new Cohort.
Limitations
The following are the limitations of using Amplitude for Analytics:
- Amplitude can be overwhelming.
It is packed with features for slicing and visualizing data which can confuse non-analysts.
- It’s difficult to move data in and out of Amplitude.
You may have to rely on another platform like Segment for this.


Conclusion
This is what you’ve learnt in this article:
- You’ve learnt more about Amplitude.
- You’ve learnt how to perform Event Segmentation using amplitude.
- You’ve learnt how to perform Retention Analysis with Amplitude.
- You’ve learnt how to perform User Cohorting with Amplitude.
Hevo is a No-code Data Pipeline. It supports pre-built integrations from free sources like Amplitude along with other 150+ data sources at a reasonable price. Let Hevo integrate your services seamlessly without using any code.
Have any further queries? Let us know in the comments section below. You can also have a look at the unbeatable pricing that will help you choose the right plan for your business needs.

Share it with your connections.
-
 Share To X
-
 Share To LinkedIn
-
 Share To Facebook
-
 Copy Link


