Microsoft Excel for Data Analysts is one of the top tools and its built-in Pivot Table is unarguably one of the best and most popular analytical tools one could ask for. Data Analysts can use Microsoft Excel to create flexible Data Aggregation, represent data visually, calculate margins and other common ratios, etc.
This article will introduce you to Data Analysis and the importance of Microsoft Excel for Data Analysts. It will also teach you about various important features of Microsoft Excel for Data Analysts and their uniqueness.
Table of Contents
What is Data Analysis?
Data Analysis is the process of Collecting, Cleaning, Analyzing, and Mining Data, Interpreting Results, and Reporting the findings. It helps in the uncovering of patterns in data as well as correlations between various Data Points. Using these patterns and correlations, Data Analysts can generate insights and conclusions from the raw data.
Data Analysis also provides a means for responding to questions that can help organizations in improving business decisions for future actions by understanding past behavior and interactions.
Data Analysis allows businesses to sketch their action plan before committing to it. In addition, Data Analysis enables companies to develop products and services that appeal to their customers and help them identify new opportunities for revenue generation.
Hevo helps you migrate your data from multiple sources to a single destination, creating a single source of truth. Easily make your data analysis ready for your data visualization.
- Seamless Integration: Consolidate data from multiple sources into one destination.
- Single Source of Truth: Ensure accurate and consistent data for your analysis.
- Analysis-Ready Data: Transform and prepare your data for immediate use.
Experience hassle-free data migration with Hevo. Explore Hevo’s capabilities with a free personalized demo and see how you can benefit.
Get Started with Hevo for FreeWhat is Microsoft Excel?
Microsoft Excel has been around since it was initially released for the Apple Mac in 1984. When Microsoft finally launched its own computer and Operating System in 1987, it was re-engineered for a new platform and dubbed Microsoft Excel 2.0.
Microsoft Excel was launched to compete with VisiCalc, a Spreadsheet capable of 5 columns and 20 rows, which though seems primitive by current standards but was a revolutionary software in the 70s.
Drawing Capabilities, Toolbars, Add-in Support, Outlining, 3D Charts, and many other features were incorporated into the run-time version of Windows in 1990. The PDF format had not yet been established when Microsoft Excel was implemented, and it was not invented until 1993.
Fast forward to Microsoft Excel versions since the 2010s and beyond, today, the software has chart updates, recommendations for users to choose between Pivot Tables, and more, all aimed to improve Microsoft Excel for Data Analysts.
Importance of Microsoft Excel for Data Analysts
Microsoft Excel quickly rose to prominence as the most extensively used Spreadsheet software and became the industry standard for Spreadsheets. When it comes to analyzing and visualizing data, Microsoft Excel has long been the go-to tool for business professionals.
Not only do businesses use this software to do simple Mathematical Computations but also perform complex Data Analyses. The fundamental goal of any Data Analyst is to consolidate discrete Data Points and use them to create a cohesive narrative. Microsoft Excel can accomplish it at affordable prices.
Today, organizations are equipped with more advanced analytics tools than Microsoft Excel, however, it remains a part of a larger Data Ecosystem. The main reason behind this is the simplicity of Microsoft Excel for Data Analysts, its key features, and user familiarity with it. A Microsoft Excel Spreadsheet organizes data into a legible format, making it easier for Data Analysts to extract insights.
Microsoft Excel allows users to modify fields and functions that perform computations when working with more complex data. Additionally, it facilitates easy collaboration and works with multiple users together. In recent years Microsoft has added several additional features to Microsoft Excel for Data Analysts that can further the Analytical Applications of this Spreadsheet software.
Today, Microsoft Excel can serve as an excellent stepping stone for individuals new to Business Analytics as it can assist them in understanding the significance of numerous analytical activities before moving on to other tools such as Python and R. Its extensive set of Functions, Graphs, and Arrays enable Data Analysts to quickly grasp the basics of drawing insights from data that might otherwise be difficult to perceive.
Key Features of Microsoft Excel for Data Analysts
Listed below are the key features of Microsoft Excel for Data Analysts:
1) Pivot Table
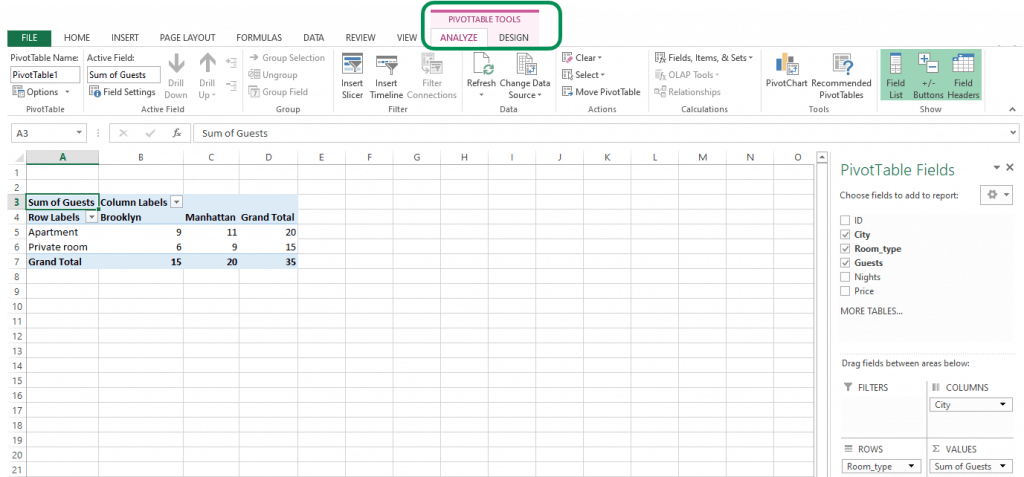
A Pivot Table is one of the most popular features of Microsoft Excel for Data Analysts. It is a summary table that lets users Count, Average, Sum, and Execute other calculations based on the reference feature that has been chosen. This helps in converting a data table into an Inference Table that aids Data Analysts in concluding.
Recognizing patterns in a small dataset is relatively easy, but the complexity of the larger datasets typically necessitates extra effort to find the patterns. A Pivot Table can be a tremendous help in these situations because it only takes a few minutes to summarise groups of data into one Pivot Table that highlights information required by Data Analysts. Once the Pivot Table is ready, it can be used to create a suitable Pivot Chart for visual analysis of the data by clicking on the PivotChart option.
Pivot Table is suitable for dealing with queries like, “What was the average number of customers for product A?” or “Which office branch made the highest quarterly sale on printers?”. It is a crucial part of Data Exploration in Microsoft Excel for Data Analysts.
2) Conditional Formatting
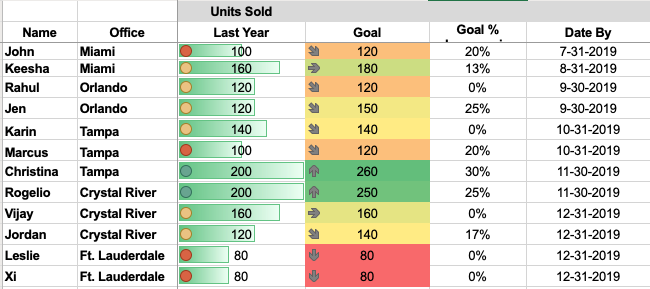
Conditional Formatting in Microsoft Excel for Data Analysts allows them to highlight cells in a specific color based on the value of the cell and the criteria set by them. It’s a great technique to graphically highlight information or detect outliers and trends in data.
For instance, this technique can be used to provide a Color Gradient to Employee scores to identify top performers with scores of 70 and above. This is what makes Conditional Formatting one of the important features of Microsoft Excel for Data Analysts.
3) LOOKUP
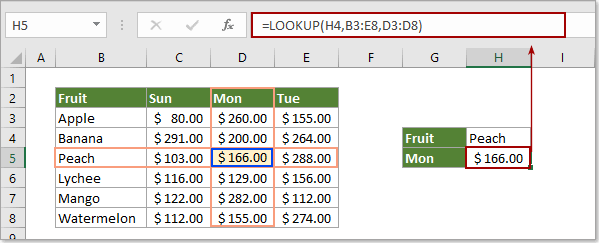
It is one of the most famous features of Microsoft Excel for Data Analysts, which enables matching data from a table with an input (LOOKUP) value. There are 2 ways of using this feature in Microsoft Excel for Data Analysts:
- Vector Form: The Vector Form of LOOKUP searches 1 row (HLOOKUP) or 1 column (VLOOKUP) for a value. It is used to specify the range containing the values that the Data Analyst wants to match. The V in VLOOKUP stands for Vertical Search (in a single column), while the H in HLOOKUP stands for Horizontal Search (within a single row).
- Array Form: The Array Form of LOOKUP looks for the given value in the first row or column of an Array and returns a value from the same position in the Array’s last row or column. If values to be matched are in the array’s first row or column, the Array Form of LOOKUP is helpful.
4) What-If Analysis
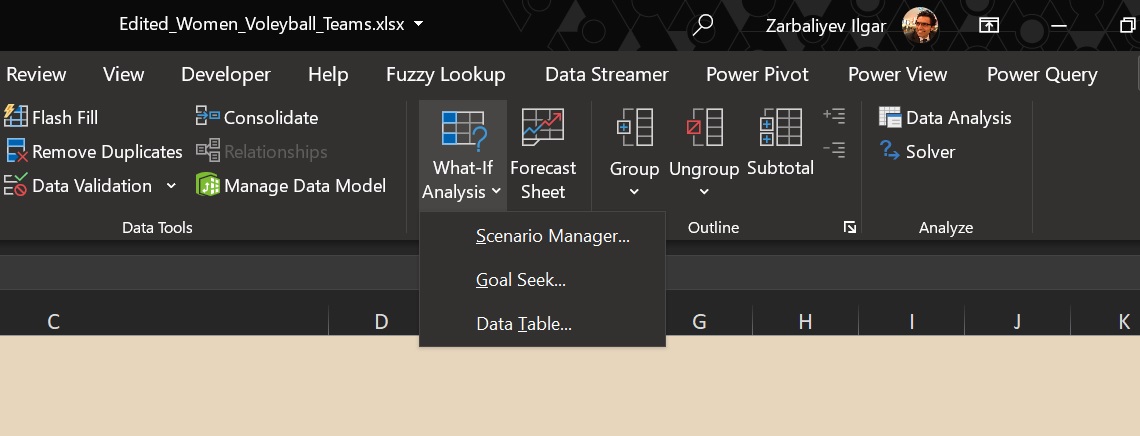
What-If Analysis allows Data Analysts to create different scenarios and easily compare results. This is accomplished by manipulating cell values to see how they impact the results of formulae on the Worksheet. Microsoft Excel for Data Analysts offers 3 What-If Analysis tools that can be used based on user requirements. These are:
- Data Tables: It is a collection of cells in Microsoft Excel for Data Analysts to modify the values in some of the cells and to get multiple solutions to a problem. It only works with 1 or 2 variables, but those variables might have a wide range of values.
- Scenario Manager: It takes into account more than 2 variables and generates scenarios for each combination of input values for the variables in question.
- Goal Seek: It involves a formula that utilizes a single variable input value to get the desired outcome. Goal Seek then tries to find a solution for the input value by changing the input value in the formula.
Goal Seek is used when users know the result of the formula, but the input information for this result is unknown. Data Tables and Scenario Manager, on the other hand, use a set of known input values and project them ahead to identify probable outcomes.
5) Data Visualization
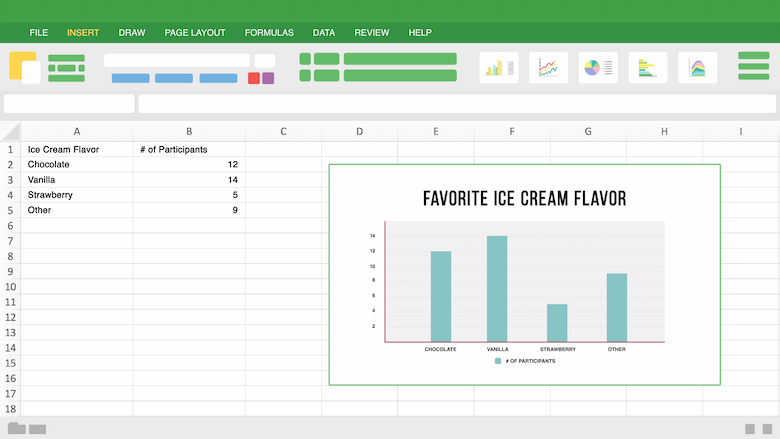
Microsoft Excel for Data Analysts offers 2 tools for Data Visualization, i.e. Charts and Pivot Charts. Microsoft Excel Charts help in understanding Data Analysis conclusions through Color, Simple Presentation, and Adaptability. There are different types of Charts available in Microsoft Excel, like
- Column Charts: Used for comparative Data Analysis,
- Pie Charts: Used for depicting Proportional Data,
- Linear Charts: Used for analyzing trends over a time period.
A Pivot Chart is the visual representation of a Pivot Table in Microsoft Excel for Data Analysts.
6) Functions
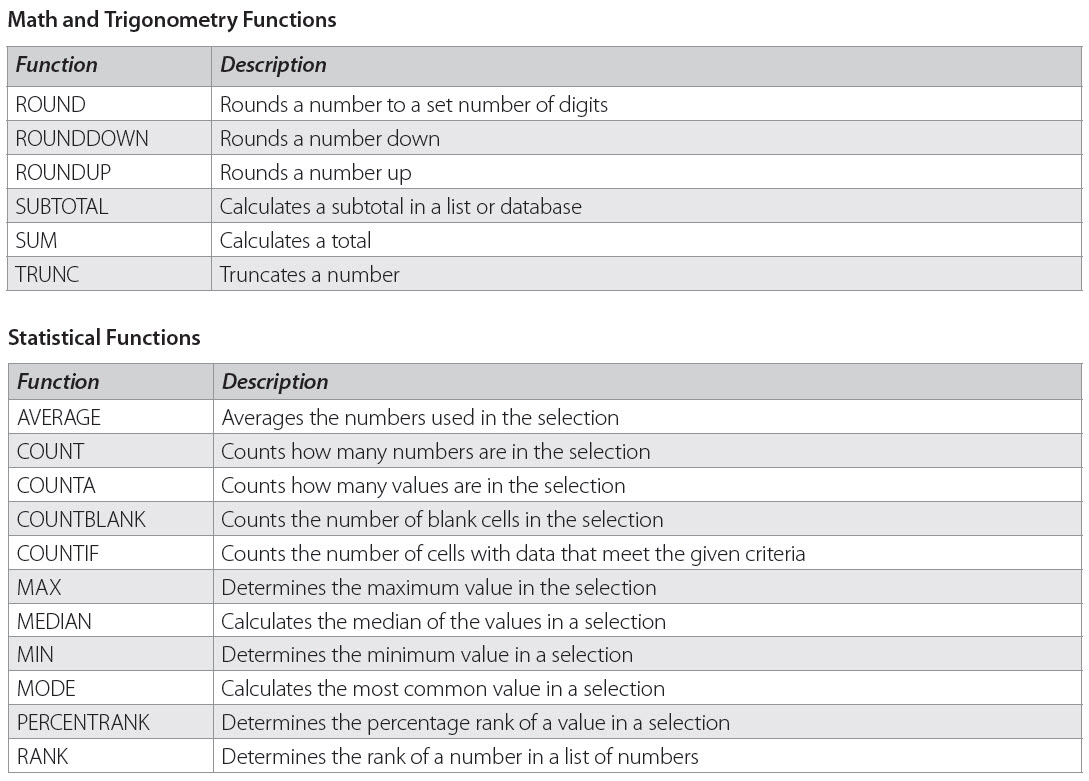
Microsoft Excel has around 400 Functions that help in Data Cleaning, Sorting, Filtering, and more. Each Function has its own unique application. Some common examples are:
- LEN: Used in Data Analysis to display the number of characters in any given cell.
- CONCATENATE: Combines the values of several cells into one.
- SORT: Arranges a list as per given parameters.
- SUMIFS: Sums values that meet specified criteria.
- COUNTIFS: Counts the number of times a value appears based on a single criterion.
- MEDIAN: Finds the middle number in a given array of numbers.
- TRIM: Removes unwanted spaces or characters from text.
7) Analysis ToolPak
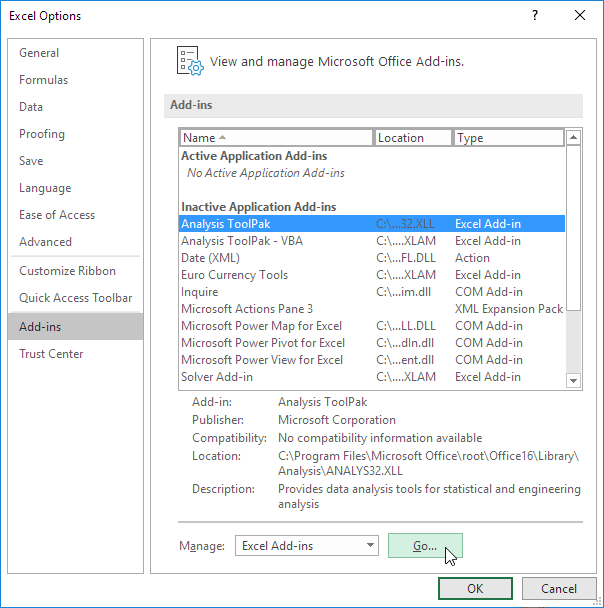
It is an add-in package in Microsoft Excel for Data Analysts that includes Financial, Statistical, and Engineering Data Analysis tools. Here, Data Analysts only need to provide input data and specific parameters, and the selected tool automatically performs the required calculations. Some of the tools are:
1) ANOVA
In Microsoft Excel, ANOVA (Analysis of Variance) is a statistical approach for comparing the differences between 2 or more Means. This allows the calculation of how much a particular variable affects the final result. Microsoft Excel offers 3 ANOVA features:
- Single Factor: Classifies data with only 1 nominal variable, which can have multiple values (categories) that may not be in order.
- Two-Factor with Replication: Classifies data along with 2 different variables. Here the total number of samples for either variable is uniform.
- Two-Factor without Replication: Classifies data along with 2 different variables. However, here there is only 1 observation for each combination of nominal variables.
2) T-Test
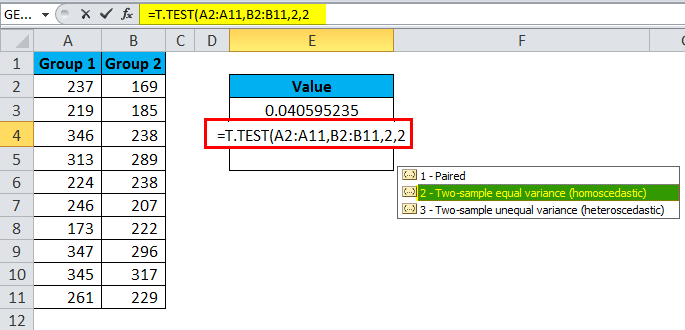
It is used for testing the probability value when comparing 2 sample Data Points, e.g., sales before and after running a promotional campaign. Microsoft Excel for Data Analysts offers 3 variants of the T-Test:
- Paired 2 Sample for Means: It is used when measurements or observations were paired naturally in a sample. For instance, insulin levels before and after receiving an insulin pump.
- Two-Sample Assuming Equal Variances: It is used when measurements are independent i.e., they were done on 2 different subject groups. For example, checking responses to biological stimuli in different age groups.
- Two-Sample Assuming Unequal Variances: It is also used when measurements are independent but when Variances are unequal.
3) Random Number Generator
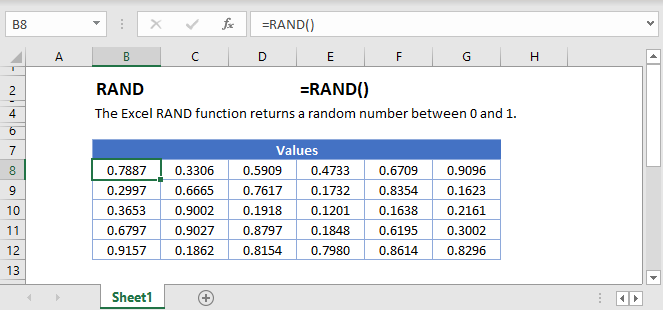
It fills a range with independent Random Numbers taken from one of several distributions. This is done using either the PRNG method, which utilizes mathematical formulae to generate sequences of Random Numbers, or by measuring a physical process that occurs outside of the computer.
The former generates fictitious Random Numbers, whereas the latter generates true Random Numbers. These Random Numbers are necessary during encryption or to populate a dataset with more values.
4) Descriptive Statistics

The Descriptive Statistics Analysis tool is one of the most basic and intuitive tools of Microsoft Excel for Data Analysts that is used to produce Univariate Statistics Reports for data in the input range. It provides information on Mean, Median, Mode, and Range Statistics, as well as Variance and Standard Deviation.
Pros & Cons of Excel in Data Analysis
Pros
- Microsoft Excel is best for arranging large sets of data into organized tables. The level of organization makes it easier to digest and analyze data.
- You can plug in your data to create Data Visualizations like graphs and present & discuss your data better with C-Suite.
- Excel streamlines your calculations. This way, you don’t have to worry about your output parameters when your input has changed. The software is intelligent enough to rework the calculations.
- Excel is available on all leading platforms: Windows, Mac, Android, and iOS; on the web, and offline both.
- Excel comes with a range of in-built functions that make accounting, math, statistics, logic, and database calculations easy.
Cons
- Microsoft Excel isn’t designed to be scalable. Scalable applications are dynamic and have the flexibility to meet complex business needs in changing scenes. Excel workbooks are static, and they crawl when asked to compute on thousands of rows.
- Excel also imposes limitations on file size.
- It does not have support for quick autofill features, which can be frustrating for someone without advanced knowledge.
- If you aren’t careful enough, there are bound to be errors in your calculations. Decimals or percentages may get misplaced, data types may be misunderstood, and currency or date formats may get interchanged: plenty to point to.
- No automation features.
Conclusion
Microsoft Excel for Data Analysts helps in categorizing Datasets, Building Data Models, Importing Data, and many more. While it cannot compete with the versatility of stand-alone Business Intelligence (BI) tools nor handle large amounts of data like Apache Spark or any other Unified Data Analytics Engines, it will continue to be a key part of the Data Analysis Ecosystem. Microsoft Excel is still the go-to solution for simple analysis for users who lack the strong technical ability to code as it does not require extensive training.
This article introduced you to Data Analytics and Microsoft Excel for Data Analysts. It also provided the usefulness of Microsoft Excel for Data Analysts. By the means of this article, you also gained knowledge on the 7 key features of Microsoft Excel for Data Analysts.
You can try Hevo Data which will make your life easier and make Data Migration hassle–free allowing you to focus on Data Analysis. It is User-Friendly, Reliable, and Secure.
Sign up for a 14-day free trial and simplify your data integration process. Check out the pricing details to understand which plan fulfills all your business needs.
FAQs
1. Do data analysts use Excel?
Yes, data analysts often use Excel for tasks like data cleaning, analysis, visualization, and reporting due to its accessibility, powerful functions, and ability to handle moderate datasets.
2. Which Excel course is best for data analysts?
Courses like Excel Skills for Business on Coursera by Macquarie University or Excel for Data Analysis on Udemy are excellent for data analysts, covering advanced functions, pivot tables, and data visualization.
3. Is Excel or Python better for data analysis?
Excel is better for small-scale analysis and quick tasks, while Python excels in handling large datasets, automation, and advanced analytics, making it more suitable for complex, scalable projects.


