

As technology has upgraded over the years, many BI tools have replaced BI experts, making it easy for organizations to create reports and data-driven decisions. One such tool is Google Data Studio, which assists organizations in generating insights with ease. Google Data Studio enables users to create stories about their data through dashboards and reports.
Users can also share these stories by embedding the messages on social media platforms like Facebook or Twitter. For creating reports, Google Data Studio not only allows you to connect with Google products like Google Ads, Sheets, and Analytics, but also integrates with other data sources like PostgreSQL, SQL, MySQL, and MongoDB. In this article, you will learn how to set up a Google Data Studio MongoDB connector.
Table of Contents
Methods for Google Data Studio MongoDB Connection
There are 2 ways to carry this out.
Method 1: Google Data Studio MongoDB Integration: Move Data from MongoDB to Google BigQuery
Hevo doesn’t support a connection between MongoDB and Google Data Studio directly. Here, we’ll be moving data from MongoDB to BigQuery first. Once you have your data in Google BigQuery, you can use Google Data Studio to carry out analysis since they belong to the same suite.
Hevo is the only real-time ELT No-code Data Pipeline platform that cost-effectively automates data pipelines that are flexible to your needs. With integration with 150+ Data Sources (40+ free sources), we help you not only export data from sources & load data to the destinations but also transform & enrich your data, & make it analysis-ready.
GET STARTED WITH HEVO FOR FREEYou’ll need 2 steps to replicate data from MongoDB to Google BigQuery.
- Configure MongoDB as a Source

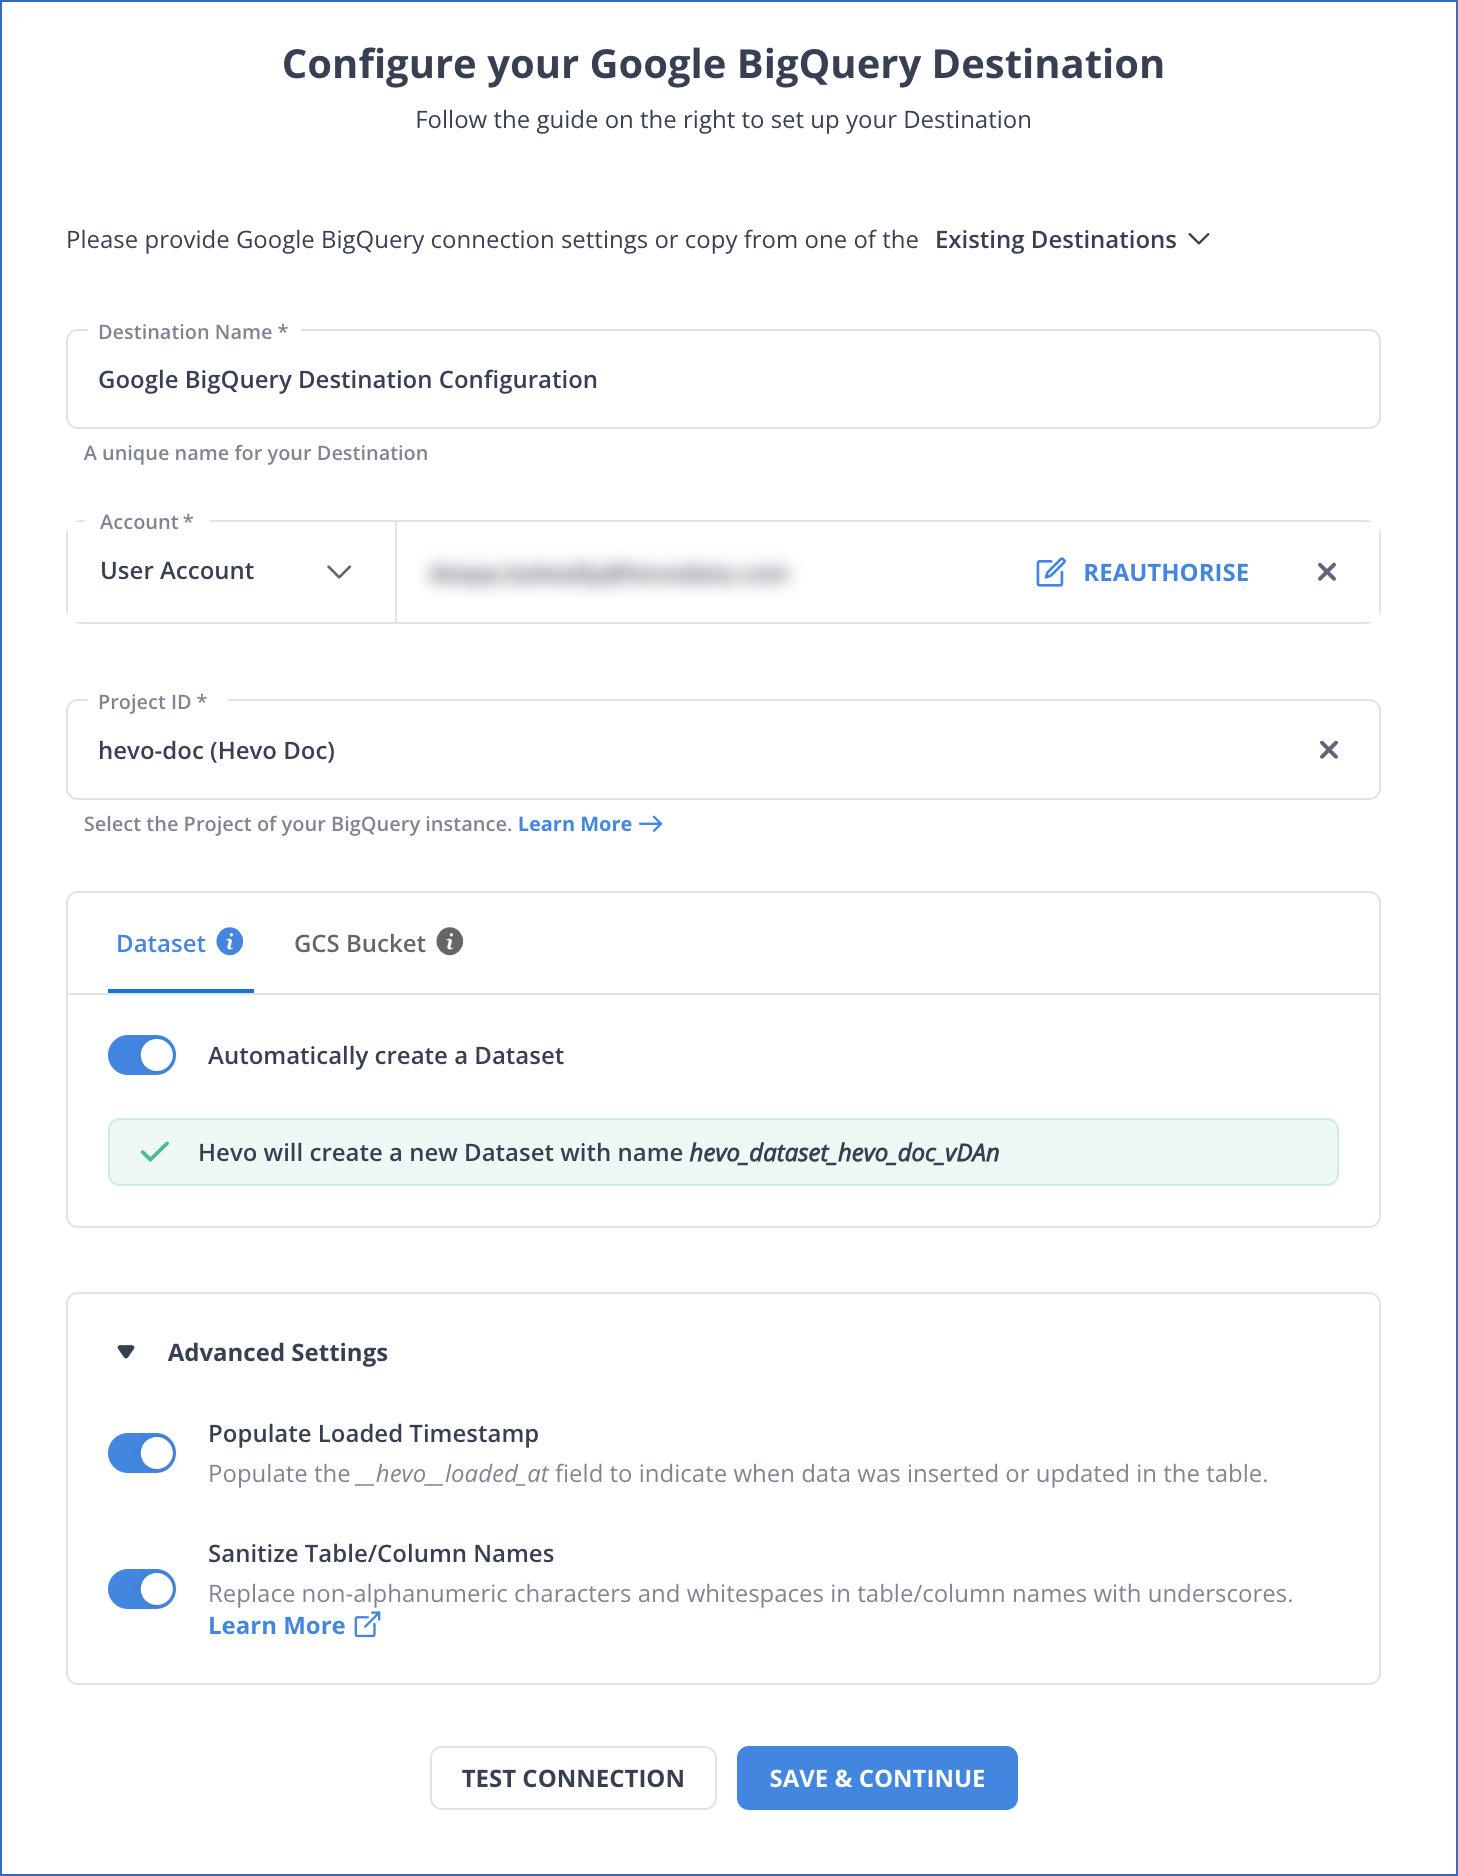
- Configure Google BigQuery as a Destination
Check out why Hevo is the Best:
- Schema Management: Hevo takes away the tedious task of schema management & automatically detects the schema of incoming data and maps it to the destination schema.
- Incremental Data Load: Hevo allows the transfer of data that has been modified in real-time. This ensures efficient utilization of bandwidth on both ends.’
- Data Transformation: It provides a simple interface to perfect, modify, and enrich the data you want to transfer.
- Secure: Hevo has a fault-tolerant architecture that ensures that the data is handled in a secure, consistent manner with zero data loss.
Google Data Studio MongoDB Integration: Connecting Google BigQuery to Google Data Studio
There are 5 steps you need to follow to set up a connection from Google BigQuery to Google Data Studio:
- Enable the Data Studio API.
- Select the ‘Blank Report’ option.
- Search for ‘BigQuery‘ and click ‘Authorize‘.
- Click on ‘Public Datasets‘.
- Click on ‘Add a Chart’ and select the dimensions you want.
Before wrapping up, let’s cover some basics.
Prerequisites
- Basic knowledge of the need for integrations.
What is Google Data Studio?

Google Data Studio is a free, open-source tool that converts your information into easy-to-read, easily shared, and customizable reports and dashboards.
With Google Data Studio, you can tell your data story with bar charts, pie charts, geo maps, bubble graphs, pivot tables, paginated data tables, and more.
You can also make your reports interactive using viewer filters and data range controls.
The data control feature in Google Data Studio is used to turn any report into a flexible template. Reports in Google Data Studio use links and clickable images to create product catalogs, video libraries, and other hyperlinked content.
Google Data Studio enables users to create reports on data from databases like MySQL, BigQuery, and PostgreSQL, Google Marketing Platform products like Google Analytics, Google Ads, Display & Video 360, and Google consumer products like Google Sheets, Youtube, and Search Console.
It also allows users to share data insights with teams, friends, colleagues, or anybody in the world. Users can invite others to edit or view their reports by sending links in emails.
Google Data Studio also lets you embed your reports to other pages like Google Sites, blog posts, marketing articles, and annual reports to tell your data stories broadly.
Features of Google Data Studio
Multiple Data Sources
Google Studio can analyze data from different datasets due to a wide range of database connectors. With Google Data Studio, you can import data from third-party sources like Funnel, TapClicks, Jira Cloud, Amazon Seller Central, and more.
Interactive Data Visualization
The view mode of Google Data Studio is highly responsive to features like chart interaction controls, cross-chart interactions, and drill-downs.
As a result, users can customize anything from filters to metrics for discovering various insights into their reports. Data Studio Explorer allows users to understand reports by using graphs and tables on small bits of data.
Real-time Collaboration
Similar to other Google productivity tools, you and your colleagues can work on the same Google Data Studio report in real time. At the top of the report, a share menu invites people to work with you. With Google Data Studio, you can share your workspace with your colleagues.
Their Google profile will be shown on the menu bar if they join you. Google Data Studio enables users to edit and view reports with their team members.
Easy to Use
The Google Data Studio’s user interface is easy to use, and its workspace consists of drag-and-drop actions for creating the report. It also consists of ready-to-use report templates for different categories. You can even add custom property panels for each object you use in reports.
Scheduling Reports
Sharing project reports with clients is an important task. Google Data Studio has a feature called Schedule email delivery, which you can use to create a report for your client and schedule a delivery.
Google Data Studio can automatically notify clients when the report is due with this feature.
Superior Dashboard
Google Data Studio enables users to create dashboards using the below set of features.
- Search Data Studio Box: It is the box at the top that enables users to look for reports, templates, and data sources.
- Recent Section: It gives users the option to swap the visibility for reports, data sources, and explorer.
- Create: It is a left-hand side menu used to create a new report, data source, or explorer. Users can also find shared items and templates in this space.
- Gear Icon: It is used for customizing user settings.
Benefits of MongoDB Integration with Data Studio
Integration of Looker Studio MongoDB offers several advantages for data analysis and visualization, such as:
- Faster Data Analysis: Looker Studio is designed to handle large amounts of data, and can generate reports and dashboards quickly. This saves a lot of time and allows you to make decisions faster.
- Interactive Dashboards: You can create interactive dashboards in Looker Studio that allow you to drill down into your data and to get a better picture of your data. You can also make your dashboards visually appealing by customizing them.
- Scalability and Flexibility: Looker Studio is designed to scale with your business, as it can handle large data sets. As your business grows, your data needs evolve. Looker Studio allows you to easily adapt and customize reports to meet your changing needs.
What is MongoDB?

MongoDB is an open-source NoSQL database management program founded by Dwight Merriman, Eliot Horowitz, and Kevin Ryan in 2007.
MongoDB is used to manage document-oriented data information and is mainly developed for big data applications. It stores data in documents and collections instead of rows and columns. MongoDB consists of documents containing a data structure of key and value pairs.
Since MongoDB documents are in Binary JavaScript Object Notation (BSON), they accommodate more data types for broader business use cases. These documents are in Collections – a set of documents – in MongoDB, which functions the same as tables in relational databases.
MongoDB does not require predefined schemas design like other databases. It can store any data that gives users flexibility for creating any number of fields in a document. While designing a schema, you should follow specific considerations as mentioned:
- Store the data.
- Provide excellent query performance.
- A reasonable quantity of hardware.
One of the main features of MongoDB is horizontal scalability, which makes it an essential database for organizations running big data applications.
MongoDB supports multiple storage engines, as different engines give better performance on specific workloads. The pluggable storage engines in MongoDB can add new capabilities and configure for the optimal use of hardware. It reduces the developer and operational complexity of running multiple database technologies.
Conclusion
In this article, you have learned about Google Data Studio MongoDB connection using CData Connect Cloud. Google Data Studio can be used to visualize databases like PostgreSQL, MySQL, and SQL. It gives comprehensive information on how to connect Looker Studio to MongoDB, along with its limitations and applications.
Google Data Studio can also be used with Amazon Redshift and Google BigQuery data for visualizations. Third-party applications like Supermetrics, CData Connect, Onlizer, and more allow users to connect Google Data Studio with storage devices like Amazon S3 and JSON data.
MongoDB is a trusted source that a lot of companies use as it provides many benefits but transferring data from it into a data warehouse is a hectic task. The Automated data pipeline helps in solving this issue and this is where Hevo comes into the picture. Hevo Data is a No-code Data Pipeline and has awesome 150+ pre-built Integrations that you can choose from.
visit our website to explore hevoHevo can help you Integrate your data from numerous sources and load them into a destination to Analyze real-time data. It will make your life easier and data migration hassle-free. It is user-friendly, reliable, and secure.
SIGN UP for a 14-day free trial and see the difference!
Share your experience of learning about the Google Data Studio MongoDB connection in the comments section below.
FAQ on Google Data Studio MongoDB
Can Google Data Studio connect to MongoDB?
Google Data Studio does not have a native connector for MongoDB. However, you can connect MongoDB to Data Studio through third-party connectors such as Hevo or by exporting MongoDB data to a supported format or database.
Does GCP have MongoDB?
Yes, Google Cloud Platform (GCP) supports MongoDB. You can use MongoDB Atlas, a fully managed MongoDB service, available on GCP. Alternatively, you can deploy MongoDB on Google Cloud using Compute Engine or Kubernetes Engine.
Can Google Data Studio connect to a database?
Yes, Google Data Studio can connect to various databases, such as Google BigQuery, MySQL, PostgreSQL, and others, using native connectors or third-party solutions. This allows you to visualize and analyze your database data directly in Data Studio.
Share it with your connections.
-
 Share To LinkedIn
-
 Share To Facebook
-
 Share To X
-
 Copy Link


