


Organizations rely on several Business Analytics and Data Visualization Tools to gain meaningful insights into data. One such Business Analytics tool is Google Data Studio, which enables businesses to create reports on organizational data and make data-driven decisions. Since Google Data Studio can access data from different applications of Google Suite like Google Analytics, Google Ads, and Google Sheets, data professionals popularly use it to create useful reports and dashboards.
However, Google Data Studio does not only connect with Google Suite’s products but also can integrate with external data sources or Database Management Applications like PostgreSQL, SQL, and MySQL. You can seamlessly fetch or access data from specific databases to perform, for example, Google Data Studio PostgreSQL integration, and analyze data with better visualizations.
In this article, you will learn the basics of Google Data Studio, its features, and steps to connect Google Data Studio with the PostgreSQL database using the Google Data Studio PostgreSQL connector.
Table of Contents
Prerequisites for Google Data Studio PostgreSQL Integration
You would need basic knowledge of the Google Data Studio platform, PostgreSQL database, and SQL queries.
It supports 150+ Data Sources like Google Cloud, Google Sheets, Google Drive, Google Analytics, PostgreSQL and includes 60+ Free Sources. It is a 3-step process by just selecting the data source, providing valid credentials, and choosing the destination.
Why choose Hevo?
- Get 24/5 live chat support.
- Eliminate the need for manual mapping with the automapping feature.
- Ensures Real-time data integration
Discover why BeepKart chose Hevo to expand their pipeline creation by 80%, reducing the process from 30 minutes to under 5 minutes. Try out the 14-day full access free trial today to experience an entirely automated, hassle-free Data Replication!
Get Started with Hevo for FreeWhat is Google Data Studio?

Google Data Studio is an open-source tool used to convert your data into interactive and easy-to-understand reports and dashboards. It helps organizations to create and share data visualizations with teams and make informed decisions. With Google Data Studio, you can interpret your data using charts, graphs, pie charts, geography maps, pivot tables, paginated tables, and more.
Reports in Google Data studio use clickable images to create product catalogs, video libraries, and other hyperlinked contents. Besides, users can invite their team to edit or view reports by sending email links. They can also embed their reports to other web pages like Google Sites, Blog Posts, Marketing Articles, or Social Media Platforms like Facebook or Twitter.
With Google Data Studio, you can create your dashboards to answer specific questions about your business. The Explorer function in Google Data Studio allows you to work with your data by adding dimensions, mathematical operations, and custom formulas to transform your data into meaningful business intelligence.
Using Google Data Studio, organizations can pull information from different data sources, which can help them understand their customers across their business operations.
What Are the Benefits of Using Google Data Studio?
- Several Widget Options: Unlike Google Analytics, where you can only have 12 graphs or charts in a report, you can have any number of widgets in Google Data Studio, thereby allowing users to modify these widgets with various metrics. Types of widgets include heat graphs (region, state, or country), pie charts, time-series graphs, and many more.
- Collect Data From Multiple Sources: Google Data Studio allows users to collect and access data from multiple sources like Google Analytics, Google Ads, YouTube, Search Console, and many more. Users can consolidate their reports from all such data sources.
- Share Reports Easily: Often you are required to get your reports reviewed by colleagues to receive feedback and improve the accuracy of reports. Google Data Studio enables you to provide access to your reports for your team or colleagues, just like Google Sheets and Google Docs. This feature allows real-time sharing, where the entire team can access reports and make changes to them simultaneously.
- Customizable Reports: Google Data Studio can create custom reports using different styles, graphs, designs, and formatting. You can customize the page layout, text, graphs, metrics, and style elements.
- Free Data Studio Templates: Google Data Studio provides users with preloaded templates for Google Analytics, YouTube, Google Ads, and more. It also provides templates for E-commerce, Data Analysis, Content Marketing, Rank Tracking, SEO Reports, and many more. This feature enables users to create quick and easy reports.
- Embed Data Studio Reports: Google Data Studio enables users to embed their reports across Social Media Platforms like Facebook or Twitter. You have to include the report URL in your social media post, and then it will be published.
What is PostgreSQL?

PostgreSQL is an advanced and open-source Object-Relational Database Management System. It is the extension of SQL along with some advanced features.
Today, PostgreSQL functions as both relational and non-relational queries. It has helped developers build applications while protecting data integrity. Many websites as well as mobile applications leverage PostgreSQL for the flexibility and reliability of digital solutions.
How to Connect Google Data Studio PostgreSQL Database?
Method 1: Connecting Google Data Studio PostgreSQL Using PostgreSQL Connector
Follow the steps below to connect your Google Data Studio with the PostgreSQL database.
Step 1: Register for the Google Data Studio if you don’t have an account yet. If you have one, log in to your account.
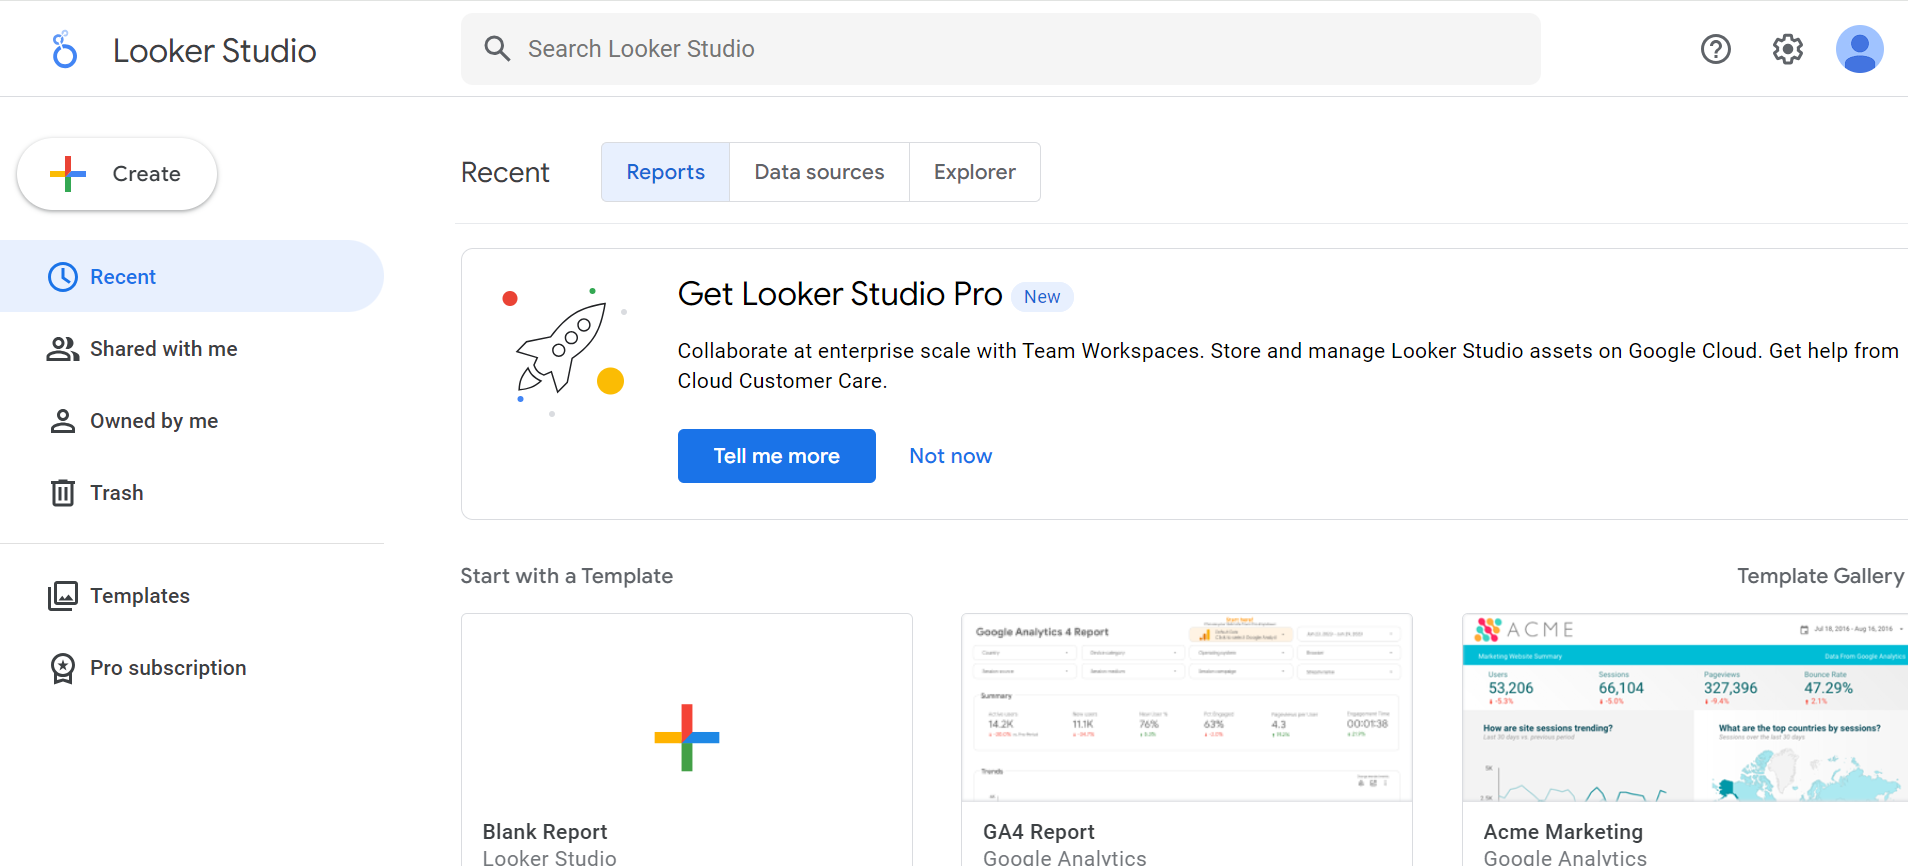
Step 2: Add a new Data Source by clicking the “+Create” button in the top left corner.
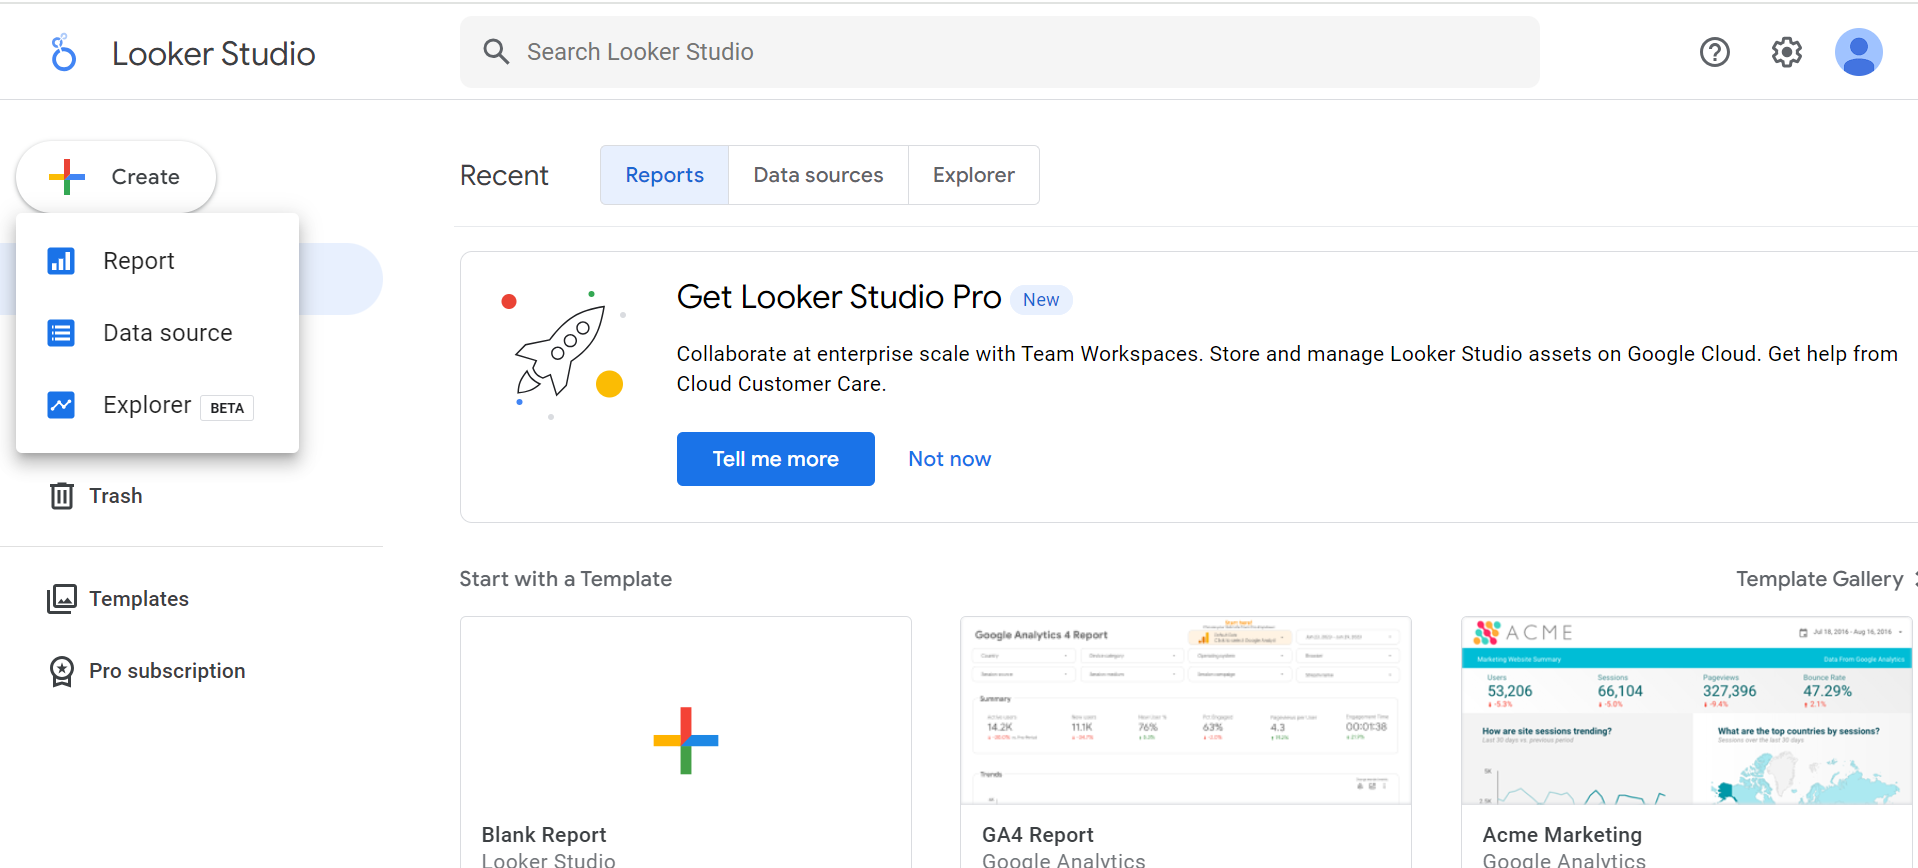
Step 3: Click on the Data Source option as shown in the image below.
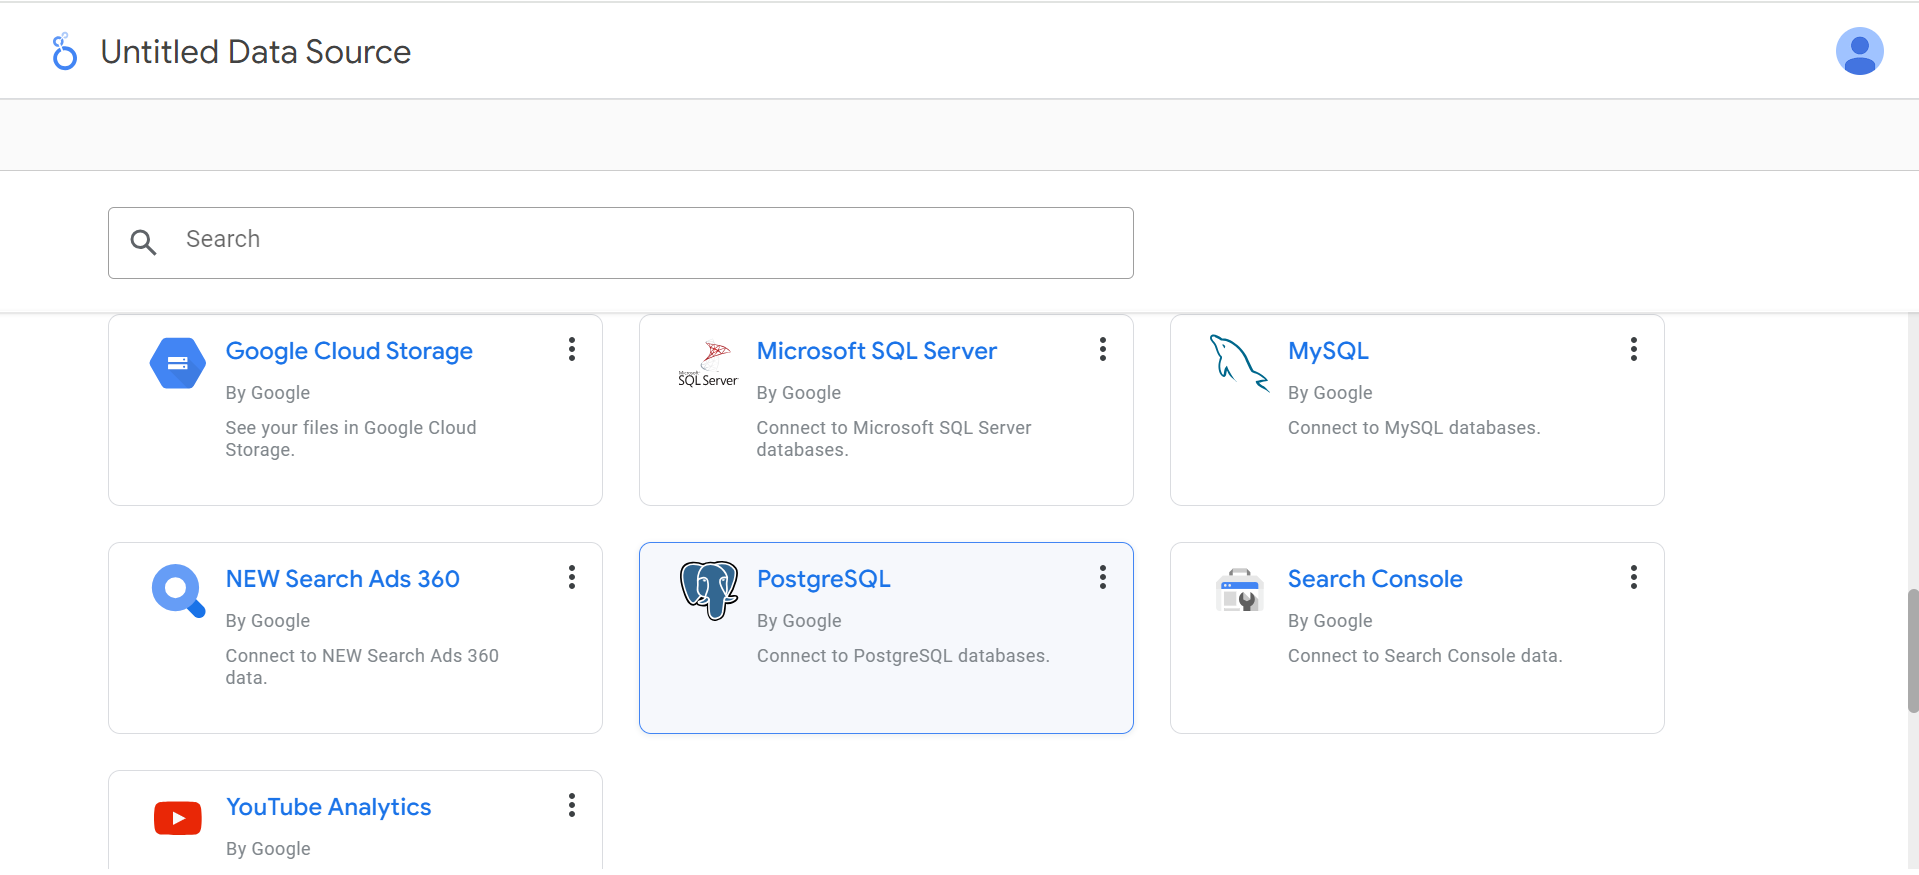
Step 4: Search and select for the Google Data Studio PostgreSQL connector. You can see it in the window below.
Step 5: Set the credentials for the Data Server.
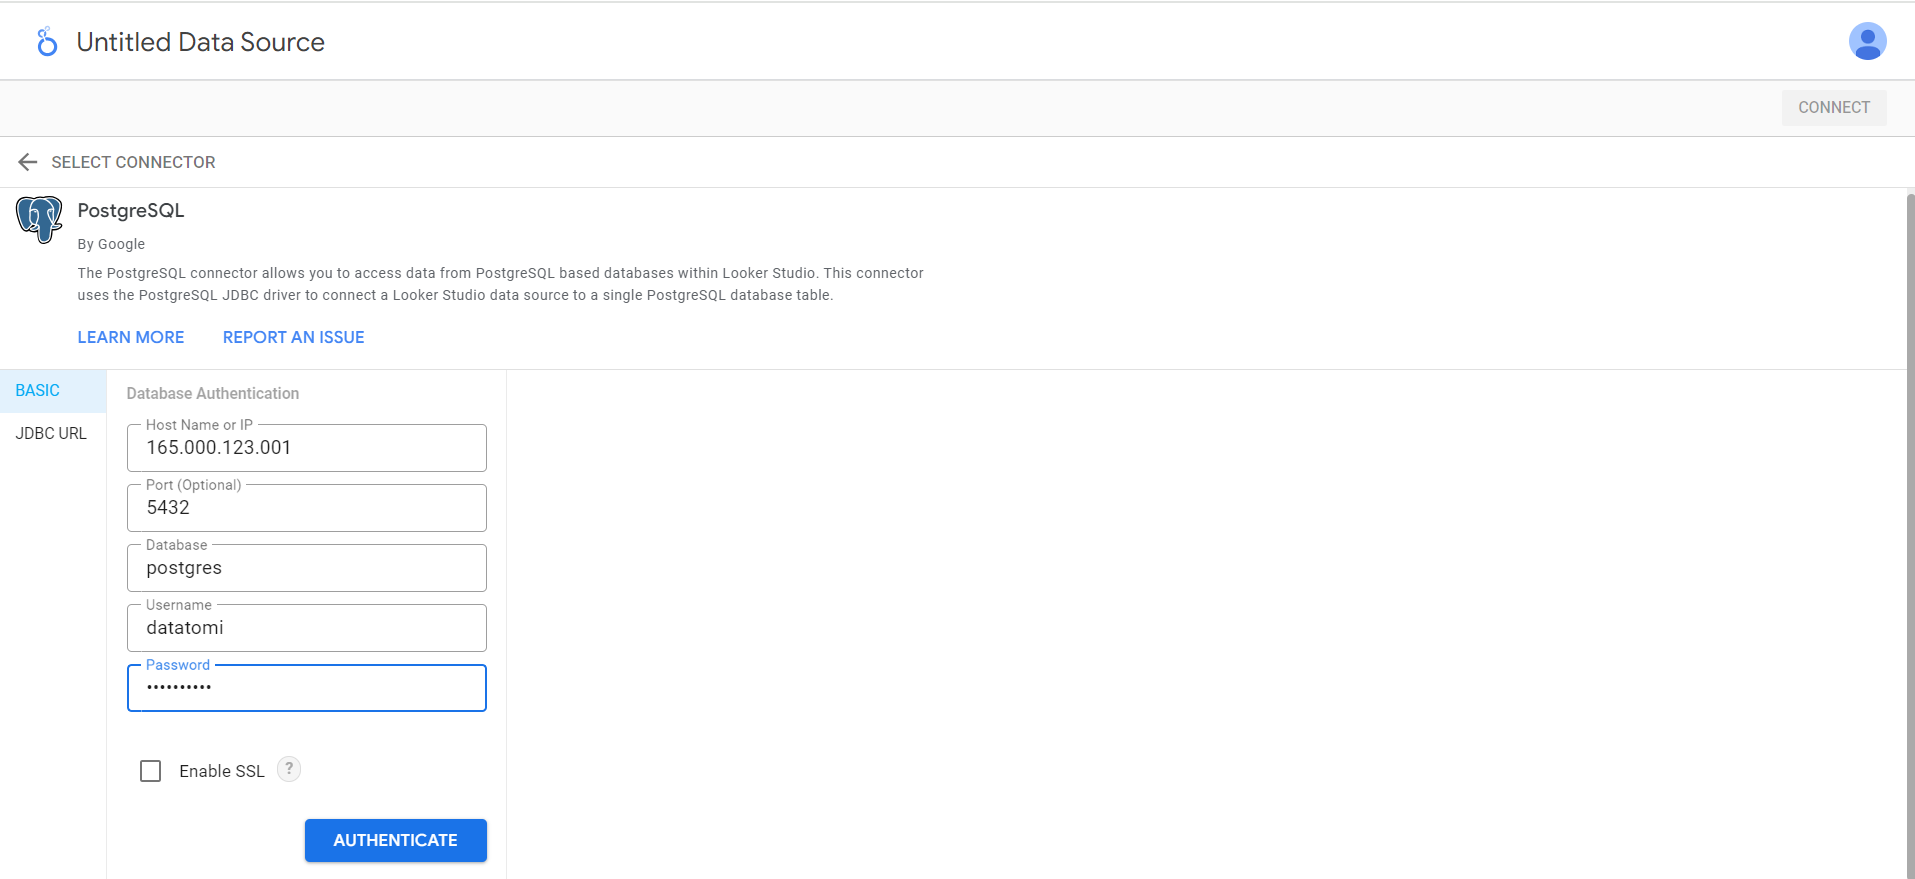
After selecting the PostgreSQL connector, the below Database Authentication window will pop up.
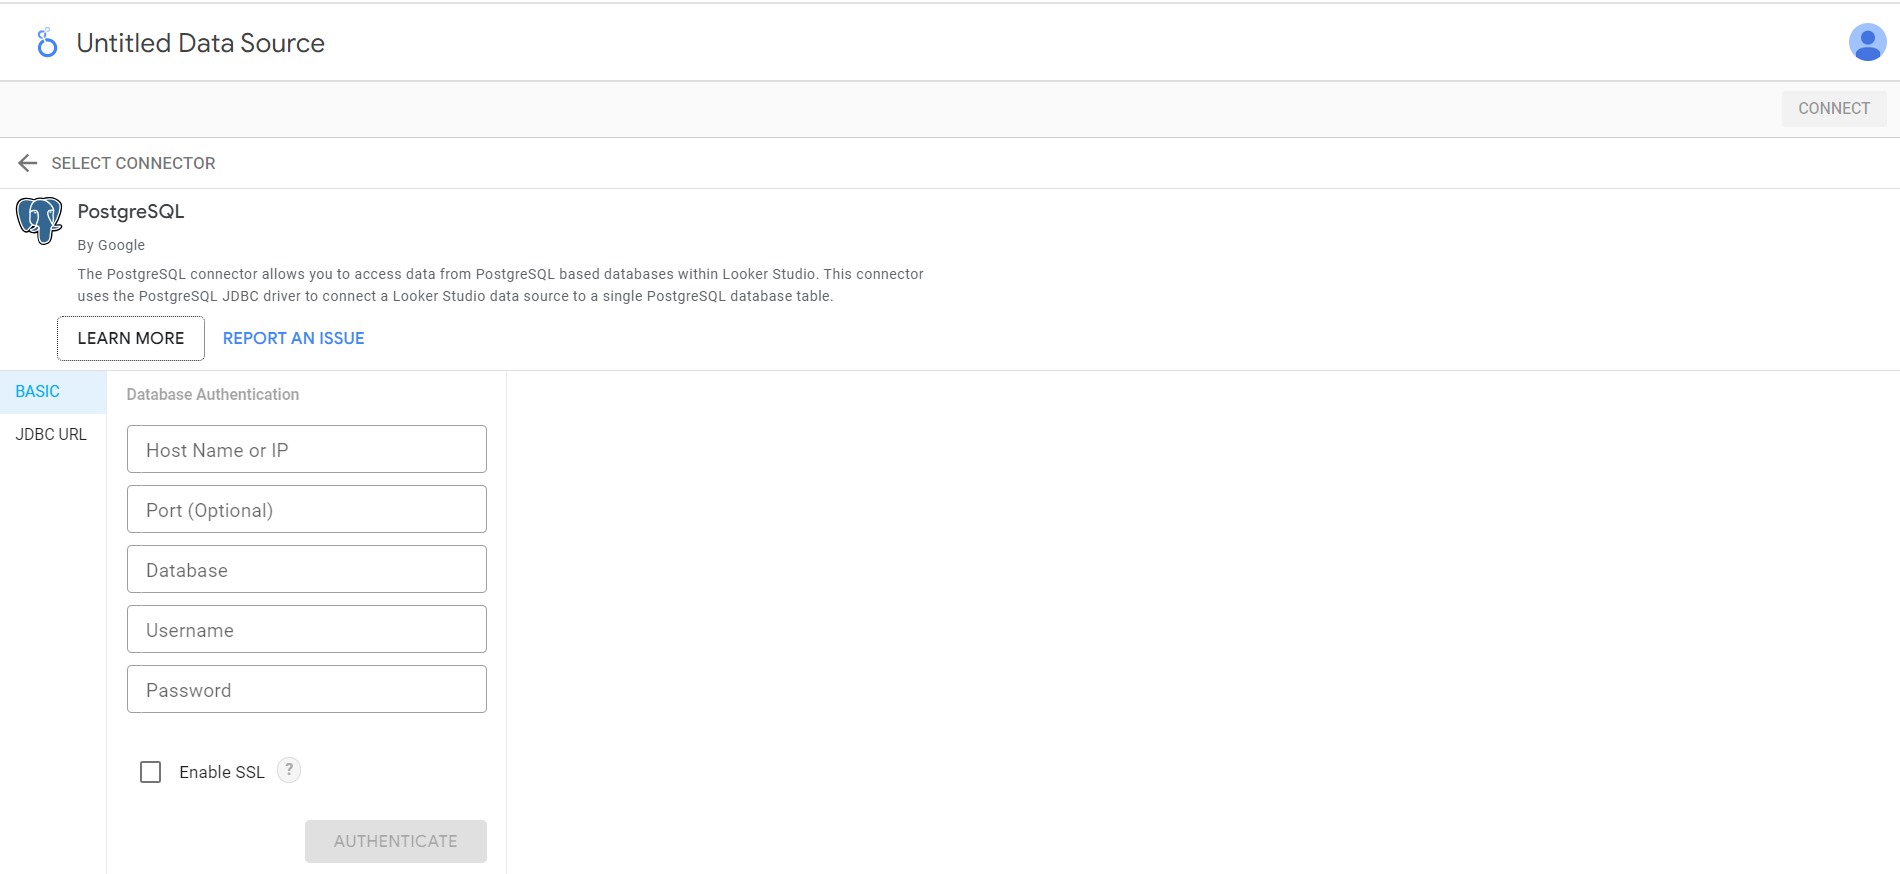
It consists of the following attributes.
- Host Name/IP address: IP address of the Data Server.
- Port: Port of the PostgreSQL connector on the Data Server. It is 5432 by default.
- Database: The name of the database. In this case, it is a PostgreSQL database.
- Username: Username of the PostgreSQL database.
- Password: Password of the PostgreSQL database.
- SSL Connection: This is the SSL connection. You can enable the secure SSL connection by checking it.
After filling in all fields, your authentication window will look like the image below.
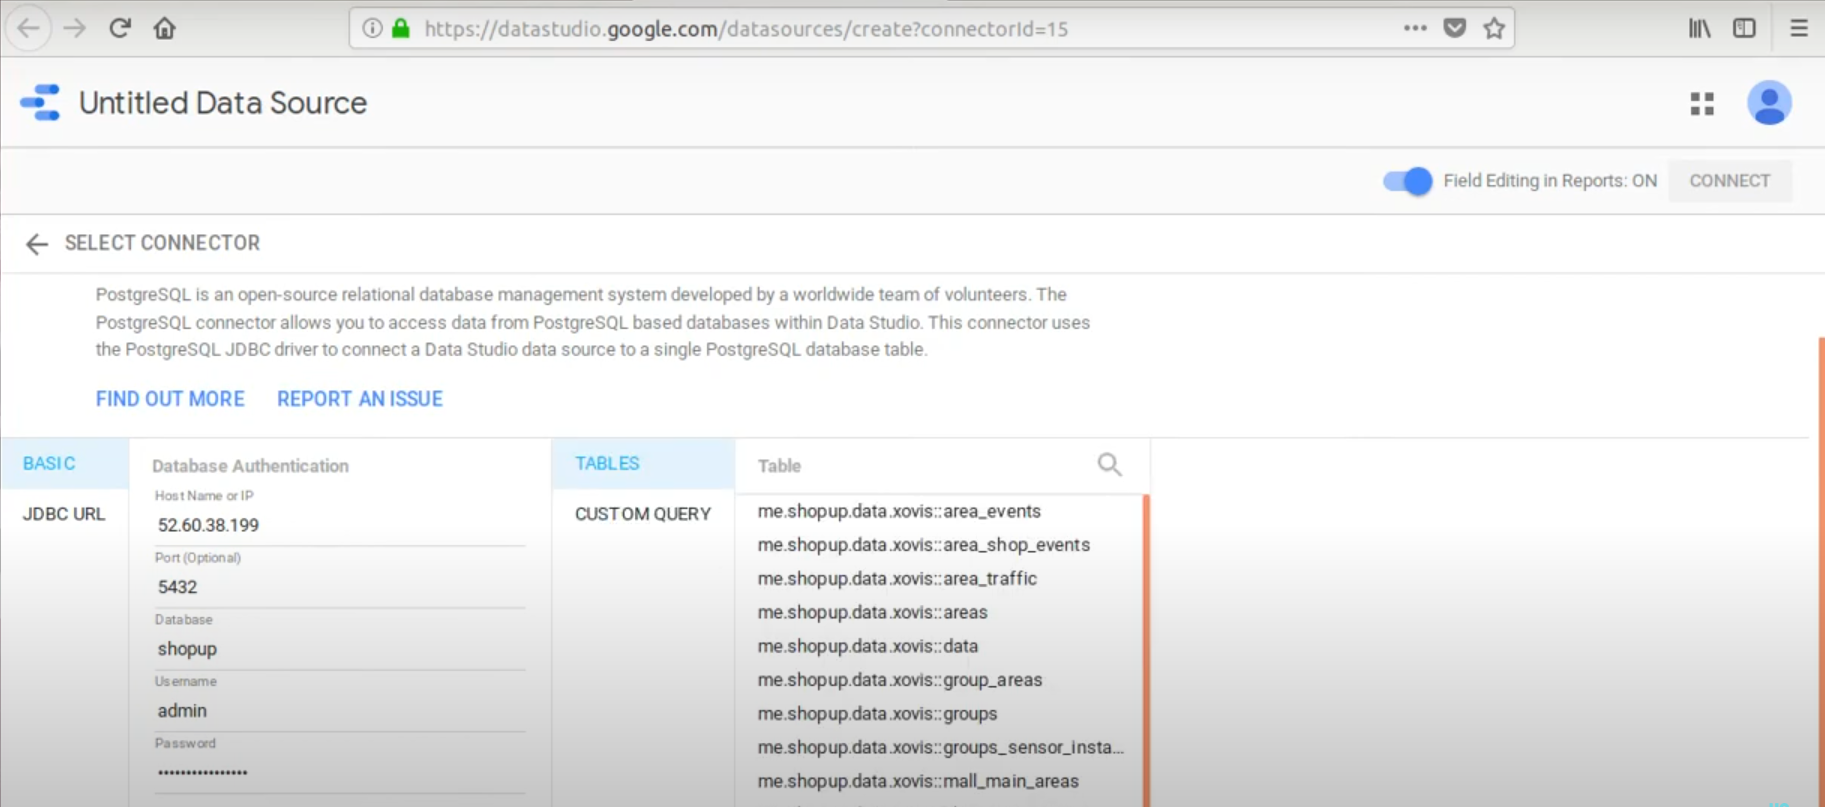
Step 6: Select your data table.
You can choose any data table in Data Server. In this case, we have selected a zoo table, as shown in the image.
Starting 2018, Google Data Drive introduced a new feature where you can use a query to transform your PostgreSQL data in a preferred format before connecting it to your Google Data Drive. Through this feature, you can import the aggregated data of your data table instead of the whole data table.
In the below example, we have used a query to count the number of animals in the zoo data table.
Step 7: Format the data table.
You need to name the new data table. You can also rename the column names and set the data type and the aggregate function as shown below.
Step 8: Create reports.
After connecting the Google Data Studio PostgreSQL database, you can generate reports by creating charts for the zoo dataset.
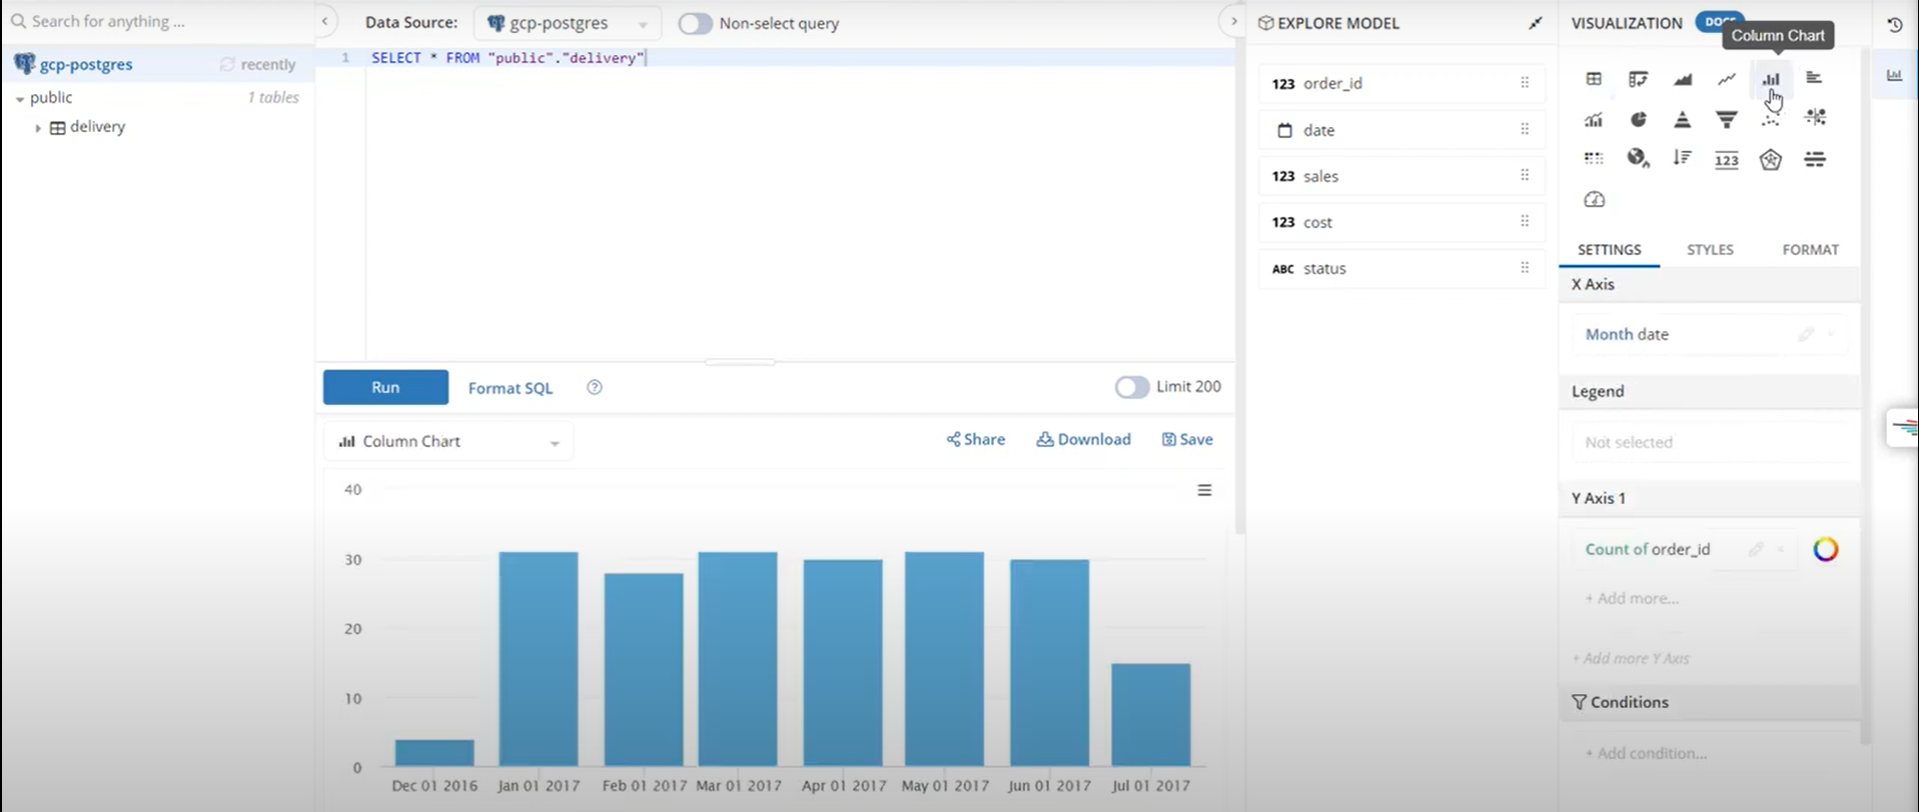
You can also show the number of animals for your zoo-data-counted dataset, as displayed in the image below.
If there are any changes in the PostgreSQL table, they will be reflected in the Google Data Studio. You can see them by simply refreshing the above-created charts.
Method 2: Creating Google Data Studio PostgreSQL Data Reports Using CData Connect Cloud
You can use Google Data Studio PostgreSQL connection to create reports with visualizations for sharing with your clients. Alternatively, you can connect with CData Connect Cloud to get instant access to PostgreSQL data for visualizations.
Part 1: Connecting to PostgreSQL Database Using CData
Follow these steps to create a virtual PostgreSQL database and build reports from it through Google Data Studio.
Step 1: Sign up for a free trial at CData Connect if you don’t have an account. If you have one, proceed to the next step.
Step 2: Log in to the CData Connect Cloud and click on Databases. It will show the available data sources in a new window.

Step 3: Select the PostgreSQL database option.
Step 4: Enter the authentication properties for connecting with the PostgreSQL database like the name of the connection, username, password, and security token.
The default port number is 5432 to connect with the PostgreSQL database. Set the username and password to your server. Your database property is then connected to your default database, as shown below.
Step 5: Click on the Test Database tab.
Step 6: Now, click on the Privileges tab and add the new user, or you can use the existing user with appropriate permissions.
Part 2: Visualizing PostgreSQL Data in Google Data Studio
Here are the steps to visualize PostgreSQL data in your Google Data Studio.
Step 1: Log in to your Google Data Studio and click on Data Sources.
Step 2: Create a New Data Source and choose CData Connect Cloud Connector, as shown below.
Step 3: You need to authorize the CData Connect Cloud connector to connect with the external service.
You can use your instance name as myinstance in myinstance.cdatacloud.net to connect with your Connect Cloud instance. You are also required to enter your username and password to connect to your Connect Cloud instance.
Step 4: Select the PostgreSQL database and click on Next.
Step 5: Select the table and click on Next.
Step 6: Click on the Connect button in the top right corner.
Step 7: You can now modify the columns. Once done, select Create Report.
Step 8: Add the data source to your report as shown below.
Choose the visualization type and add it to the report. You can select the dimensions and measures to customize the visualization, as shown below.
This brings us to the end of the Google Data Studio PostgreSQL connection article. We discussed two methods to connect Google Data Studio PostgreSQL database – one using Google Data Studio PostgreSQL connector and the other using CData integration.


Conclusion
In this tutorial, you learned how to use Google Data Studio for data visualization with Google Data Studio PostgreSQL database connector. However, in Google Data Studio, you can also explore and visualize data from other sources like Google Analytics, Google Ads, Google Sheets, and more. Google Data Studio can perform visualizations on real-time data for database connectors, like MySQL, MS SQL Server, and just like Google Data Studio PostgreSQL connector.
You can use Hevo to transfer data from multiple data sources into your Data Warehouse like Amazon Redshift, Google BigQeury, Snowflake, or Firebolt in minutes. Hevo provides you with a consistent and reliable solution to managing data in real-time, ensuring that you always have analysis-ready data at your desired destination. Try a 14-day free trial to explore all features, and check out our unbeatable pricing for the best plan for your needs.
FAQ on Google Data Studio PostgreSQL Connection
1. Can Google Data Studio connect to PostgreSQL?
Yes, Google Data Studio can connect to PostgreSQL databases. You can use the built-in PostgreSQL connector to link your PostgreSQL database with Google Data Studio for creating reports and dashboards.
2. Does GCP have PostgreSQL?
Yes, Google Cloud Platform (GCP) offers PostgreSQL as a managed service called Google Cloud SQL for PostgreSQL. Cloud SQL for PostgreSQL is a fully managed database service that makes it easy to set up, maintain, manage, and administer your PostgreSQL relational databases on Google Cloud.
3. How do I connect Looker Studio to PostgreSQL?
To connect Looker Studio to PostgreSQL, follow these steps:
– Open Looker Studio
– Create a new Data Source
– Select PostgreSQL connector
– Configure the connection
– Select Tables
– Create Reports

Share it with your connections.
-
 Share To X
-
 Share To LinkedIn
-
 Share To Facebook
-
 Copy Link

