


Businesses deal with data all day long. However, to make sense of the vast information, they look towards tools that can summarize their huge datasets into appealing and logical visual representations. Grafana is an interactive platform that provides companies with Data Visualization and Analytics facilities. It has a rich feature set that allows you to plot your data using a number of Graphs and elegant Reports. Grafana integrates with all Data Sources using its customizable Plug-in tool. Moreover, it provides Dashboards that are reusable and serves as a great platform for sharing data within a workforce.
PostgreSQL is a powerful, open-source object-relational database system. It has more than 15 years of the active development phase and a proven architecture that has earned it a strong reputation for reliability, data integrity, and correctness.
In this article, you will gain information about Integration. You will also gain a holistic understanding of Grafana, PostgreSQL, their key features, and the steps followed for setting up Integration. Read along to find out in-depth information about Grafana PostgreSQL Integration.
Table of Contents
What is Grafana?

Grafana is a visualization software that is popular for its Data Analytics properties. Since Grafana is an open-source tool, you can easily customize it according to your business requirements. It can take input from any data source and turn it into insightful visuals.
It can be expanded using a plug-in system. Using interactive query builders, end users can create complex monitoring dashboards. It was created using the Go programming language. Torkel Ödegaard 2013 created Grafana as a simple and elegant solution for businesses to protect their data in a visually appealing and useful form. This tool currently supports over half a million users and the number is growing regularly.
Key Features of Grafana
Grafana is beneficial for businesses due to its following features:
- Plug-ins: Grafana already contains integrations with a number of popular data sources. However, you can go a step further and connect Grafana to the Data Source of your choice using Plug-ins. A Plug-in acts as a connector for integrating 2 software applications. This way you can apply Grafana’s Data Visualization capabilities to any data source that contains time-stamp bounded data.
- Graph Annotations: This feature enhances your Dataset’s correlation as it allows you to mark graphs. You can either manually populate the Graph data or use a data source for your visualization. Annotations act as checkpoints or bookmarks for your data. So, if you face any errors, you can revert to the last Annotation and rebuild the Graph.
- Dashboard Templates: This feature enables you to customize your Dashboard set up according to your business needs. Moreover, these Templates can be used for multiple tasks simultaneously. Templating allows you to cover both general and granular aspects of your data. Furthermore, you can easily share the Grafana Dashboards with anybody in your entire workforce.
- Grafana Reports: This feature lets you generate visually appealing reports for your various stakeholders. However, you can not create and share Grafana Reports if you are using the free version.
What is PostgreSQL?

PostgreSQL, also known as Postgres is a free, open-source Relational Database Management System (RDBMS) that emphasizes extensibility and SQL Compliance. It was developed at the University of California, Berkeley, and was first released on 8th July 1996. It was the successor to the Ignes database. Instead of storing data like documents, PostgreSQL stores it as Structured objects. It follows the traditional SQL format and syntax.
It is programmed in C and follows a monolithic architecture, which means that the components are completely united and work systematically. It offers community support along with additional support to some of its paid customers. It is widely used in the healthcare, banking, and manufacturing industries due to its innovative backup mechanisms.
Key Features of PostgreSQL
PostgreSQL houses some unique features that make it a good alternative compared to other traditional RDBMSs. Some of these features are:
- PostgreSQL supports a wide variety of data types, document types, and customizations.
- It has a monolithic architecture where all the components work together in an automated manner.
- It is ideal for transactional workflows such as in bank systems, for performing risk assessments, BI (Business Intelligence), and powering various business applications.
- It has multiple fail-safes and redundancies that make storage reliable.
- It is open-source and so any user can use all of its features, free of cost.
- It has limited scalability as its processing power depends on the machine it runs on.
- It has a robust access control system that has additional features like row and column level security and multi-factor authentication with certificates.
- It runs successfully on major operating systems and is ACID (Atomicity, Consistency, Isolation, and Durability) compliant.
Do you need to prepare your data before it reaches PostgreSQL? Hevo ensures your data is clean and properly formatted.
Once your data is in PostgreSQL, use Grafana to create powerful visualizations and dashboards, turning your data into actionable insights.
Setting Up Grafana PostgreSQL Integration
The steps followed to implement Grafana PostgreSQL Integration are as follows:
1) Install and Setup Grafana
The steps followed to download and set up Grafana are as follows:
- Step 1: Firstly, you can download the Setup from the Grafana official site.
- Step 2: Select a Grafana Version you want to install. However, the most recent one is automatically selected by default.
- Step 3: Select an Edition. Click on the “Windows” option if your Operating System is Windows.
- Step 4: Click on the “Download the installer” button.
- Step 5: Now, you can open and run the installer.
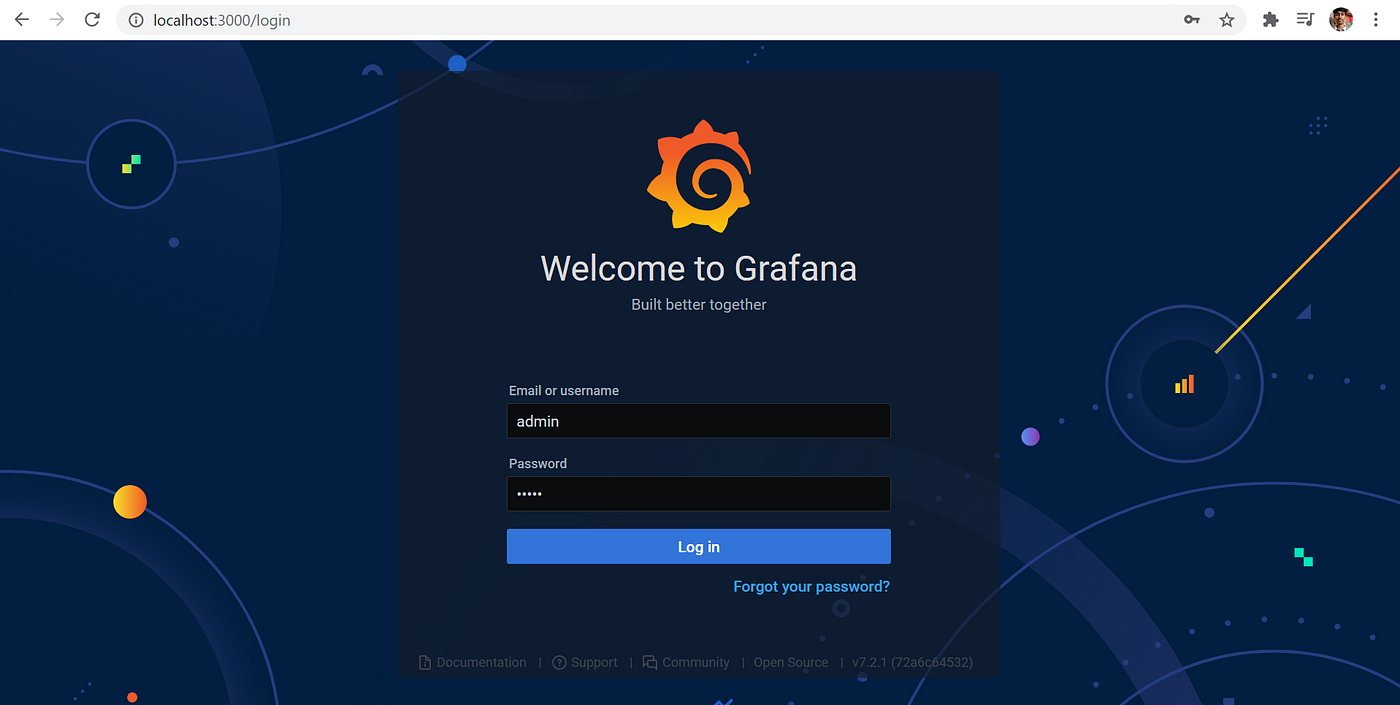
- Step 6: For setting up your account, open your web browser and navigate to http://localhost:3000/. (3000 is the default HTTP port that Grafana follows if you haven’t specifically configured a different port.)
- Step 7: Now, on the login page, you can type admin for both the username and password.
- Step 8: Now, you can change your password.

2) Setting up of PostgreSQL Database
The steps followed for setting up PostgreSQL Database in the process of implementing Grafana PostgreSQL Integration are as follows:
- Step 1: First, you need to download the PostgreSQL installer from the following link.
- Step 2: Run the installer and then install it.
- Step 3: Click on the “Next” button.
- Step 4: You can browse the folder if you want to change the directory. Otherwise, you can to the default path which is C:Program Files
- Step 5: You can even add a password for the superuser.
- Step 6: Now, you can select a port number. However, by default PostgreSQL runs on port number 5432.
- Step 7: Keep on clicking the “Next” buttons until the installation starts.
3) Verification of PostgreSQL Installation
The steps followed to verify the PostgreSQL Installation are as follows:
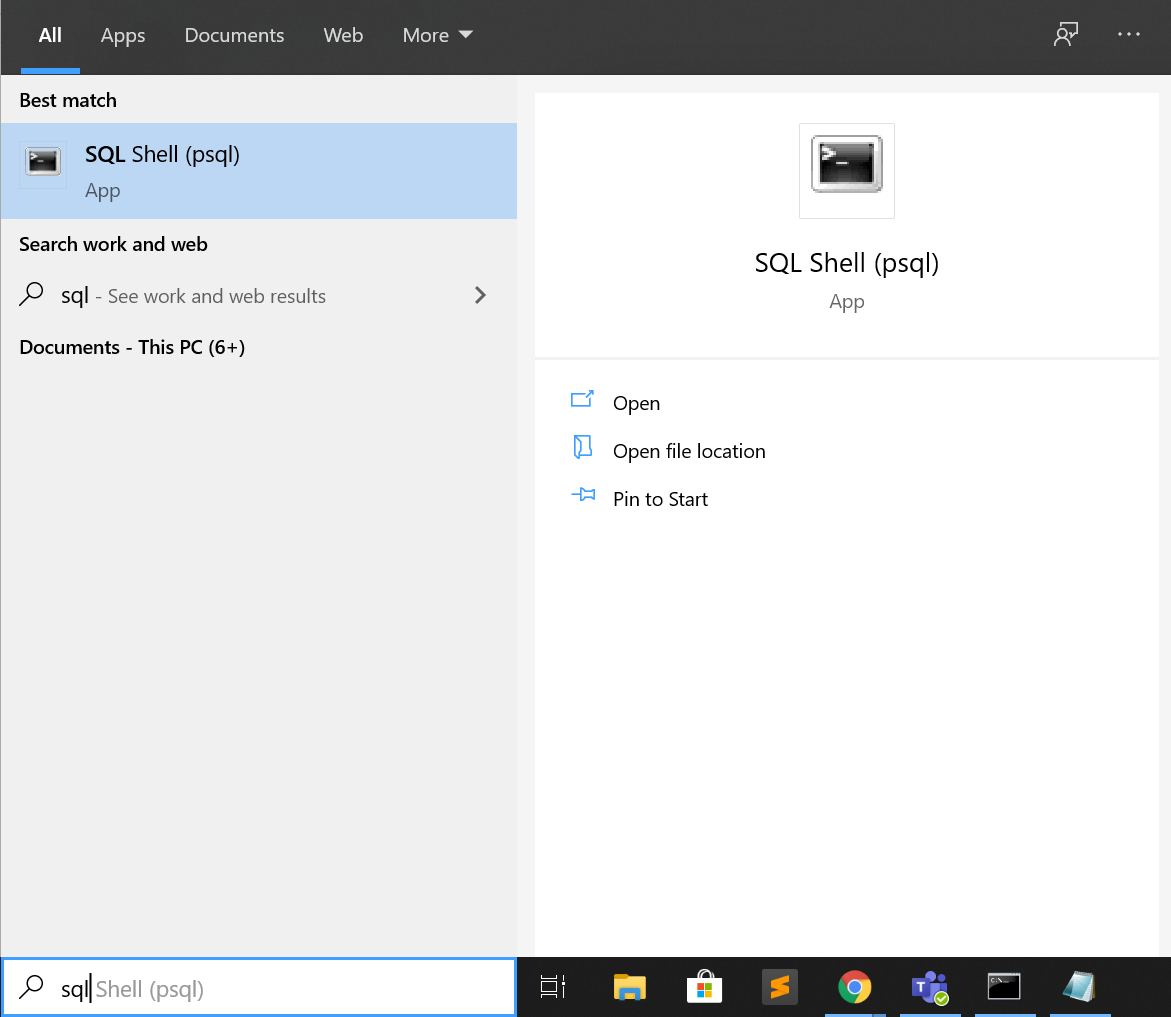
- Step 1: In the system search bar, search for ‘sql’.
- Step 2: As SQL Shell appears, click on it. The SQL Shell terminal appears.
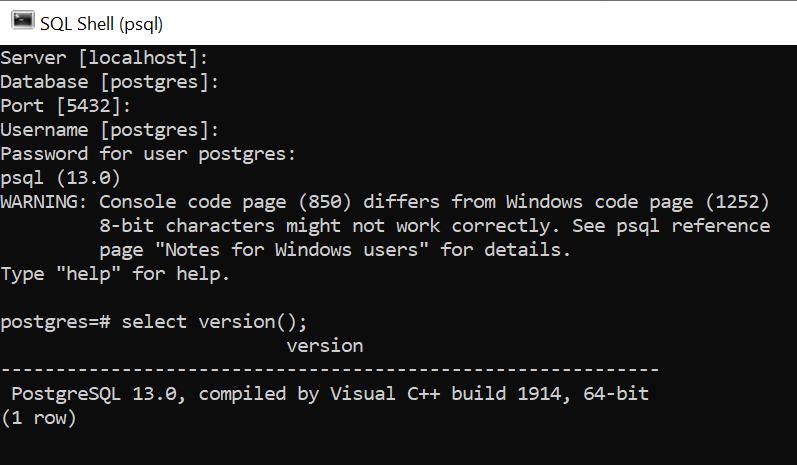
- Step 3: As given below, press the enter key for all options except the password option.
- Step 4: Enter the same password that you have given during the installation of the PostgreSQL database.
- Step 5: Then the version of PostgreSQL appears which verifies the installation.
4) Populate the Database with Dummy Data
The steps followed to populate the PostgreSQL database with dummy data are as follows:
- Step 1: Initially, you can create a table.
CREATE TABLE t_oil
(
region      text,
country     text,
year        int,
production  int,
consumption int
);- Step 2: Now, you can populate the table with any dummy data. You can follow the commands given below.
COPY hello_world FROM
PROGRAM 'curl https://www.abc-postgresql.com/hello/hello_text.txt';
The above command just copies all the data into the hello_world table in the database. As an alternative, you can also use the INSERT command to insert different rows into the database.
INSERT INTO hello_world (
region, country, year, production, consumption )
VALUES (
North America, USA, 1998, 2014, 12897);- Step 3: Now, you can run the following command to check whether the data is inserted or not.
SELECT * FROM hello_world;Output:

5) Configure the PostgreSQL with Grafana Data-Source
The PostgreSQL database and dummy data are installed and configured successfully.
Now, in the process of setting up Grafana PostgreSQL integration, you can connect the PostgreSQL database with the Grafana data source.
The steps followed to connect the PostgreSQL database with the Grafana data source are as follows:
- Step 1: Firstly, click on the Grafana icon in the top-left corner to open the side menu.
- Step 2: In the side menu bar that appears, under the Configuration icon you would find a link named Data Sources.
- Step 3: Now, you can click the “+ Add data source” button in the top header.
- Step 4: Type PostgreSQL in the search bar. Select “PostgreSQL” from the Type dropdown that appears.

- Step 5: After clicking on PostgreSQL, the configuration tab will appear. There you can insert the database details.
- Step 6: You can insert the following configuration.
Host : localhost:5432
User: postgres
Password : // database password that you enter during installation
SSL Mode: disable
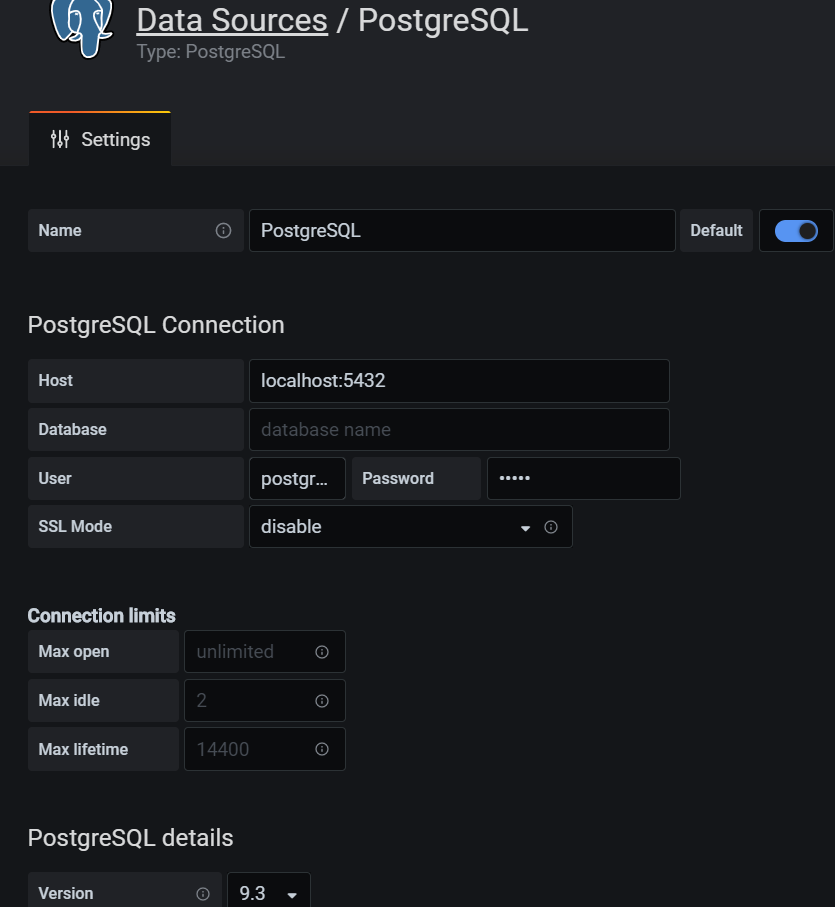
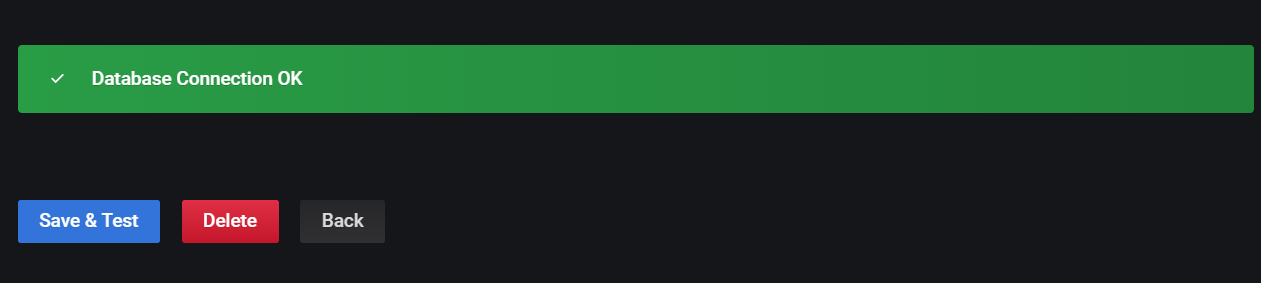
- Step 8: Scroll down and click on the “Save & Test” button. A message appears stating, ‘Database Connection OK’ which indicates that the PostgreSQL database is configured successfully with Grafana.
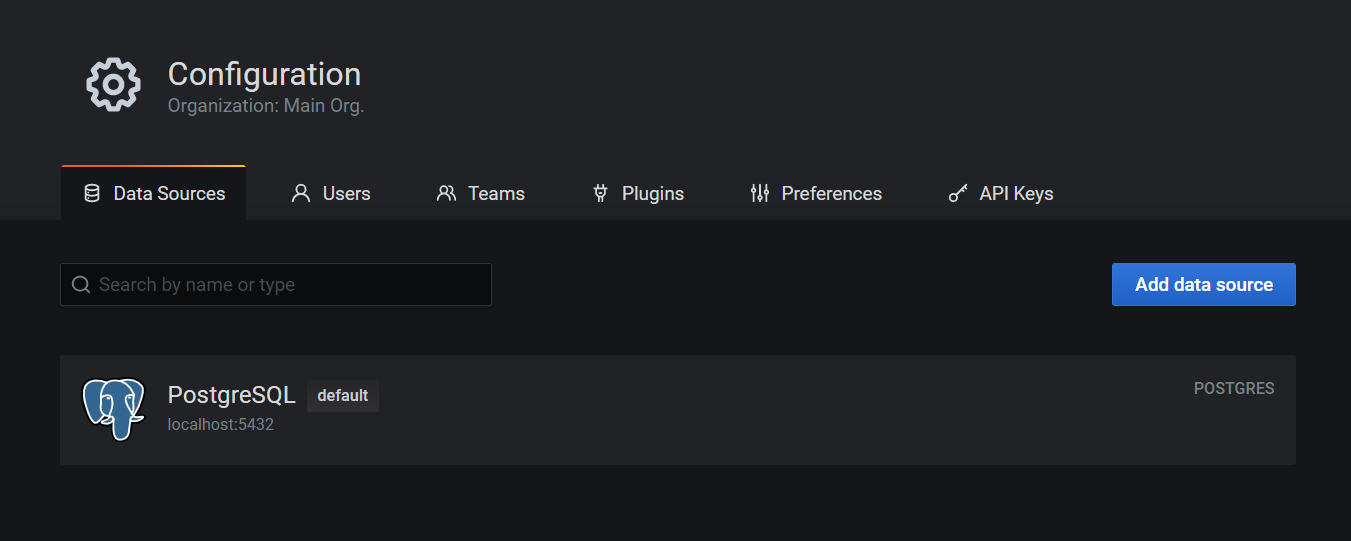
- Step 9: Go to the Configuration option and under the Data Sources tab, check whether the PostgreSQL database connection is visible.
6) Visualize the data on the Grafana dashboard
After configuring the PostgreSQL database successfully, you can now visualize the data in Grafana.
The steps followed to visualize the data on the Grafana dashboard as part of Grafana PostgreSQL Integration are as follows:
- Step 1: You can first create a dashboard in Grafana. For that, click on the Grafana icon in the top-left corner. Then, click on the “+” icon and click on the “Create” and select the “Dashboard” option.

- Step 2: It will create the “New Dashboard“.
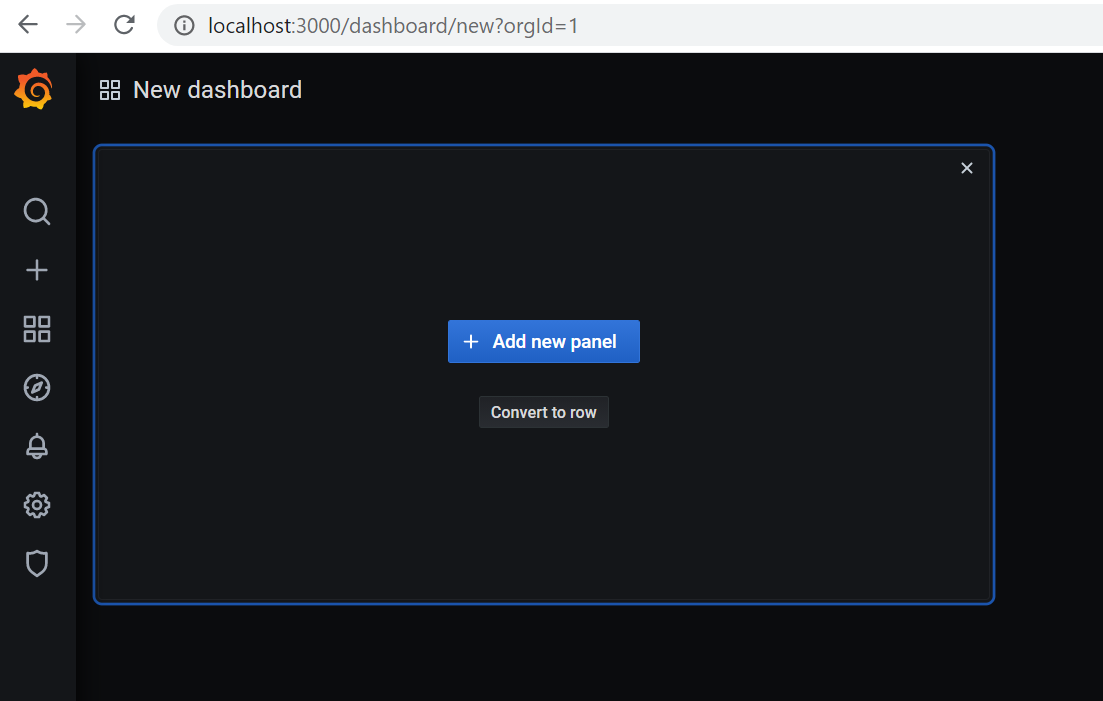
- Step 3: Now, you can click on the “+ Add new panel” button. It will open the panel such as given in the below image.
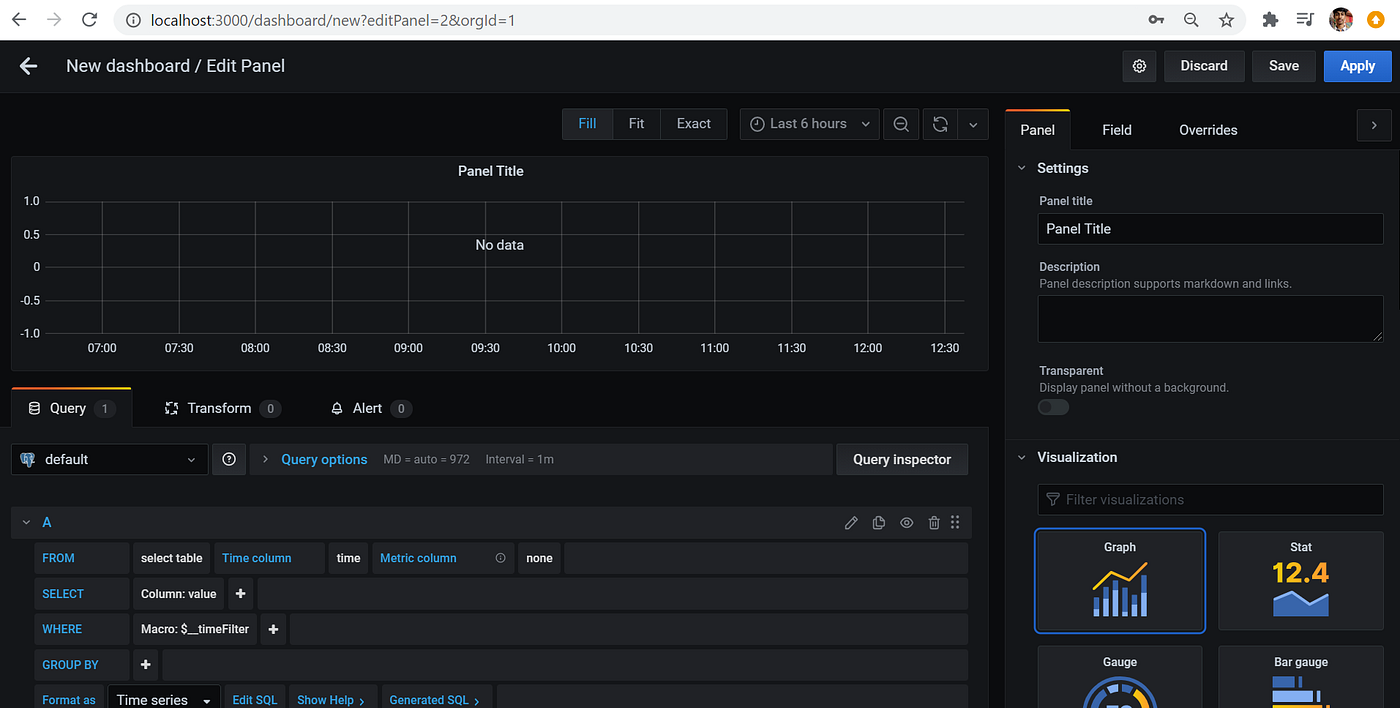
- Step 4: In the right-hand side section, go to the panel tab.
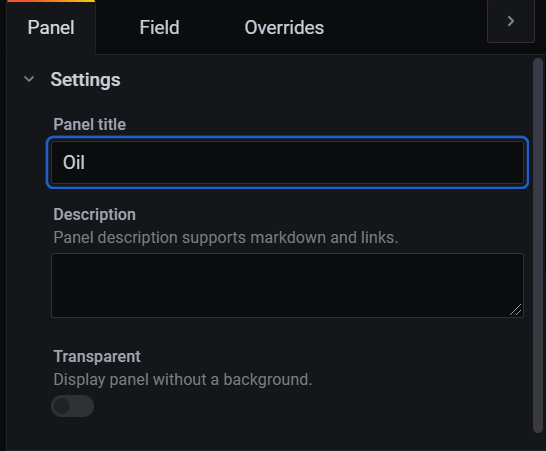
- Step 5: In the settings, you can give a title to the panel.
- Step 6: Scroll down and select the kind of visualization that you want to plot.

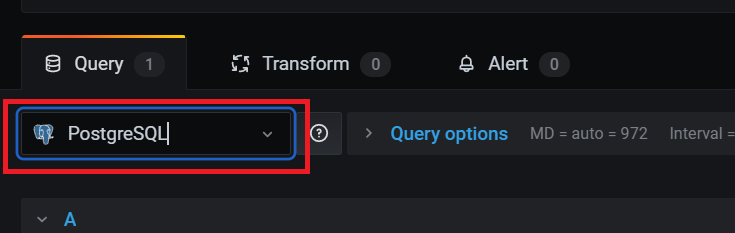
- Step 7: Now, you can select a Database source that you have created while configuring the database in the data-source tab.
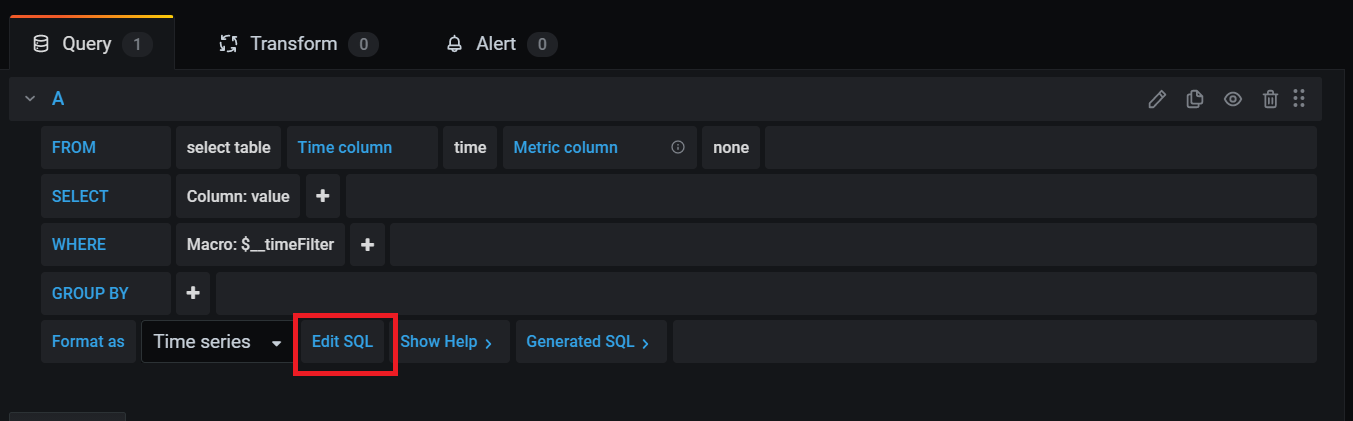
- Step 8: Now, click on the “Edit SQL” button.
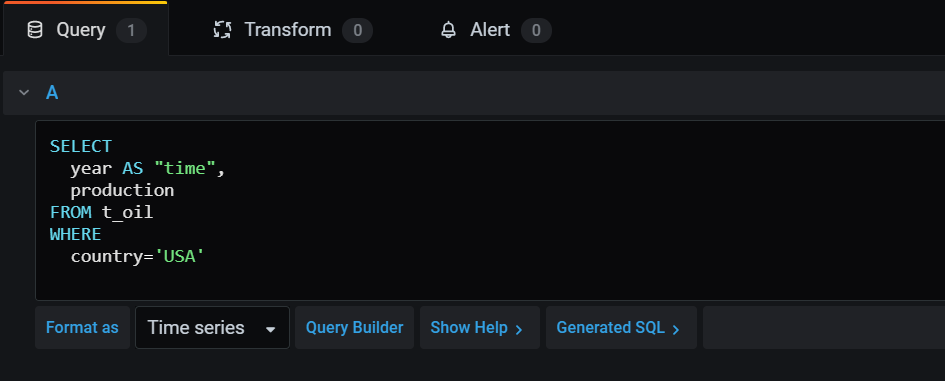
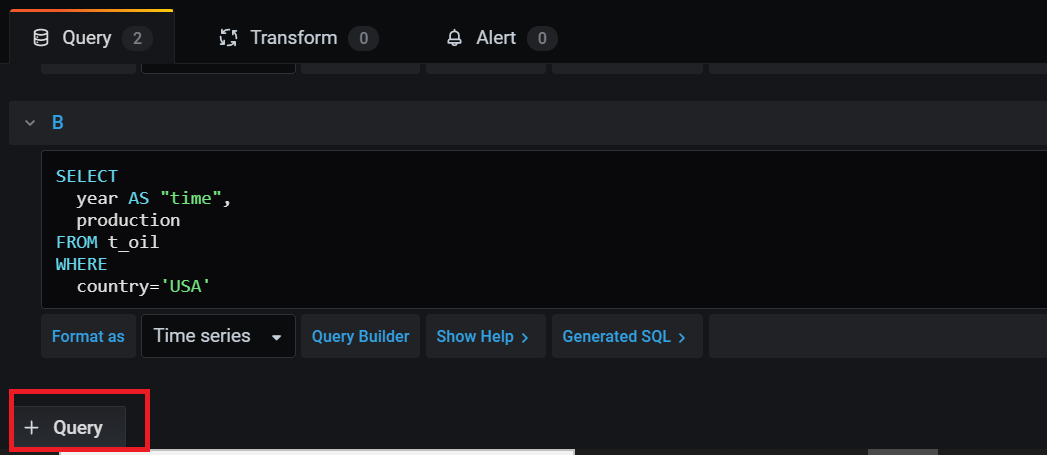
- Step 9: Now, you can type the SQL query in the query editor as given in the following image.
- Step 10: Now, click on the “Apply” button on the top. The dashboard thus created will look similar to as given in the following image.

- Step 11: You can also create a new panel for other parameters.
- Step 12: For making multiple graphs in a single graph, you can click on the “Query” tab and then add a new SQL query.
- Step 12: Click on the “Apply” button. The multiple graphs will look something similar to as given in the following image.

For further information on Grafana PostgreSQL Integration, you can visit Grafana Datasources PostgreSQL.
Conclusion
In this article, you have learned about Integration. This article also provided information on Grafana, PostgreSQL, their key features, and the steps for setting up Grafana PostgreSQL in detail. For further information on Grafana BigQuery Integration, Grafana PostgreSQL Integration, and PostgreSQL vs MySQL, you can visit the following links.
Share your experience of understanding Integration in the comment section below! We would love to hear your thoughts.

Share it with your connections.
-
 Share To X
-
 Share To LinkedIn
-
 Share To Facebook
-
 Copy Link


