

Microsoft’s Power BI is a technology-driven Business Intelligence tool for analyzing and visualizing raw data in order to present actionable data. It brings together Business Analytics, Data Visualization, and best practices to assist organizations in making data-driven decisions. Because of the capabilities of the Power BI platform, Gartner named Microsoft the Leader in the “2019 Gartner Magic Quadrant for Analytics and Business Intelligence Platform” in February 2019.
Power BI Model Relationships shows how two or more tables are linked. To put it another way, they show how these tables are related to one another. Model relationships, in particular, link a column from one table to another table’s column.
This article talks about Power BI Model Relationships extensively. It also gives an overview of Power BI.
Table of Contents
What is Power BI?

Eliminate repetitive data requests and empower teams to self-serve insights with AI-driven automation.
🔹 Chat with Your Data – Ask in plain English, get instant answers
🔹 AI-Driven Query Handling – Automate routine data requests
🔹 Seamless Integration – Connect with your favorite data sources
🔹 More Strategic Focus – Spend less time on reports, more on insights
Key Features of Power BI
Some of the main features of Power BI are listed below:
- Supports API Integrations: Power BI allows developers to easily integrate with other applications and embed dashboards into other software using sample codes and APIs.
- Custom Visualization: Power BI offers custom visualization library support that allows users to visualize complex data with ease.
- AI Support: Users can easily perform Data Analytics using Artificial Intelligence. With the built-in AI support, users can prepare data, build Machine Learning models, and gain insights.
- Modeling View: With the help of Modeling View, Power BI users can slice and divide complex data into simpler ones that help in better understanding the data, separate diagrams, and multi-select objects.
- Easy Sharing: Power BI makes it easier for users to easily share their reports within teams or organizations ensuring full data protection.
- Hybrid Development: Power BI easily integrates with many 3rd party connectors, applications, and services widely used by organizations that allow users to connect to various data sources.
What are Power BI Model Relationships?
Power BI Model Relationships pass filters from one model table’s column to another. Filters will propagate as long as there is a relationship path to follow, which could include multiple tables.
Filters are always propagated in the same way and without random variation along the relationship paths. However, model calculations that use specific DAX functions can disable relationships or change the filter context of relationships in Power BI. Data integrity is not enforced by Power BI model relationships.
With the help of an animated example, see how Power BI model relationships propagate filters.

The model in this example contains four tables: Category, Product, Year, and Sales. The Category table is linked to the Product table, which in turn is linked to the Sales table. The Sales table is also linked to the Year table. Every relationship is one-to-many.
A query, possibly prompted by a Power BI card visual, asks for the total sales quantity for sales orders placed in a single category, Cat-A, and for a single year, CY2018. That is why the Category and Year tables have filters applied. The Category table’s filter propagates to the Product table, isolating two products belonging to the Cat-A category.
The filters from the Product table are then propagated to the Sales table, resulting in only two sales rows for these products. The sales of products in category Cat-A are represented in these two sales rows. The total number of units they have is 14.
At the same time, the Year table filter propagates to the Sales table, leaving only one sales row for products in category Cat-A that were ordered in the year CY2018. The query’s quantity value is 11 units. It’s worth noting that applying multiple filters to a table (such as the Sales table in this example) is always an AND operation, requiring that all conditions be true.
Understanding Power BI Model Relationships
- Power BI Model Relationships: Relationship Purpose
- Power BI Model Relationships: Relationship Properties
- Power BI Model Relationships: Relevant DAX Functions
- Power BI Model Relationships: Relationship Evaluation
- Power BI Model Relationships: Precedence Rules
- Power BI Model Relationships: Performance Preference
Power BI Model Relationships: Relationship Purpose
Apply Star Schema Design Principals
To create a model with dimensions and fact tables, it is recommended to use star schema design principles. Power BI can be configured to enforce rules that filter dimension tables, allowing Power BI model relationships to efficiently propagate those filters to fact tables.
The model below contains a Date table, a Ship Date table, and a Delivery Date table, all of which have a single and active relationship to their respective reseller Sales table columns.

Disconnected Tables
A model table that isn’t connected to another model table is unusual. A disconnected table is a term for such a table in a valid model design. Filters from a disconnected table aren’t supposed to spread to other model tables. Instead, it accepts “user input” (possibly via a slicer visual), allowing model calculations to make sense of the value. Consider a table with a range of currency exchange rate values that is disconnected. A measure expression can use that value to convert sales values as long as a filter is applied to filter by a single rate value.
A feature in Power BI Desktop that creates a disconnected table is the what-if parameter.
Power BI Model Relationships: Relationship Properties
Power BI model relationships connect one table column to another table’s column. Relationships between columns in the same table are not possible. This concept is frequently confused with the ability to create a table self-referencing relational database foreign key constraint. Parent-child relationships can be stored using this relational database concept (for example, each employee record is related to a “reports to” employee). This type of relationship, on the other hand, cannot be used to generate a model hierarchy.
Cardinality
A Cardinality type characterizes each of the Power BI model relationships. The data characteristics of the “from” and “to” related columns are represented by four cardinality types. The “one” side indicates that the column contains unique values, while the “many” side indicates that the column may contain duplicates.
The four choices are listed below, along with their shorthand notations:
- One-to-many (1:*)
- Many-to-one (*:1)
- One-to-one (1:1)
- Many-to-many (*:*)
The cardinality type is automatically detected and set when you create a relationship in Power BI Desktop. Power BI Desktop runs a query against the model to determine which columns have unique values. It uses internal storage statistics for import models and sends profiling queries to the data source for DirectQuery models. However, Power BI Desktop can make mistakes from time to time. When tables aren’t yet loaded with data, or when columns that you expect to have duplicate values now have unique values, it can go wrong. You can update the cardinality type in either case as long as any “one” side columns have unique values (or the table is yet to be loaded with rows of data).
One-to-Many (and Many-to-One) Cardinality
The one-to-many and many-to-one cardinality options are nearly identical, and they’re also the most common.
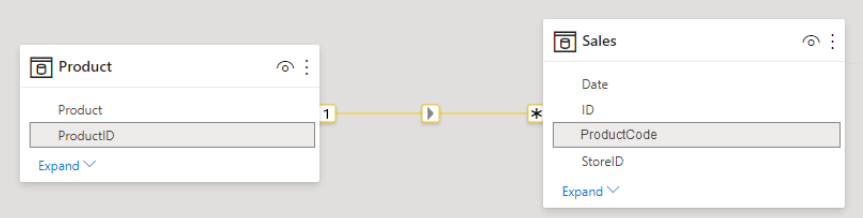
When configuring a one-to-many or many-to-one relationship, select the option that corresponds to the order in which the columns were related. Consider how you’d use the ProductID column in each table to configure the relationship between the Product and Sales tables. Because the ProductID column in the Product table contains unique values, the cardinality type would be one-to-many. The cardinality would be many-to-one if the tables were related in the opposite direction, from Sales to Product.
One-to-One Cardinality
Both columns in a one-to-one relationship have unique values. This cardinality type is uncommon, and it most likely indicates a suboptimal model design due to redundant data storage.
Many-to-Many Cardinality
Both columns can have duplicate values in a many-to-many relationship. This is a rare cardinality type. When creating complex model requirements, it’s usually useful. It can be used to connect many-to-many facts or to connect facts of a higher grain. When sales target facts are stored at the product category level and the product dimension table at the product level, for example.
Models created for Power BI Report Server do not currently support the Many-to-Many cardinality type.
Cross Filter Direction
A Cross Filter Direction is assigned to each of the Power BI model relationships. The direction(s) in which filters propagate is determined by your setting. The cardinality type determines the cross filter options available.
| Cardinality type | Cross filter options |
| One-to-many (or Many-to-one) | SingleBoth |
| One-to-one | Both |
| Many-to-many | Single (Table1 to Table2)Single (Table2 to Table1)Both |
The terms “single cross filter direction” and “both cross filter direction” are interchangeable. Bi-directional relationships are those that filter both ways.
The cross filter direction for one-to-many relationships is always from the “one” side, with the “many” side being optional (bi-directional). The cross filter direction is always from both tables for one-to-one relationships. Finally, cross filter direction for many-to-many relationships can come from one or both tables. When a cardinality type has a “one” side, filters will always propagate from that side.
A new property becomes available when the cross filter direction is set to Both. When Power BI applies Row-Level Security (RLS) rules, it can apply bi-directional filtering. A model calculation can be used to change the relationship cross filter direction, including disabling filter propagation. The CROSSFILTER DAX function is used to accomplish this.
Bidirectional relationships can have a negative impact on performance. In addition, attempting to set up a bi-directional relationship may result in ambiguous filter propagation paths. Power BI Desktop may fail to commit the relationship change in this case, and an error message will appear. Power BI Desktop, on the other hand, may occasionally allow you to define ambiguous relationship paths between tables.
The arrowhead(s) along the relationship line in the Power BI Desktop model view can be used to interpret a relationship’s cross filter direction. A single arrowhead indicates a single-direction filter in the arrowhead’s direction, while a double arrowhead indicates a bi-directional relationship.

Make this Relationship Active
Between two model tables, only one active filter propagation path is allowed. Additional relationship paths can be added, but they must be set to inactive. Only during the evaluation of a model calculation can inactive relationships be turned active. The USERELATIONSHIP DAX function is used to achieve this.
It is generally recommended that active relationships be defined whenever possible. They broaden the scope and potential of report authors’ use of your model. Role-playing dimension tables should be duplicated in your model if only active relationships are used.
You can, however, define one or more inactive relationships for a role-playing dimension table in specific circumstances. You should think about this design when:
- There is no requirement for report visuals to filter by multiple roles at the same time.
- The USERELATIONSHIP DAX function is used to turn on a specific relationship for model calculations.
The active vs inactive status of a relationship can be interpreted in the Power BI Desktop model view. A solid line indicates an active relationship, while a dashed line indicates an inactive relationship.

Assume Referential Integrity
Only one-to-many and one-to-one relationships between two DirectQuery storage mode tables belonging to the same source group are eligible for the Assume referential integrity property. Only when the “many” side column does not contain NULLs can you enable this property.
When this option is enabled, native queries sent to the data source will use an INNER JOIN instead of an OUTER JOIN to join the two tables together. Enabling this property improves query performance in general, but it is dependent on the data source’s specifics.
When a database foreign key constraint exists between two tables, this property should always be enabled. Consider enabling the property even if there isn’t a foreign key constraint, as long as data integrity is guaranteed.
If the data integrity of the tables is jeopardized, the inner join will remove any unmatched rows. Consider a model Sales table with a ProductID column value that was missing from the related Product table. Sales rows for unknown products will be eliminated by filter propagation from the Product table to the Sales table. As a result, the sales figures would be exaggerated.
Power BI Model Relationships: Relevant DAX Functions
Several DAX functions are useful for Power BI model relationships. In the bulleted list below, each function is briefly described:
- RELATED: Gets the value of a relationship from “one” side. It comes in handy when working with calculations from multiple tables that are evaluated row by row.
- RELATEDTABLE: Retrieve a table of rows from the relationship’s “many” side.
- USERELATIONSHIP: Uses a specific inactive Power BI model relationships by default. It comes in handy when your model has a role-playing dimension table and you want to create inactive relationships from it.
- CROSSFILTER: Filter propagation is disabled or the relationship cross filter direction is changed (to one or both) (none). It comes in handy when you need to change or ignore Power BI model relationships while evaluating a calculation.
- COMBINEVALUES: Concatenates two or more text strings into one. When tables in the same source group belong to the same source group, this function supports multi-column relationships in DirectQuery models.
- TREATAS: Filters columns from an unrelated table using the results of a table expression. It’s useful in advanced scenarios when you need to create a virtual relationship while evaluating a calculation.
- Parent and Child Functions: A collection of related functions for creating calculated columns to naturalize a parent-child hierarchy. These columns can then be used to create a fixed-level hierarchy.
Power BI Model Relationships: Relationship Evaluation
Power BI Model relationships are classified as regular or limited in terms of evaluation. It’s not a relationship property that can be changed. In fact, the cardinality type and data source of the two related tables infer it. It’s critical to understand the evaluation type because data integrity can have performance implications or consequences.
To fully understand relationship evaluations, some modeling theory is required first.
All of the data for an import or DirectQuery model comes from the Vertipaq cache or the source database. Power BI can detect the existence of a “one” side of a relationship in both cases.
A composite model is illustrated below.
The composite model in this case is made up of two source groups: a Vertipaq source group and a DirectQuery source group. Three tables are in the Vertipaq source group, and two are in the DirectQuery source group. A table in the Vertipaq source group can be linked to a table in the DirectQuery source group using a cross source group relationship.
Regular Relationships
When the query engine can identify the “one” side of the Power BI model relationships, it is considered regular. It has been confirmed that the “one” side column has unique values. Regular relationships exist in all one-to-many intra-source group relationships.
Two regular relationships, both marked R, are shown in the following example. The Vertipaq source group contains a one-to-many relationship, as does the DirectQuery source.
Power BI creates a data structure for each regular relationship in import models where all data is stored in the Vertipaq cache at data refresh time. The data structures are indexed mappings of all column-to-column values, and their goal is to speed up joining tables during query execution.
Regular relationships allow table expansion to occur during query execution. By including the native columns of the base table and then expanding into related tables, table expansion results in the creation of a virtual table. Table expansion occurs in the query engine for import tables and in the native query sent to the source database for DirectQuery tables (as long as the Assume referential integrity property is not enabled). The query engine then operates on the expanded table, applying filters and grouping by the expanded table columns’ values.
Even if the relationship isn’t used by a calculation, inactive relationships are expanded. Table expansion is unaffected by bidirectional relationships.
Table expansion from the “many” to the “one” sides of one-to-many relationships is accomplished using LEFT OUTER JOIN semantics. A blank virtual row is added to the “one” side table when a matching value from the “many” side does not exist. Only regular relationships, not limited relationships, are subject to this behavior.
For one-to-one intra-source group relationships, table expansion occurs as well, but with FULL OUTER JOIN semantics. When this join type is used, blank virtual rows are added to both sides.
Virtual rows with no members are effectively unknown. Referential integrity violations occur when the “many” side value does not correspond to a “one” side value. These blanks should, in theory, not exist. The source data can be cleaned or repaired to remove them.
With an animated example, here’s how table expansion works.

The model consists of three tables in this example: Category, Product, and Sales. A One-to-many relationship exists between the Category and Product tables, and between the Product and Sales tables. Two rows comprise the Category table, three rows comprise the Product table, and five rows comprise the Sales table. There are no referential integrity violations because both sides of all relationships have matching values.
The result is a query-time expanded table. The columns from all three tables are combined in this table. It’s essentially a denormalized view of the information in the three tables. A new row is added to the Sales table, with a production identifier value of (9), which has no match in the Product table. It’s a violation of referential integrity. The Category and Product table columns in the expanded table have (Blank) values in the new row.
Limited Relationships
When there’s no guaranteed “one” side, the Power BI model relationships are limited. There are two types of limited relationships:
- Many-to-many cardinality is used in the relationship (even if one or both columns contain unique values).
- It’s a cross-source relationship (which can only ever be the case for composite models).
Two limited relationships, both labelled L, are shown in the following example. Within the Vertipaq source group, there is a many-to-many relationship, and there is a one-to-many relationship between source groups.
Limited relationships are never created in data structures for import models. Table joins are resolved at query time in this case by Power BI.
For limited relationships, table expansion does not occur. Blank virtual rows aren’t added to compensate for referential integrity violations because table joins use INNER JOIN semantics.
Other constraints that come with limited relationships include:
- The “one” side column values cannot be retrieved with the RELATED DAX function.
- The topology of enforcing RLS is limited.
It’s not always easy to tell whether the Power BI model relationships are regular or limited in the Power BI Desktop model view. A many-to-many relationship, like a one-to-many relationship when it’s a cross-source group relationship, will always be limited. To figure out if it’s a cross source group relationship, look at the table storage modes and data sources.
Power BI Model Relationships: Precedence Rules
Multiple, and thus ambiguous, filter propagation paths between model tables can be introduced by bi-directional relationships. The precedence rules used by Power BI for ambiguity detection and path resolution are listed below:
- Many-to-one and one-to-one relationships, as well as limited relationships
- Many-to-Many relationships
- In the opposite direction, bi-directional relationships (that is, from the “many” side)
Power BI Model Relationships: Performance Preference
From fastest to slowest, the following list ranks the performance of filter propagation:
- One-to-many intra source group relationships
- Many-to-many Power BI model relationships are achieved with an intermediary table and that involve at least one bi-directional relationship
- Many-to-many cardinality relationships
- Cross source group relationships
Learn More About:
Conclusion
This blog describes Power BI Model Relationships in detail. In addition, it gives a brief introduction to Power BI relationships. Optimize your Power BI reports by mastering the RELATED function to connect and analyze data across multiple tables.
Power BI is a great tool for performing Data Analytics and Visualization for your business data. However, at times, you need to transfer this data from multiple sources to your PowerBI account for analysis. Building an in-house solution for this process could be an expensive and time-consuming task. Hevo Data, on the other hand, offers a No-code Data Pipeline that can automate your data transfer process, hence allowing you to focus on other aspects of your business like Analytics, Customer Management, etc.
This platform allows you to transfer data from 150+ sources to BI tools like Power BI, and Cloud-based Data Warehouses like Snowflake, Google BigQuery, Amazon Redshift, etc. It will provide you with a hassle-free experience and make your work life much easier.
Want to take Hevo for a spin? Sign Up for a 14-day free trial and experience the feature-rich Hevo suite firsthand. You can also have a look at the unbeatable pricing that will help you choose the right plan for your business needs.
Frequently Asked Questions
What are the 3 connection types in Power BI?
The three connection types in Power BI are:
Import: Data is imported into Power BI, stored, and refreshed on a schedule.
DirectQuery: Power BI queries the data source directly without storing data.
Live Connection: Power BI connects live to external datasets, like Power BI datasets or SQL Server Analysis Services.
How many types of relationships are there in Power BI?
There are 4 types of cardinality in Power BI:
One-to-many (1:*)
Many-to-one (*:1)
One-to-one (1:1)
Many-to-many (*:*)
What is model relationship?
A model relationship in Power BI defines how tables are connected within a data model. It establishes a link between two tables based on common fields, allowing for the integration of data for analysis and reporting.
Share it with your connections.
-
 Share To LinkedIn
-
 Share To Facebook
-
 Share To X
-
 Copy Link


