Customers are important to every company’s success in today’s dynamic market. For any industry driven by client demands, knowing your customers and addressing their requirements with your products and services is critical to success. However, because of the large volume of data generated by user interactions, firms are finding it difficult to handle information prepared to address client complaints. Nonetheless, there are creative methods to get over these roadblocks and turn them into new possibilities. Using Zendesk Dashboard in the corporate framework you can visualize such Metrics.
On a complete walkthrough of this article, you will gain a decent understanding of the Zendesk Dashboard along with the steps to work with the Pre-Built Zendesk Dashboard.
Table of Contents
Introduction to Zendesk
Zendesk is a Cloud-based all-in-one Customer Service Platform that is utilized by a wide range of businesses, from small businesses to huge companies. Zendesk provides businesses with a full view of the customer by utilizing customer interaction data. As a result, its products are designed to include and improve based on user feedback gathered through beta and Early Access Programs (EAPs).
Key Features of Zendesk
The following are some of the key features of Zendesk Dashboard Software:
- Agent Collision Detection: With this feature, businesses may see if other agents are looking at the same ticket at the same time. When agents begin working on an issue or ticket, this indication becomes active. Zendesk also enables real-time collaboration among support agents working on the same issue by changing ticket data on the fly.
- Internal Desk Help: Internal Help Desk Software from Zendesk allows you to manage employee interactions and swiftly answer questions and support requests. It also comes with features to help your employees become more productive by boosting morale and reducing costly downtime.
- Self-Service: Businesses can develop a Self-Service Customer Portal using Zendesk’s Knowledge Base and community services. The Self-Service functionality, when combined with the AI-powered bot, may direct FAQs and low-touch tickets to the portal, freeing up corporate agents to focus on high-value issues and possible leads. It improves the customer service process efficiency.
- Customization: Zendesk offers a variety of customization options that may be modified to fit a company’s style and identity. Within the Zendesk Customer Support Platform, companies may build and improve customizations using more than 100 APIs. They can also use the Zendesk Customization Panel to change the logo, name, fonts, and color.
- Third-Party Integration: Zendesk enables businesses to integrate data from a range of third-party sources. This provides users with a complete 360-degree view of the data, which can be used to improve decision-making and growth potential.
- Analytics and Reporting: Zendesk has a real-time analytics tracking system and reporting module that analyses data on agent performance, tickets, and customer satisfaction. Users can use the filters and dynamic Dashboard to change the data and come up with new findings. CSAT Rating, Satisfaction Prediction, Net Promoter Score (NPS) Survey, and Performance Dashboard are some of the options. The CSAT rating informs agents of how satisfied consumers are with the service, whereas the NPS predicts the likelihood of a customer returning for additional services.
For further information on Zendesk, check out the official website Zendesk’s Official Website.
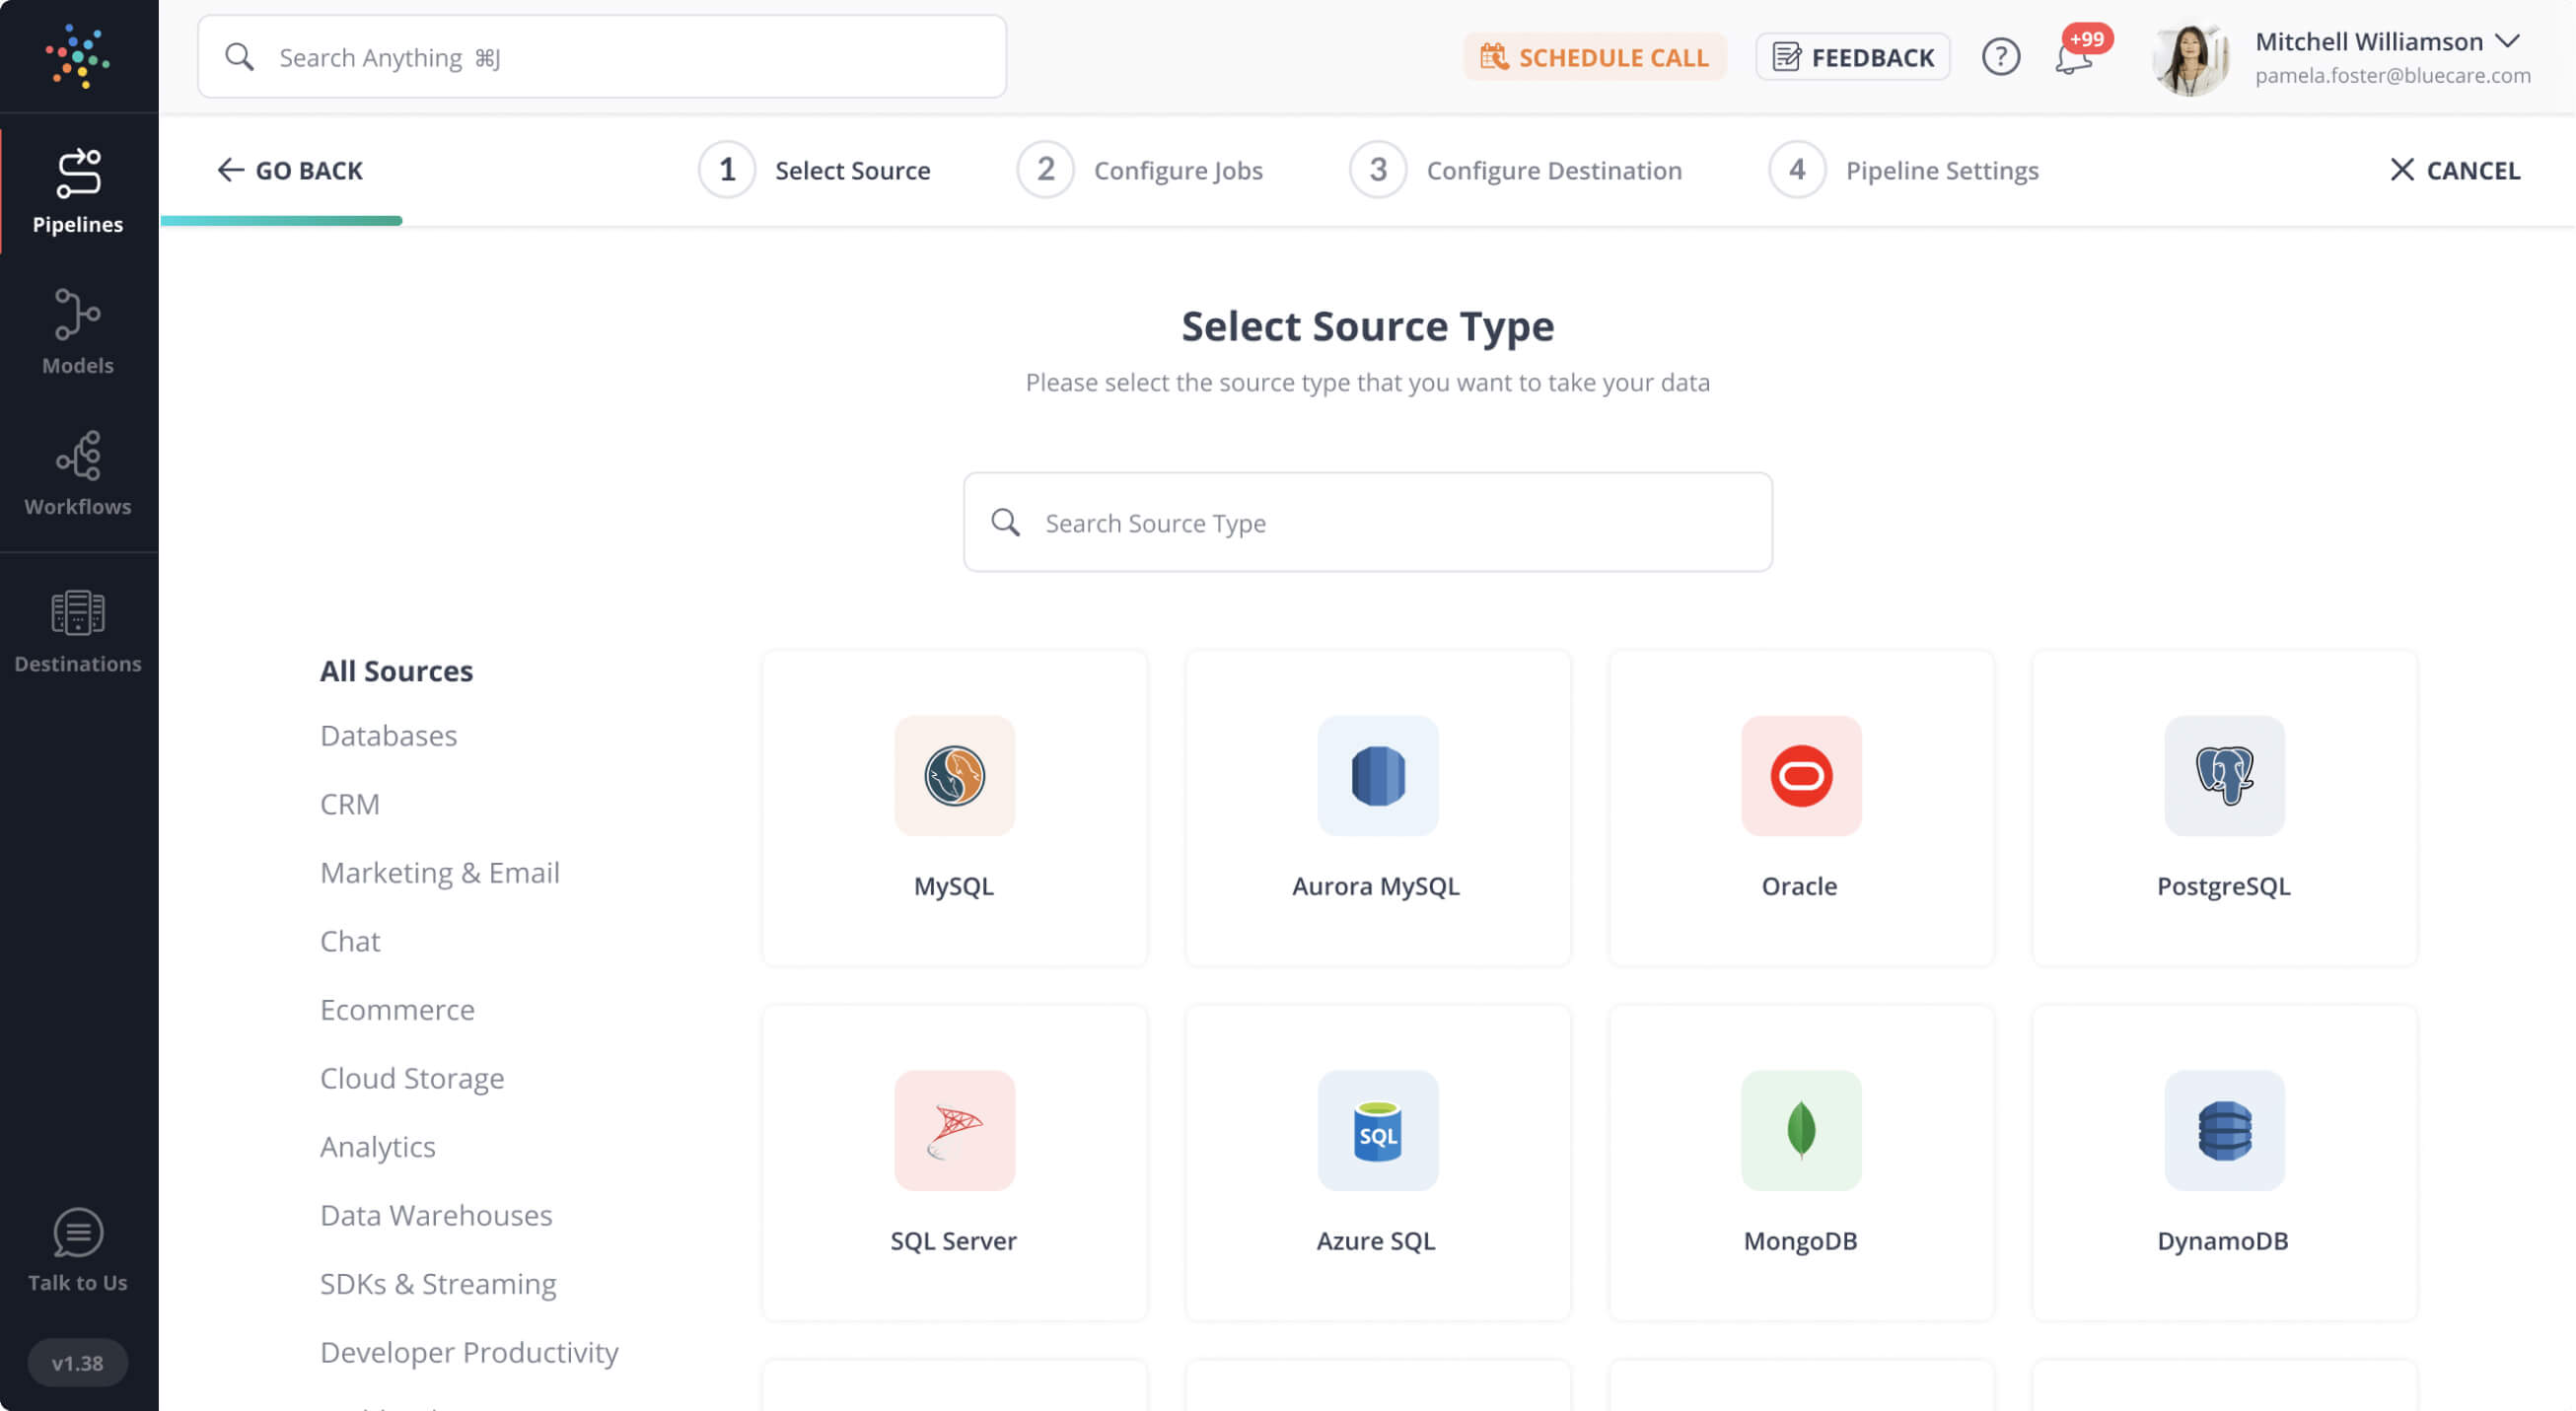
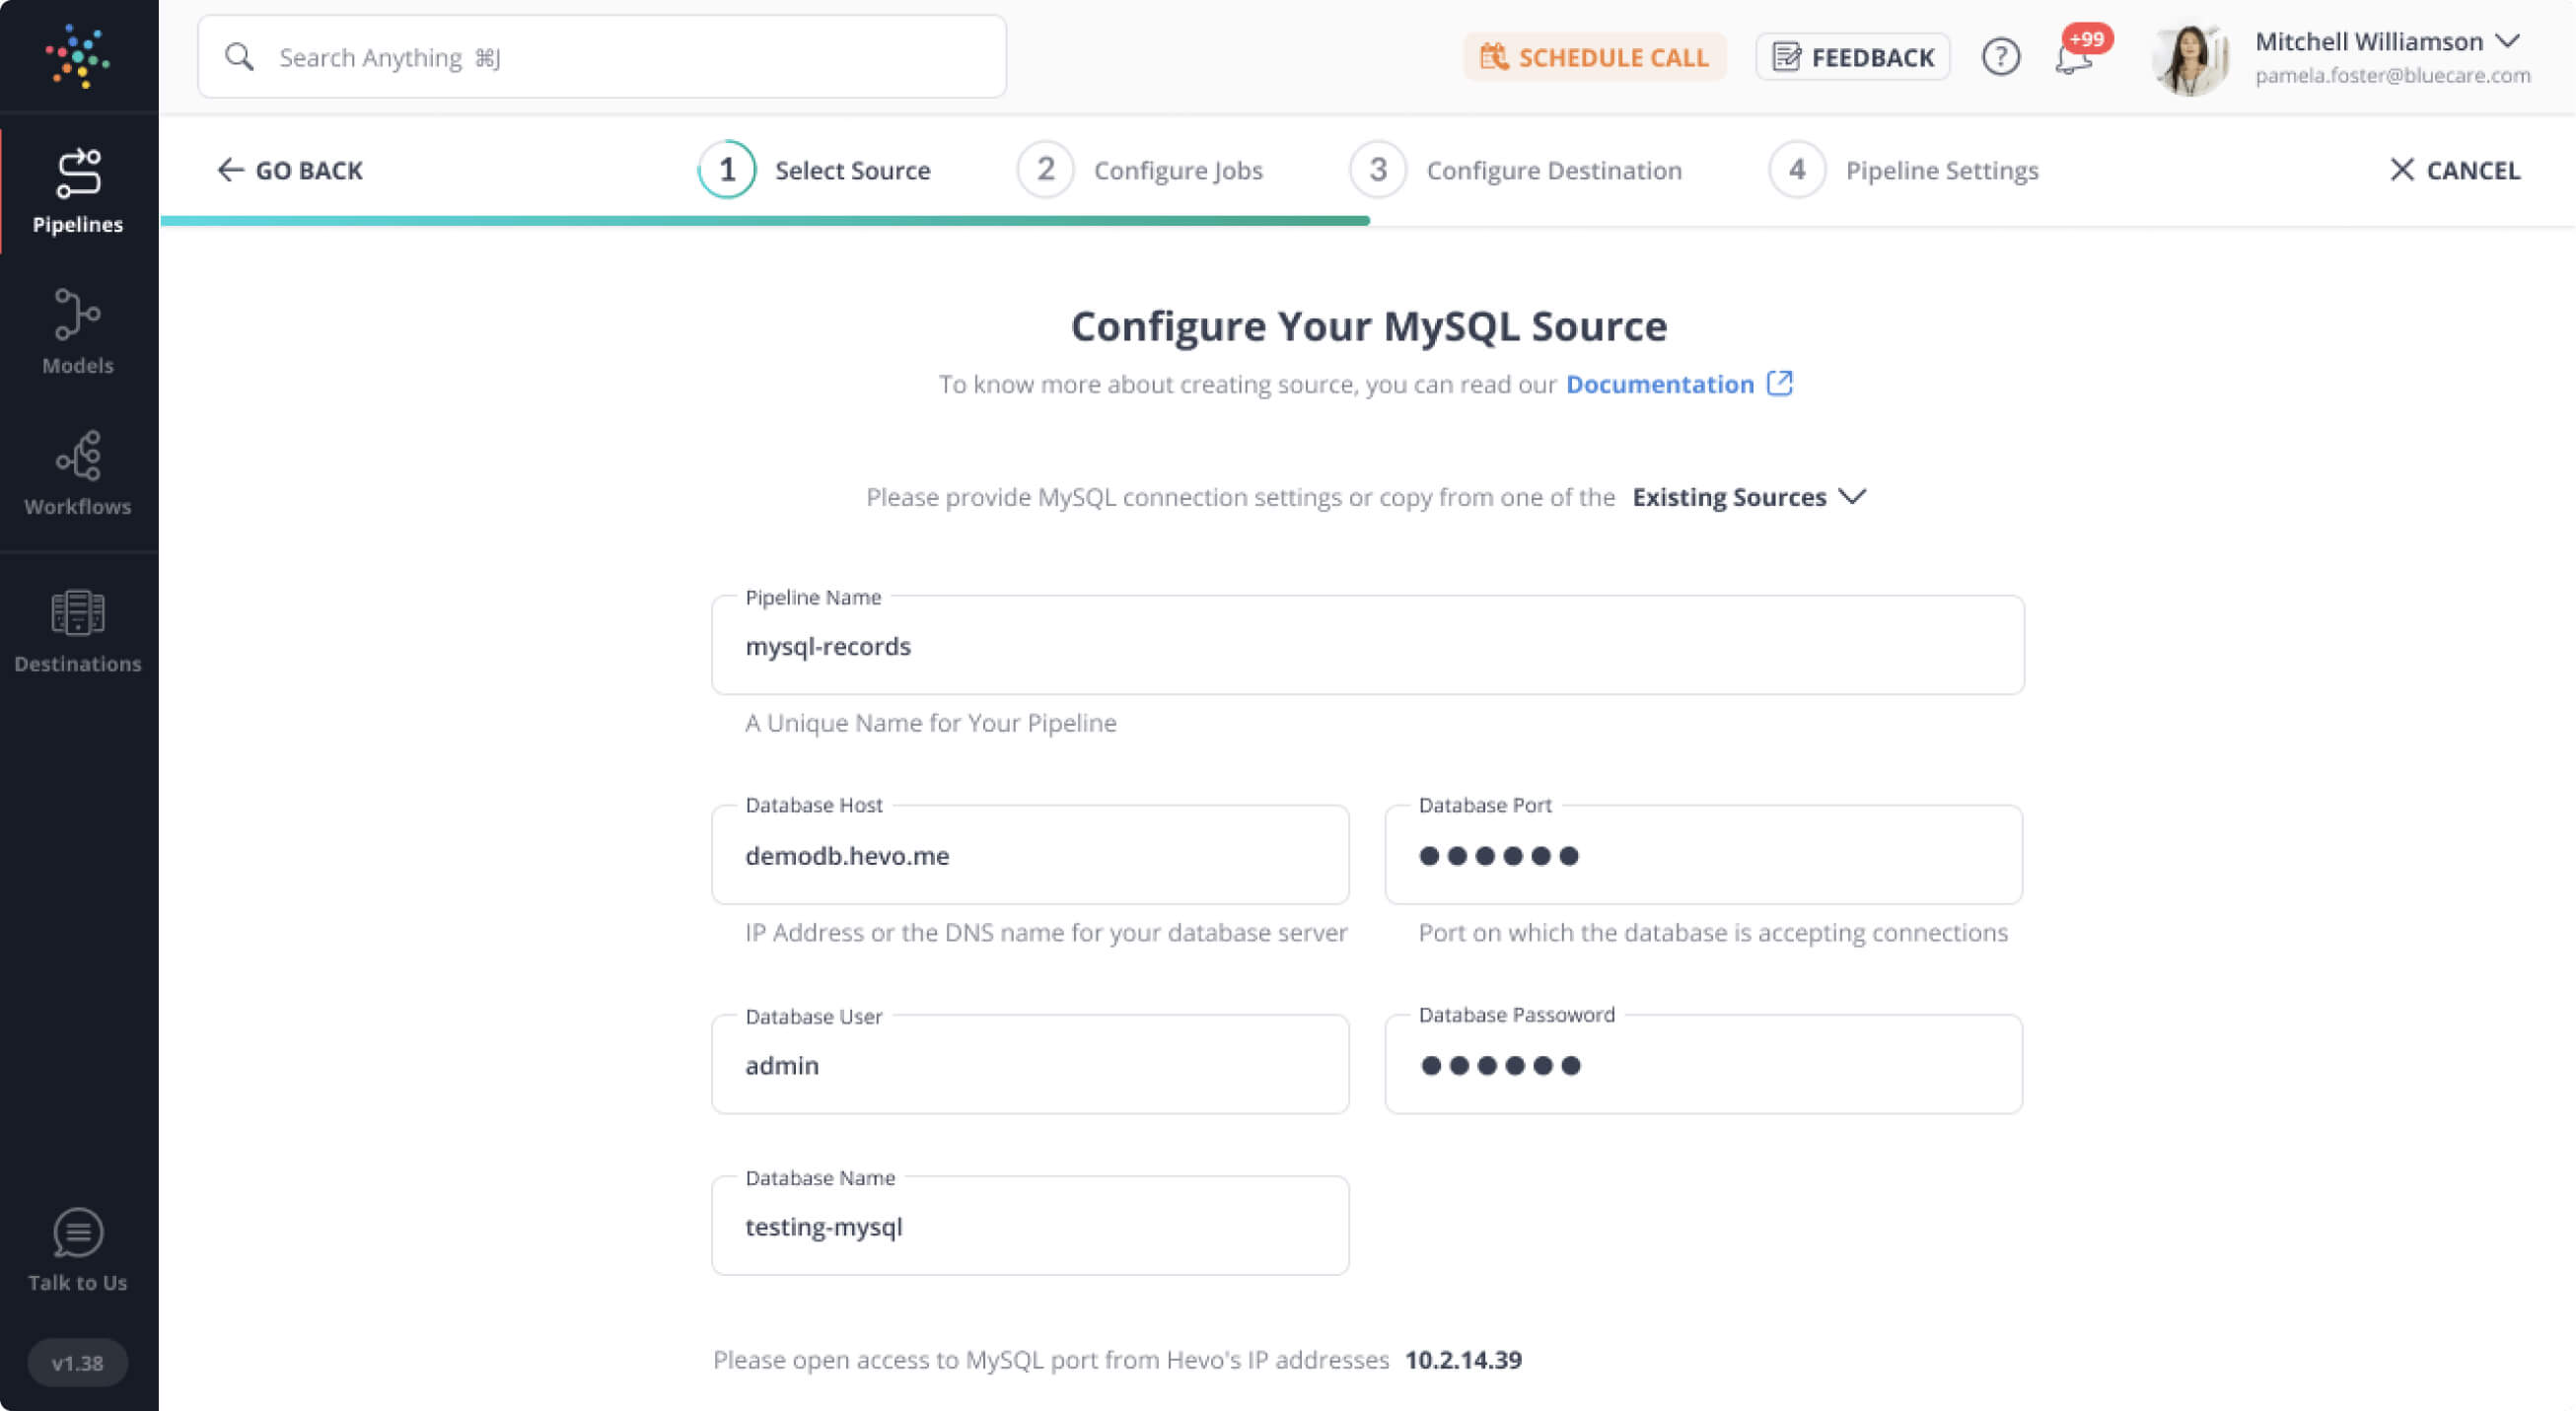
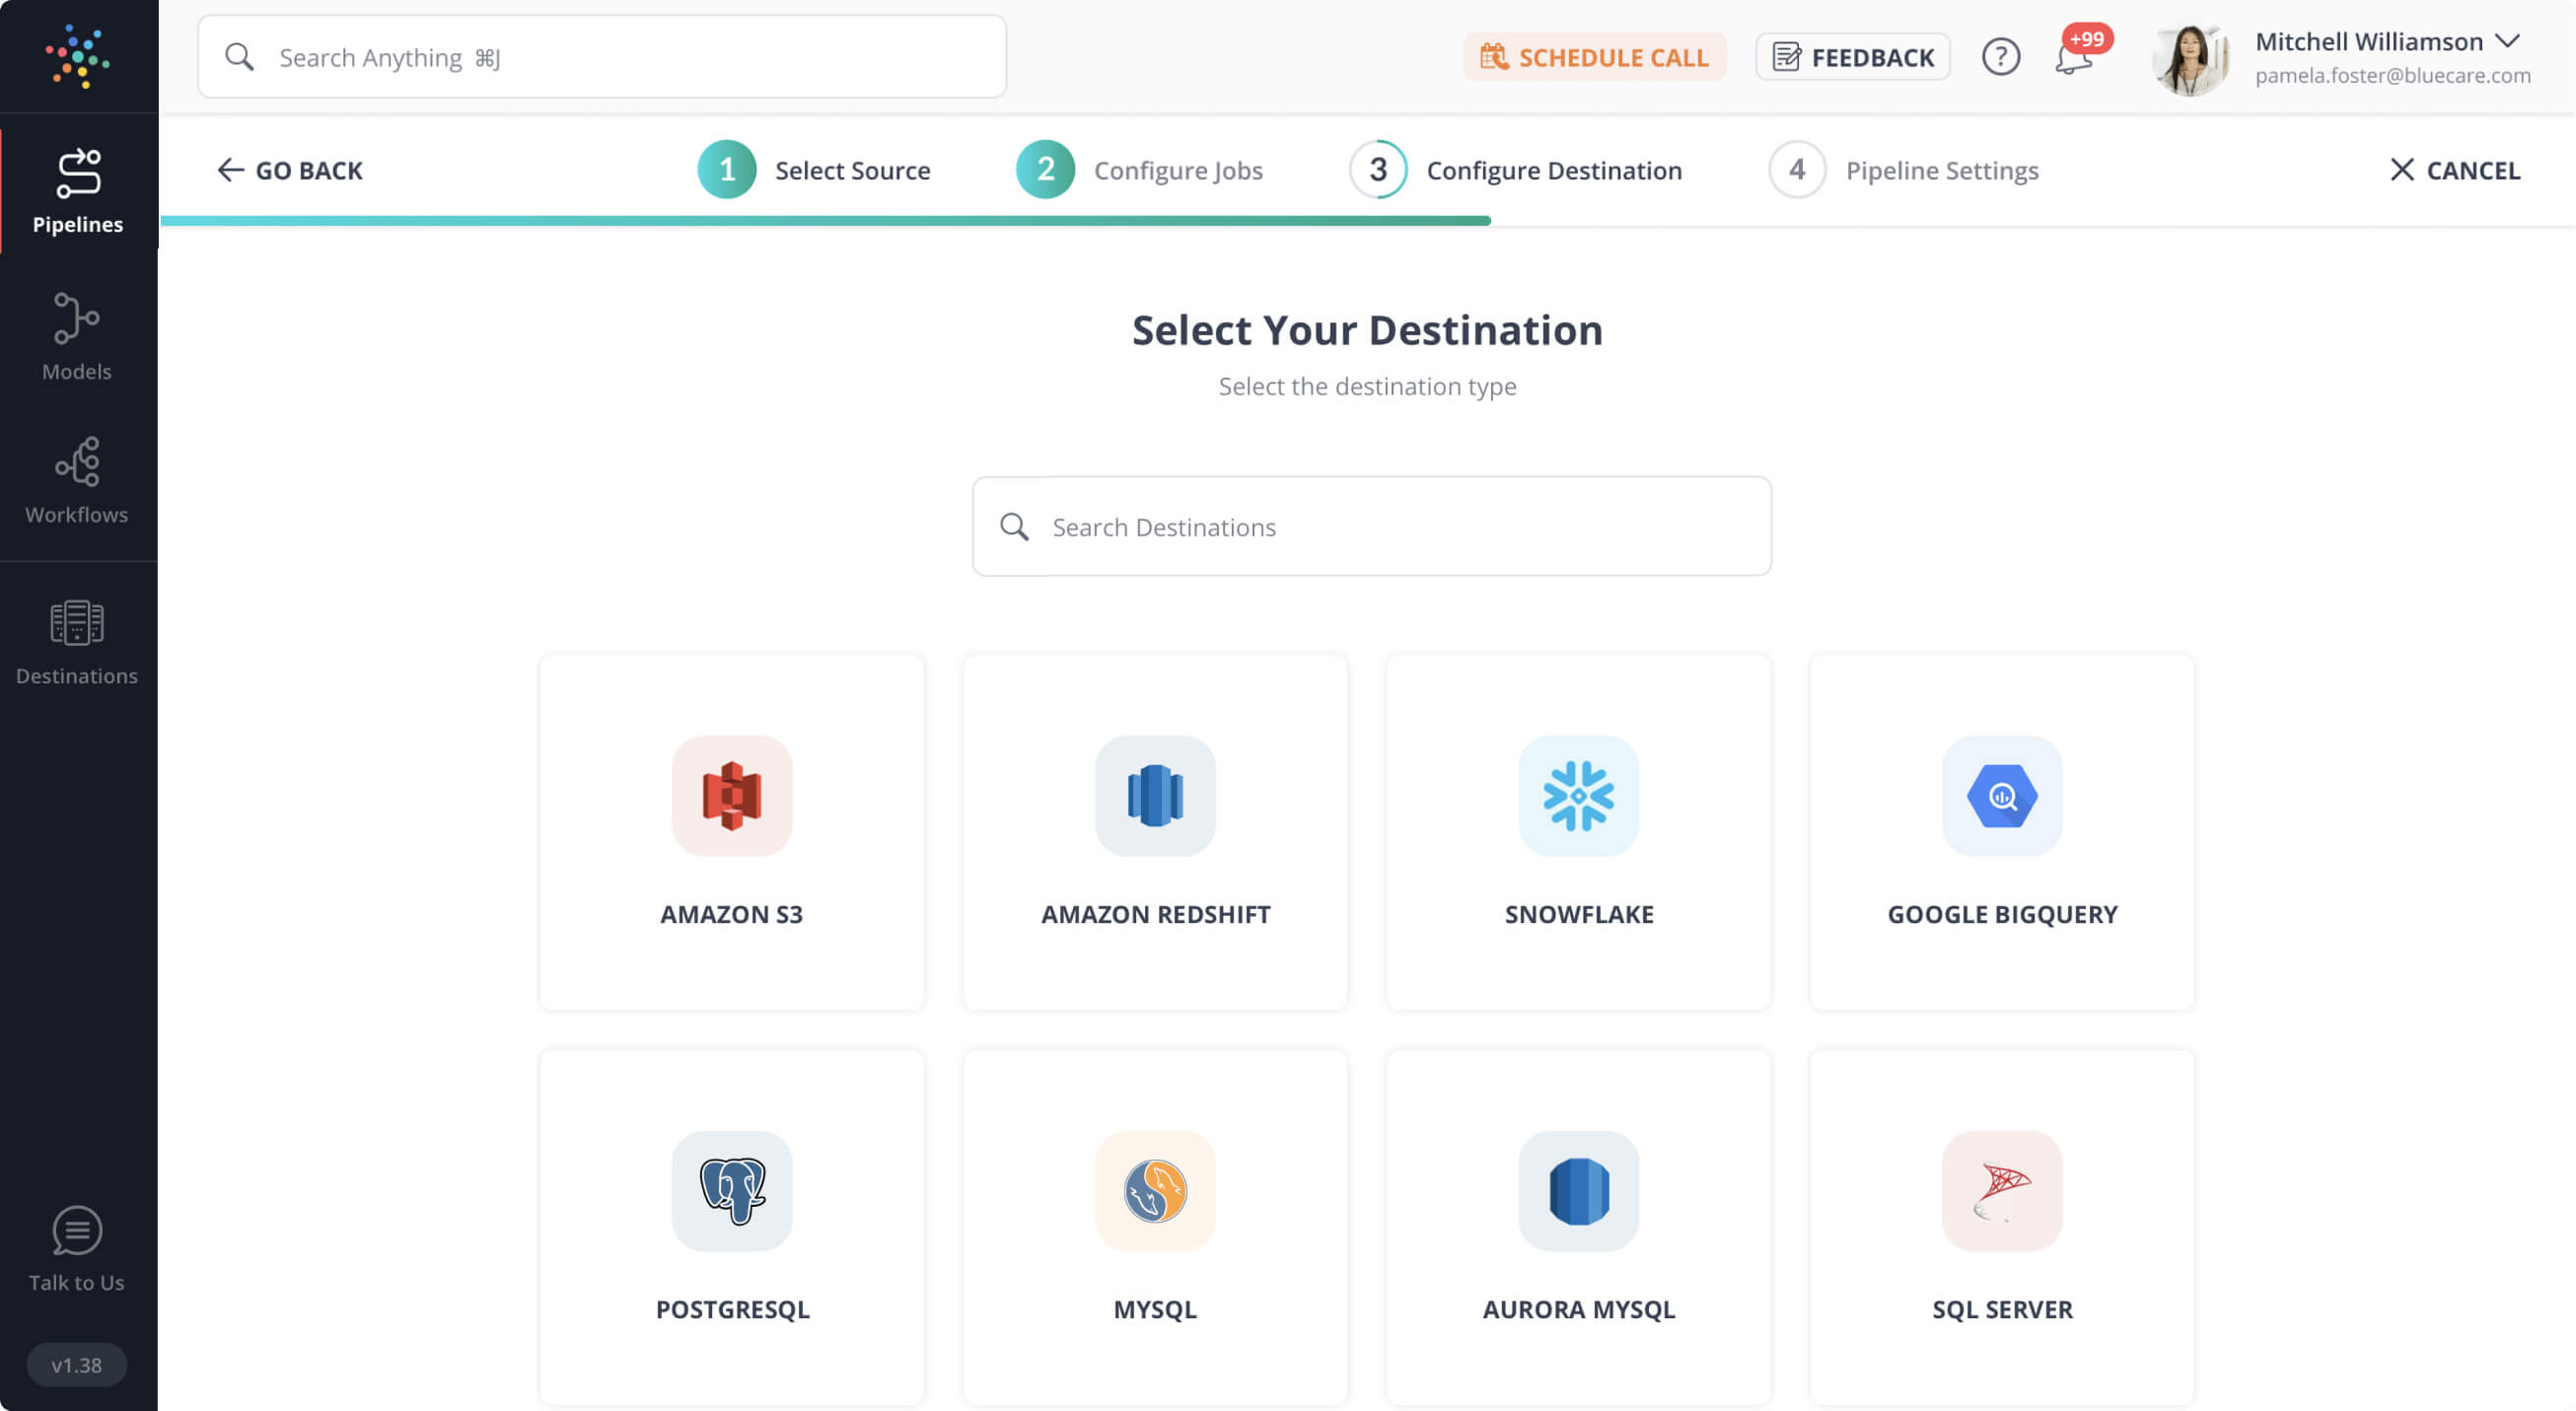
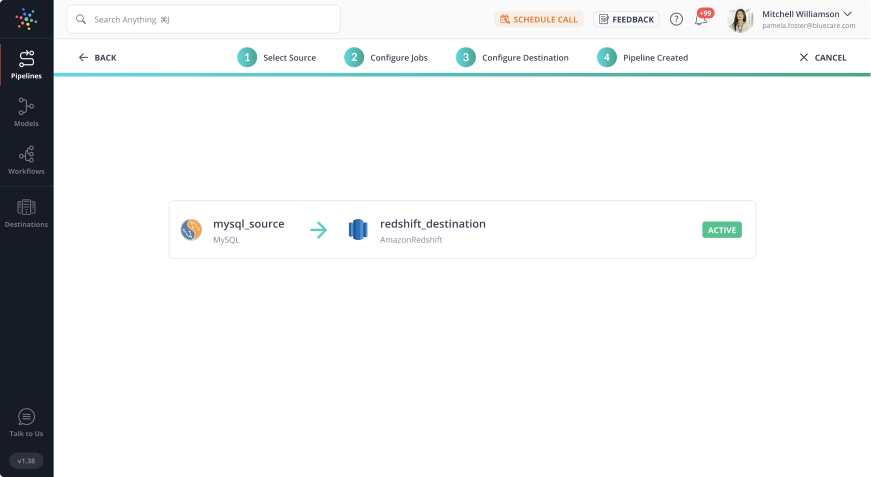
Seamlessly migrate your Zendesk data for enhanced customer service insights. With Hevo’s no-code platform, you can easily transfer your Zendesk support tickets, interactions, and reports to a data warehouse, unlocking powerful analytics and actionable insights for better decision-making. With Hevo:
- Easily migrate different data types like CSV, JSON etc.
- 150+ connectors like Zendesk(including 60+ free sources).
- Eliminate the need of manual schema mapping with the auto-mapping feature.
Experience Hevo and see why 2000+ data professionals including customers, such as Thoughtspot, Postman, and many more, have rated us 4.3/5 on G2.
Get Started with Hevo for FreeIntroduction to Pre-Built Zendesk Explore Dashboard
All Zendesk Explore editions come with Pre-Built Dashboards that present your Zendesk business data in an easy-to-understand format. Regardless of their role, all Explore users get access to pre-built dashboards. Although the dashboards are read-only, Explore Professional and Enterprise users work with editable versions. The pre-built dashboards and queries contained inside them can be used as templates to create new Inquiries and Dashboards.
The data in Explore Dashboards is updated regularly. The schedule is determined by the Explore plan you choose. There are three versions of Explore:
- Explore Lite: Provides several Pre-Built Dashboards for analyzing and understanding Zendesk products.
- Explore Professional: Pre-built Dashboards and Tools are included to assist you in creating, customizing, and sharing your reports.
- Explore Enterprise: Expands on Explore Professional’s capabilities with enterprise-level features such as Live Dashboards and Enhanced Dashboard Sharing.
6 Pre-Built Zendesk Dashboards
There are 6 Pre-Built Zendesk Dashboards:
- Support Zendesk Dashboard
- Talk Zendesk Dashboard
- Guide Zendesk Dashboard
- Chat Zendesk Dashboard
- Sell Zendesk Dashboard
- Live Zendesk Dashboard
1) Support Zendesk Dashboard
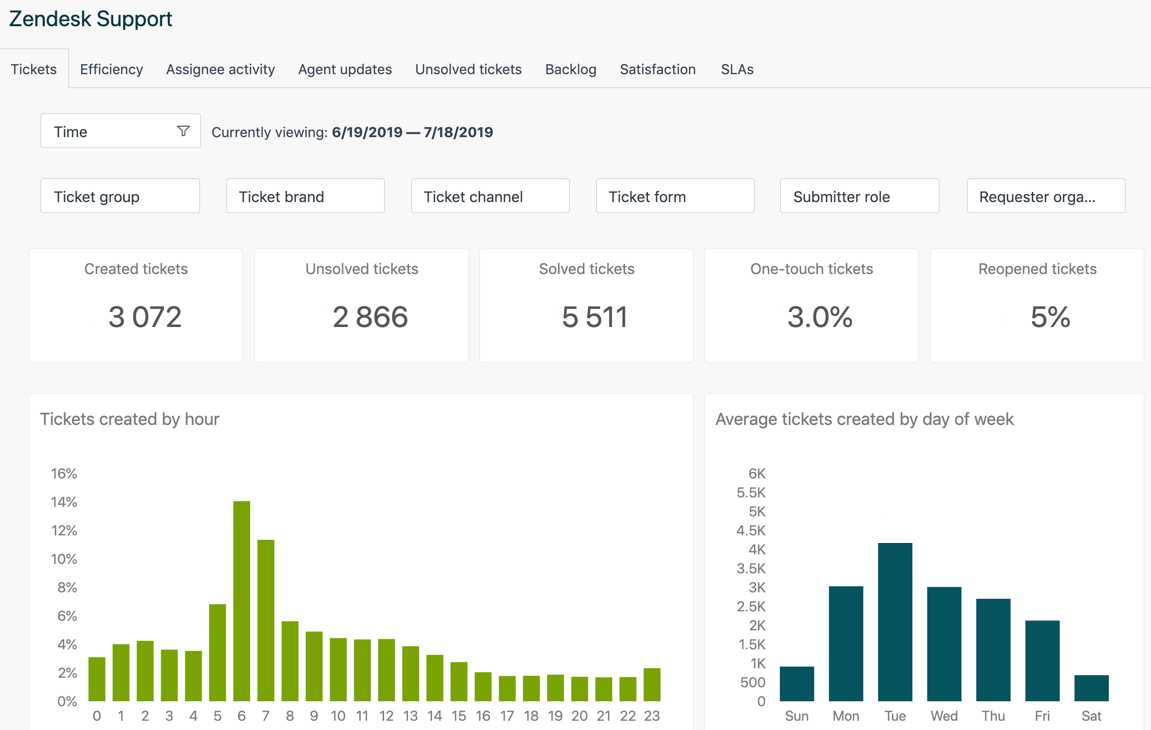
There are eight tabs in the Support Zendesk Dashboard:
- Reports on tickets created in your Zendesk account may be found under the Tickets tab. Date, group, brand, channel, form, submitter role, and requester organization can all be used to filter the reports.
- The Efficiency tab offers reports that can be used to assess your agents’ efficiency. Date, group, brand, channel, form, priority, and requester organization can all be used to filter the reports.
- When you assign tickets/tasks to agents and others, the Assignee Activity tab allows you to examine the results. Date, group, assignee, brand, channel, form, and requester organization can all be used to filter reports.
- Your agents’ comments and revisions to tickets are displayed under the Agent Updates tab. Date, agent, brand, channel, form, group, and requester organization can all be used to filter the reports.
- The Unsolved Tickets tab allows you to take a closer look at tickets that are still open and require your attention. The reports can be filtered by group, assignee, brand, channel, priority, and requester organization, among other options.
- The Backlog tab allows you to view open ticket activity over a specified time. Groups, assignees, brands, channels, priorities, and types can all be used to filter reports.
- The Satisfaction tab allows you to examine your tickets’ customer satisfaction (CSAT) scores in further detail. Date, group, brand, channel, form, priority, and kind are all options for filtering the reports.
- The SLAs tab allows you to compare your outcomes with the SLAs you set up. Date, SLA policy, SLA metric, group, brand, form, priority, and requester organization can all be used to filter reports.
2) Talk Zendesk Dashboard
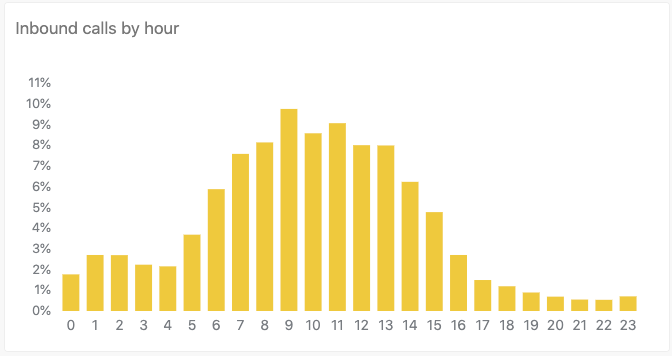
The following tabs can be seen on the Talk Zendesk Dashboard:
- The Calls tab displays information on Talk-based calls made and received by your agents. Reports can be filtered by date, group, Talk number, and the end company. user’s
- The Efficiency tab displays data on your agents’ efficiency when handling Talk calls. Date, group, Talk number, call direction, call type, and the end-organization user’s can all be used to filter reports.
- The Agent Activity tab displays extensive information about each of your agents’ calls. Date, group, agent name, Talk number, call direction, call type, and end-user organization can all be used to filter reports.
- The Quality tab displays details about calls that were impacted by poor network or audio quality. Date, group, agent name, Talk number, call direction, call type, and end-user organization can all be used to filter reports.
3) Guide Zendesk Dashboard
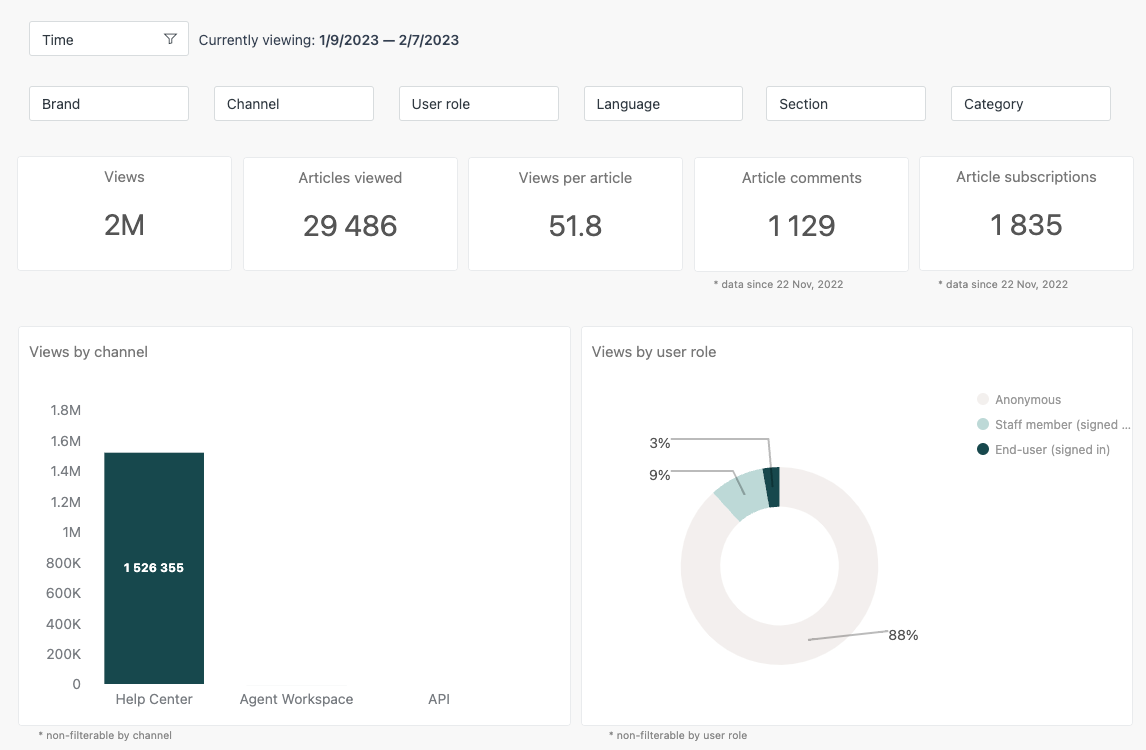
The following tabs can be seen on the Guide Zendesk Dashboard:
- Answer Bot: Shows data related to Answer Bot activities, ticket resolutions, and activity by articles.
- Knowledge Capture: Shows information regarding Knowledge Capture activities, such as articles linked to a ticket, articles written using the app, and agent interaction with the app.
- Team Publishing: Reports that help you understand your team’s activities in Guide, such as when articles are written, published, revised, and more.
- Knowledge Base: Keeps track of your help center’s activity, such as page views and article votes.
4) Chat Zendesk Dashboard
The following tabs can be seen on the Chat Zendesk Dashboard:
- The Chats tab displays information about your organization’s Chat sessions, both sent and received. Each report can be filtered by date, department, kind, completion, and who initiated the chat.
- The Efficiency tab displays data that allows you to assess your agents’ efficiency when utilizing Chat. Each report can be filtered by date, department, kind, completion, and who initiated the chat.
- Following a Chat Session, the Satisfaction tab displays information regarding customer satisfaction scores. Each report can be filtered by date, department, kind, completion, and who initiated the chat.
- The Agent Activity tab displays data on the frequency and accuracy of how your agents use Chat to engage with consumers. Each report can be filtered by date, department, agent, who initiated the chat, and assignment.
5) Sell Zendesk Dashboard
The following tabs can be seen on the Sell Zendesk Dashboard:
- Deals: Shows information about your deals, such as revenue, deals won and lost, and forecasts. The results can be filtered by time, deal owner, team, and group.
- Leads: Shows information about your leads, such as newly added, active, and unqualified leads. The results can be filtered by time, lead owner, team, and group.
Metrics
The Sell Zendesk Dashboard is available on the Beta version as of now. Sell Zendesk Dashboard supports a wide variety of Metrics. You will learn about a few Metrics of the same.
The following table shows the overview of Sell Metrics in the Sell Zendesk Dashboard.
6) Live Zendesk Dashboard
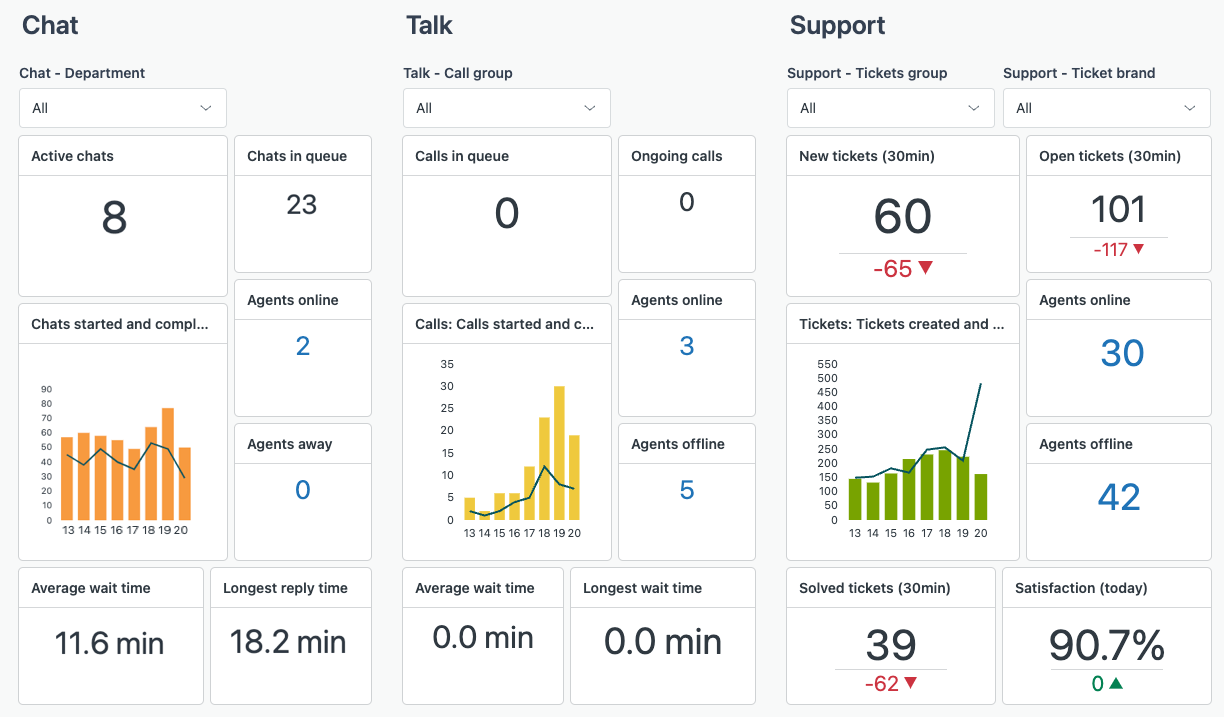
Explore comes with a Pre-Built Live Dashboard that aggregates vital information about your Zendesk products in near real-time. This Explore Dashboard can be shared, scheduled, or cloned to create your personalized version, just like any other Explore dashboard. The following reports can be seen on the Live Zendesk Dashboard:
Chat Reports
Talk Reports
Support Reports
Working with Pre-Built Zendesk Dashboard
While you cannot completely change Pre-Built Dashboards, you can configure the Dashboards’ interaction options to give users control over the data they see. This section explains where to discover some of the various interaction choices.
1) Filtering Results
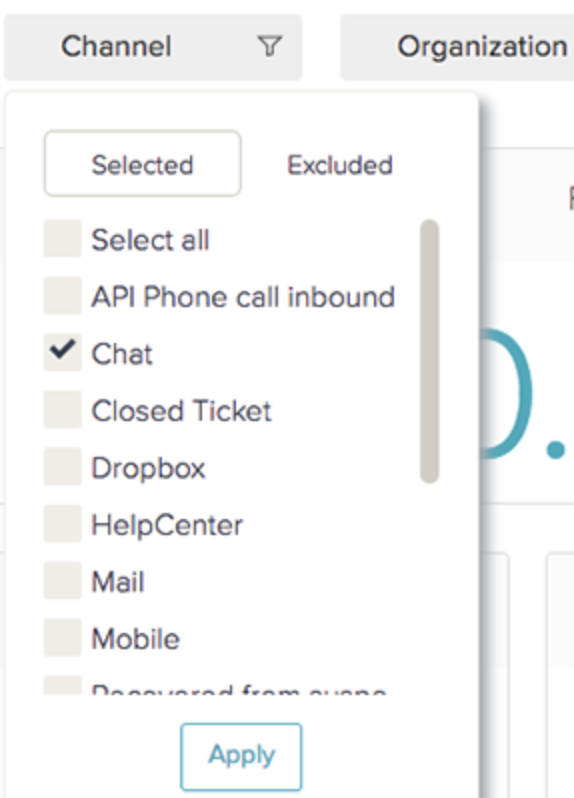
When you wish to limit the data displayed on a Dashboard to more particular numbers, you can use filters. For example, you might use the Zendesk Support Dashboard’s Tickets created by hour report to only see tickets that were opened via a Chat session. Each pre-built Dashboard includes filters at the top.
When you select a filter, a drop-down list of values appears, from which you may select whether or not specific values should be included or excluded from the query results on your Dashboard. This allows you to concentrate on a specific group, channel, or other topics.
2) Exporting Data
On occasion, you may want to store the current version of a Query or Dashboard or visualize the data in a different format. You may save a single Query or a full Dashboard tab to your computer using the export interaction. Export can be used on both Queries and Dashboards.
Hover your mouse over the query you’d like to export. In the bottom right corner of the query, click on the Export icon. You can choose between CSV, Picture, Excel, or PDF files for export. You can choose between preset and bespoke sizes. If you choose a custom size, you must provide the width and height. When you select Keep Ratio, the width or height will update proportionally when the numbers change. Now finally, click the on Export button.
3) Changing Charts
You can modify the Chart Type or Visualization used for specific queries on your pre-built Dashboard. The Visualization Selector feature is used to do this. The different visualizations a viewer can switch to are shown as icons in the top left corner of the query if the Visualization Selector is enabled. The Tickets created by channel over time query on the Zendesk Support Dashboard, for example, allows you to switch between column and line charts as shown in the figure below.
Elevate your customer support insights with Zendesk reporting. Discover how detailed reports can help you analyze and improve your service performance.
Conclusion
This article introduced you to Zendesk Dashboards and its key features. It also explained how to build/design a Zendesk Dashboard with a few easy steps. Now that you have Zendesk Dashboards set up on your website and application, it is time to start leveraging its awesome features to take your business to the next level. Extracting complex data from a diverse set of data sources such as Zendesk Dashboard can be a challenging task and this is where Hevo saves the day!
Hevo Data provides its users with a simpler platform for integrating data from 150+ sources such as Zendesk Dashboard for Analysis. It is a No-code Data Pipeline that can help you combine data from multiple sources. Zendesk is available free of cost with Hevo. You can use it to transfer data from multiple data sources into your Data Warehouse, Database, or a destination of your choice. It provides you with a consistent and reliable solution to managing data in real-time, ensuring that you always have Analysis-ready data in your desired destination.
Sign up for a 14-day free trial and experience the feature-rich Hevo suite first hand. You can also have a look at our unbeatable pricing that will help you choose the right plan for your business needs!
Frequently Asked Questions
1. What is Zendesk dashboard?
A Zendesk dashboard is a visual representation of key metrics and performance data. It displays reports and insights related to customer support, allowing teams to track trends and performance in real-time.
2. How to create dashboards in Zendesk Explore?
In Zendesk Explore, you can create dashboards by selecting “Dashboards” from the navigation menu, then choosing to create a new dashboard. Add reports or widgets to the dashboard, customize it with filters and visualizations for tailored insights.
3. What exactly does Zendesk do?
Zendesk is a customer service platform that provides tools for managing customer support tickets, live chats, help centers, and other customer interaction channels, helping businesses streamline communication and improve customer service.


