There are lots of ongoing activities and projects in an organization at any point in time. It is essential to keep a tab on currently running and upcoming activities to get a holistic idea about your progress and target achievements.
Keeping a tab always gives you an edge because it allows you to refine & optimize strategies and implement necessary changes or take action in the early stages of project development. Before any project development cycle is executed, Project Managers create a Gantt Chart that tells every person in the project team about various activities and their timelines.
This blog will expound on the importance of Power BI Gantt charts, the prerequisites, and a step-by-step guide on creating them. Additionally, explore the features of Power BI that make it a powerful tool for data analysis, including its visualization templates, interactive dashboards, and robust data sources. By the end, you’ll master Gantt charts for effective project management.
Table of Contents
Understanding Power BI

Power BI, as the name suggests, is a powerful business intelligence (BI) software made available by Microsoft as a software service offering. It enables businesses to analyze their organizational data and helps them to create powerful, interactive, and real-time Dashboards. Power BI is available as a desktop application and mobile application and can be used online after signing into your Microsoft platform. This way, all the employees in your organization can collaborate with each other irrespective of where they are. You can also create Reports for your organization using Power BI Reports Builder.
Understanding Gantt Charts
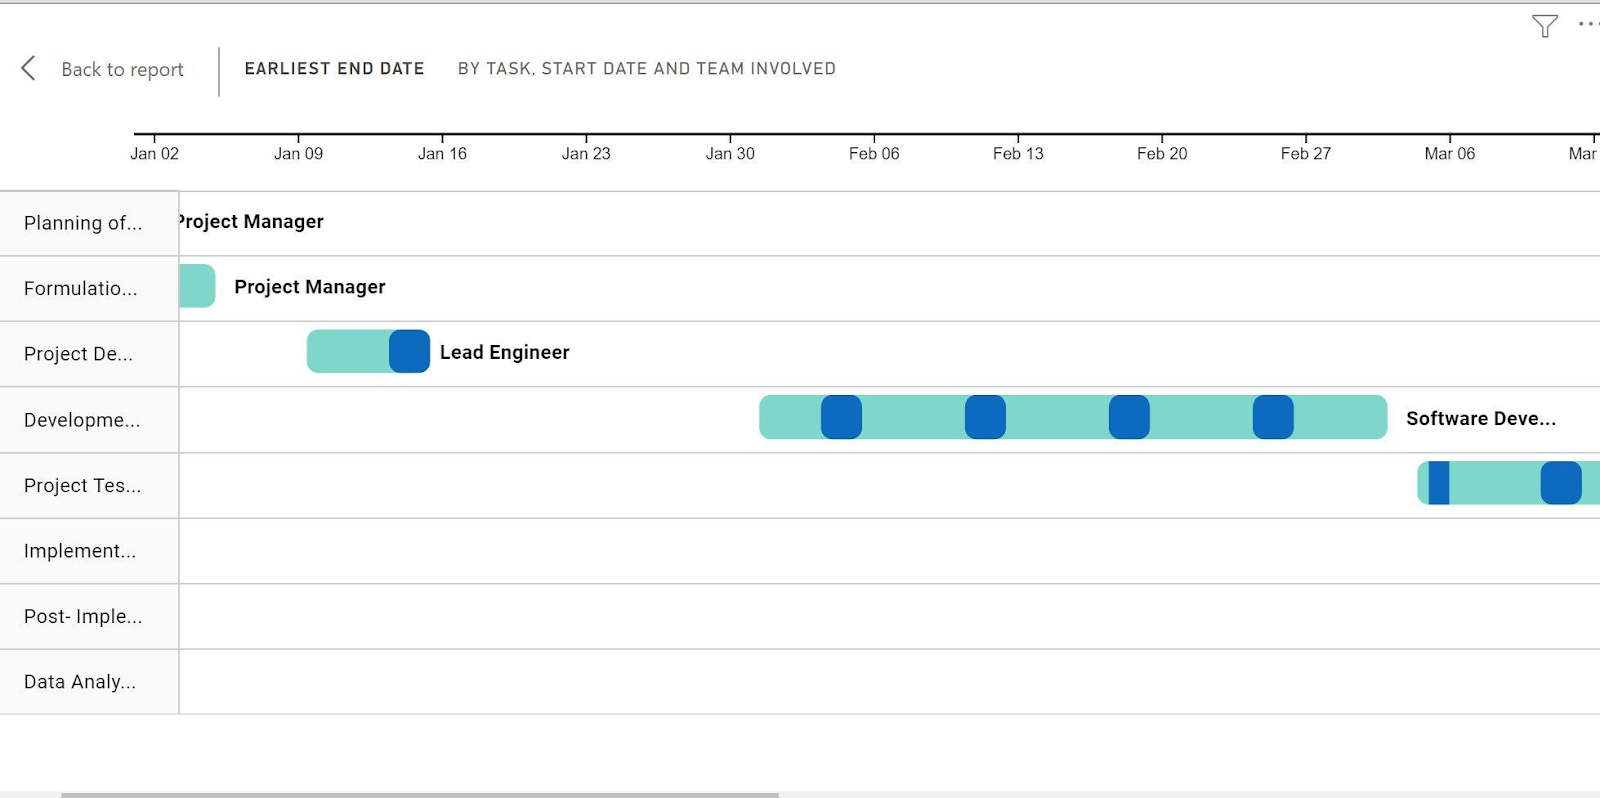
Gantt Charts are 2-dimensional charts that organizations popularly leverage to keep tabs on various activities and their timelines. For example, assume that the requirements gathering activity was supposed to be finished by 3rd March 2021, as per the Gantt Chart, but the work was actually completed by 7th March 2021. So, now the Project Manager needs to look into the issue and make changes in numerous other activities and their respective timelines and try to understand why the requirements gathering task took more time to finish. Read about setting up Gantt Charts in Asana or try an easy Gantt chart software online to understand how these charts work in the context of planning and management of projects and activities.
Hevo simplifies data analytics by automating the process of extracting, transforming, and loading (ETL) data from multiple sources into cloud-based platforms for analysis. What Hevo Offers?
- Fully Managed: Hevo Data is a fully managed service and is straightforward to set up.
- Schema Management: Hevo Data automatically maps the source schema to perform analysis without worrying about the changing schema.
- Real-Time: Hevo Data works on the batch as well as real-time data transfer so that your data is analysis-ready always.
- Live Support: With 24/5 support, Hevo provides customer-centric solutions to the business use case.
Understanding the Features of Power BI
Power BI is a popular collaboration tool that enables and empowers organizations to analyze their data using Business Intelligence for creating Reports and Dashboards. Let’s look at some of the important features of Power BI:
- Visualizations Template
- Attractive Navigation Pane
- In-built Functions for Data Analysis
- Dataset Sources
- Interactive Dashboards
1. Visualizations Template
Leveraging the Diagram and Chart templates present in the Power BI visualization pane, you can create a wide range of visualizations that have a lot of customizable features. Some of the key visualizations that you can create in Power BI are given below:
- Bar Charts
- Column Charts
- Line Plots
- Area Plots
- Pie Charts
- Scatter Plots
- Treemaps
- Funnel Analysis Charts, etc
2. Attractive Navigation Pane
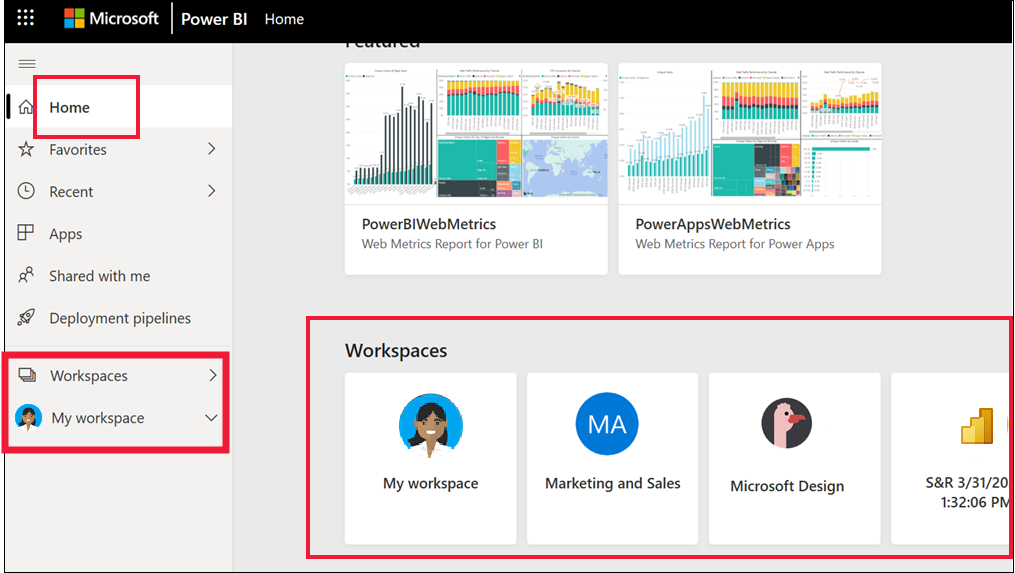
It is clear from the above image that the Navigation Pane in Power BI helps employees/users to collaborate with their peers or other employees. It is a simple interface that allows you to seamlessly navigate to Workspaces, Dashboards, or Reports. You can use Power BI, both for your personal use (My Workspace) or for collaboration. Navigation Pane also saves all Dashboards and Reports related to a particular department in your organization in the Workspaces column. It further helps you navigate to associated apps, deployed pipelines, recent work, and your starred Dashboards and Reports.
3. In-built Functions for Data Analysis
Power BI houses a large number of inbuilt functions that level up your Data Analytics. These functions are called DAX functions and are predefined functions that can be found in the Power BI functions library. New functions are added into the library from time to time by Microsoft Developers.
4. Dataset Sources
Using Power BI, you can import data from a single data source or multiple data sources. The Data Sources can be On-premise or Cloud sources. Both Structured and Unstructured data is supported by Power BI. Python, Oracle, Excel sheets, SQL Server, etc are the data sources currently supported by Power BI
5. Interactive Dashboards
Dashboards in Power BI contain various reports and visualizations that can be built using the pre-built templates. You can custom create the Dashboards dep
Understanding the Need for Power BI Gantt Charts
Using the impeccable visualization tools and functionalities provided by Power BI, you can create any number of customizable and dynamic Gantt Charts for your organization. Though Gantt Charts are widely used for Project Management, they can be used whenever there is a task and a timeline involved. Gantt Charts will help you estimate the various tasks and their timelines. It is a top-notch planning mechanism.
Prerequisites
Make sure you have the following tools and data to create a Power BI Gantt Chart:
- Power BI Desktop
- A data source containing data about project activities, start time, duration, end time, progress, and resources allocated.
Steps to Create Power BI Gantt Charts
You will learn to create Power BI Gantt Charts in 3 simple steps:
- Step 1: Downloading the Power BI Gantt Chart Template from Marketplace
- Step 2: Using the Power BI Gantt Chart Template
- Step 3: Adding Attributes to the Power BI Gantt Chart
Step 1: Downloading the Power BI Gantt Chart Template from Marketplace
- Open your Power BI desktop application. Navigate to the project embedded with the data source that you want to work on and open it. Select and click on the Marketplace icon, available under the visualization pane.
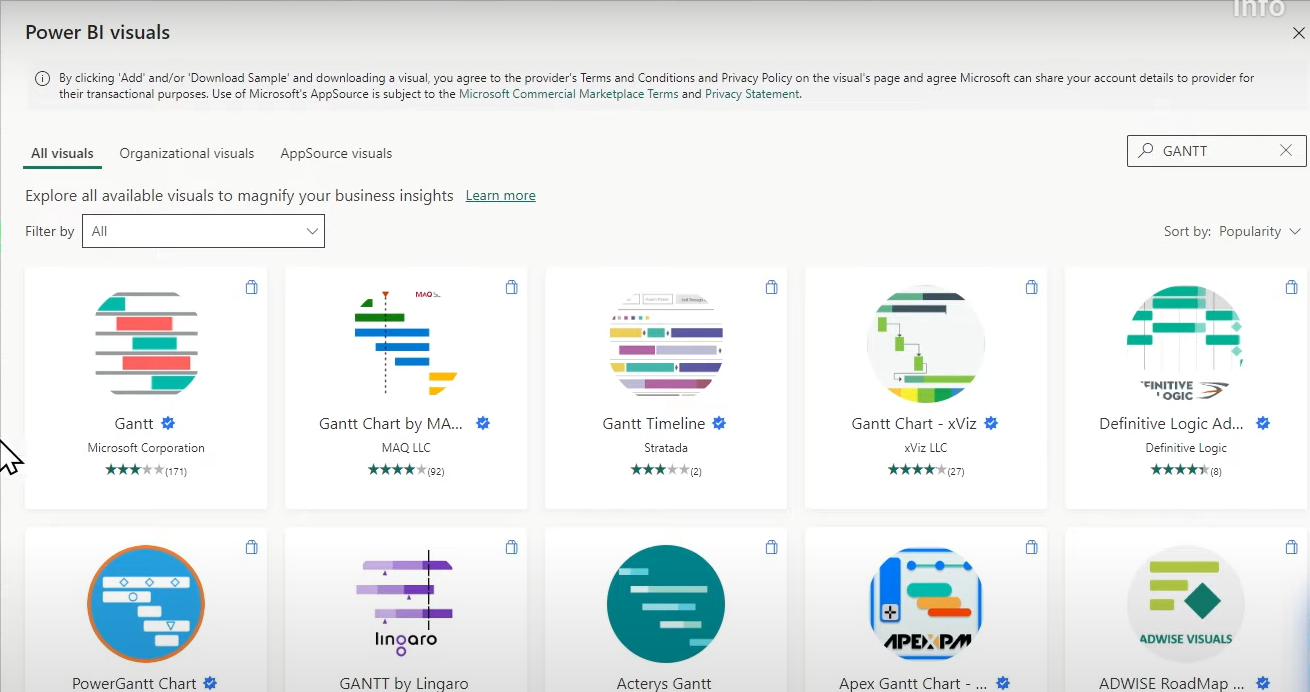
- A Marketplace window pops up. Go to the search bar and type Gantt Chart. Choose the chart that is verified by Microsoft and click on the add button. Now the Power BI Gantt Chart icon is added to the visualization pane.
Step 2: Using the Power BI Gantt Chart Template
- Click on the Power BI Gantt Chart icon and drag it onto an empty worksheet. You can resize it or move it anywhere in the worksheet. You’ll observe that the second a Gantt Chart appears on the worksheet, the visualization pane extends into a longer pane which contains the attributes of the Power BI Gannt Chart (Legend, Tasks, Parent, Start Date, End Date, Duration, etc).
- Besides the visualization pane, you can observe that a Fields pane is present. Fields pane will help you choose attributes of the Gantt Chart using your data file/source.

Step 3: Adding Attributes to the Power BI Gantt Chart
- Click on the Power BI Gantt Chart. Go to the Fields pane and drag and drop the fields present in your data source onto the Legend pane present below the visualization pane.
- For example, if there is data about various projects planned and their timelines, the y-axis of your Gantt Chart will contain the project names and the x-axis will contain deadlines. Now to implement that in Power BI, go to the Fields pane and choose the field from your data source that contains all project names.
- Drag that name field into the empty bar titled tasks in the navigation pane. Now add the start date fields, duration fields, etc. You need not use all the attributes present in the visualization pane. You can add a name to your Gantt Chart in the Legend field in the navigation pane.
Conclusion
Once you create a Power BI Gantt Chart, it is easy for you to keep track of the activities and you can try to finish them on time. You can also prepare for the upcoming activities and tasks. In this article, you have learned about Power BI, Gantt Charts, and creating Power BI Gantt Charts.
Sign up for a 14-day free trial and simplify your data integration process. Check out the pricing details to understand which plan fulfills all your business needs.
FAQs
1. How do I create a timeline chart in Power BI?
Use the “Gantt Chart” visual from Power BI’s marketplace or the “Timeline Slicer” for date ranges. Import and configure fields like task, start, and end dates, and customize visuals.
2. Which chart options are available in Power BI?
Power BI supports bar, line, pie, scatter, map, funnel, tree map, Gantt, gauge, and custom visuals via the marketplace.
3. Can you create a flow chart in Power BI?
Power BI doesn’t directly support flow charts. Use external tools like Visio and embed them using Power BI’s Visio Visual integration.
Share it with your connections.
-
 Share To LinkedIn
-
 Share To Facebook
-
 Share To X
-
 Copy Link