


 Key Takeaways
You can improve Agile team efficiency by using these Jira dashboard examples::
- Sprint Health: Visualizes overall progress and challenges within a sprint.
- Sprint Burndown: Tracks remaining work to meet sprint goals.
- Continuous Integration: Integrates build and test pipelines to avoid breakages.
- Two-Dimensional Filter Statistics: Breaks down workload priorities across team members.
- High Priority Issues: Flags blockers critical to project health.
These gadgets empower teams to visualize progress, surface risks early, and optimize collaboration for delivery success.
Jira Software is primarily used for Project Management, Bug Tracking, and Issue Tracking. A Jira dashboard consists of various useful features and functions which simplify the process of handling issues. With Jira, you can organize, plan, track, and manage all your Agile software development projects in a single place. Trusted by over 36,000 websites worldwide, Jira is used to offer better prioritization, visibility, and increased productivity for project managers and teams.
Jira differentiates itself from other dashboarding tools by allowing its users to tweak and combine numerous intuitive features, and customize their dashboards on the go. This blog talks about a small number of Jira Dashboard Examples that can help you increase efficiency in your workplace. It starts with a brief introduction to Jira, its features, and benefits before moving on to the methodology to create a dashboard in Jira. It then talks about the different components of a Jira dashboard called Gadgets.
Table of Contents
Best Jira Dashboard Examples
As mentioned before, Jira Dashboards are made up of Jira Gadgets. Jira Gadgets can display numerous reports, summaries of team progress, and other data from Jira Projects. All these together make up a dashboard. These Gadgets can be customized to show projects and provide details relevant to specific users.
Here is a list of a few Jira Dashboard Examples (gadgets) that can come in handy for your use case:
- High Priority Issues
- Sprint Health
- Sprint Burndown
- Continuous Integration
- Two-Dimensional Filter Statistics
- Progress Tracking
- Different Team Tracker
- Level Up
1. High Priority Issues

To facilitate the tracking of these issues, you can use a Jira ticket template that outlines essential information needed for prioritization. A JQL statement can be used to find any issues with the flagged field selected or if it is considered a blocker.
Flagging an issue points to an obstacle that needs to be overcome before moving forward. For instance, if an issue is marked “Priority = Blocker”, it means that it’s globally essential to the project’s health.
Despite being different reasons, both issues are of grave concern to the team. This is what your JQL statement should look like:
sprint in (openSprints(), futureSprints()) AND project in (TIS) AND (Flagged is not EMPTY OR priority = Blocker)
2. Sprint Health
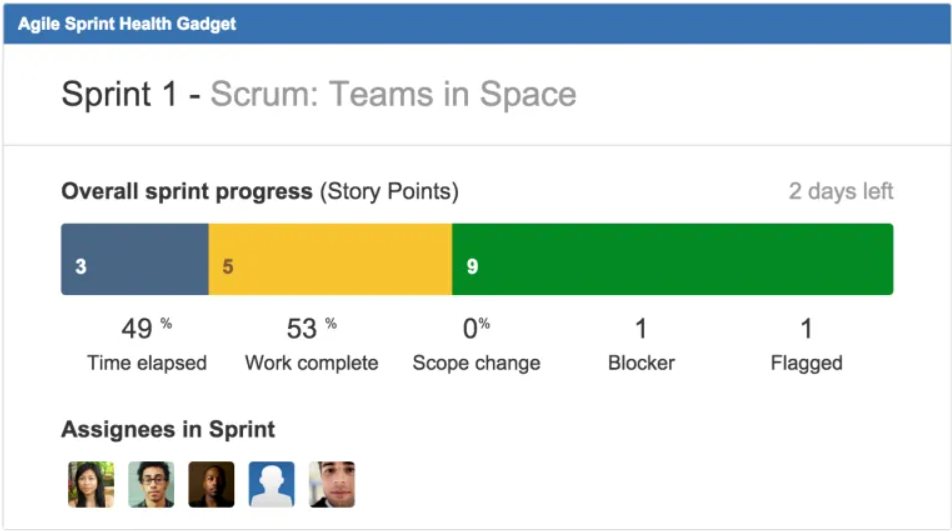
This Jira Dashboard example summarizes the important metrics in a Sprint. It’s best to place Sprint Health in the upper left so that everyone who’s working in the Sprint is aware of the progress. It can also give people an immediate sense of any challenge or trouble.
The overall Sprint Progress Bar has three colors: blue, yellow, and green to display different issues across different statuses. These colors match the blue, yellow, and green columns in the column configuration for your board, where each column has different statuses mapped to it.
The Scope Change field in the Spring Health dashboard shows the addition or the removal of an issue from a Sprint. The percentage can be calculated using the statistic configured for the board (refer to Configuration Estimation and Tracking). For instance, if you started a Sprint with 50 story points and then added an issue with 5 story points, the Spring Health Gadget would reflect a 10% scope change.
If you add or remove issues that don’t have estimates, the scope change will not be altered.
3. Sprint Burndown
The Sprint Burndown dashboard displays the amount of work remaining to achieve the goal of a Sprint. You can also use it to project the likelihood of achieving the set Sprint goal. This allows a team to monitor its progress and respond to trends accordingly.
For example, if the Burndown Chart shows that the team may not reach the Sprint goal, they can take timely action to stay on track. The Sprint’s start is shown on the left of the dashboard while the Sprint’s end is on the right.
You can configure the Sprint Burndown so that it automatically displays the current Sprint as opposed to reconfiguring it every time you start a new Sprint. The gadget uses a series of line graphs as follows:

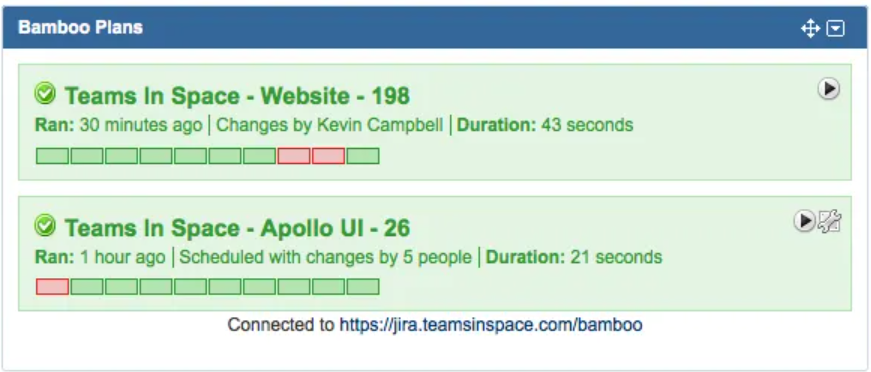
4. Continuous Integration
The most successful Agile teams pay attention to continuous integration. By consistently investing in automated testing strategies, your team can become more Agile. You can use Atlassian Bamboo to stay ahead of build breakages. It can also be used to ensure that automated tests are continuously running.
If you wish to create a Jira Continuous Integration Dashboard Gadget, you can ask your Jira admin to configure the Bamboo plugin for Jira which makes the Bamboo Plans Gadget available.
5. Two-Dimensional Filter Statistics
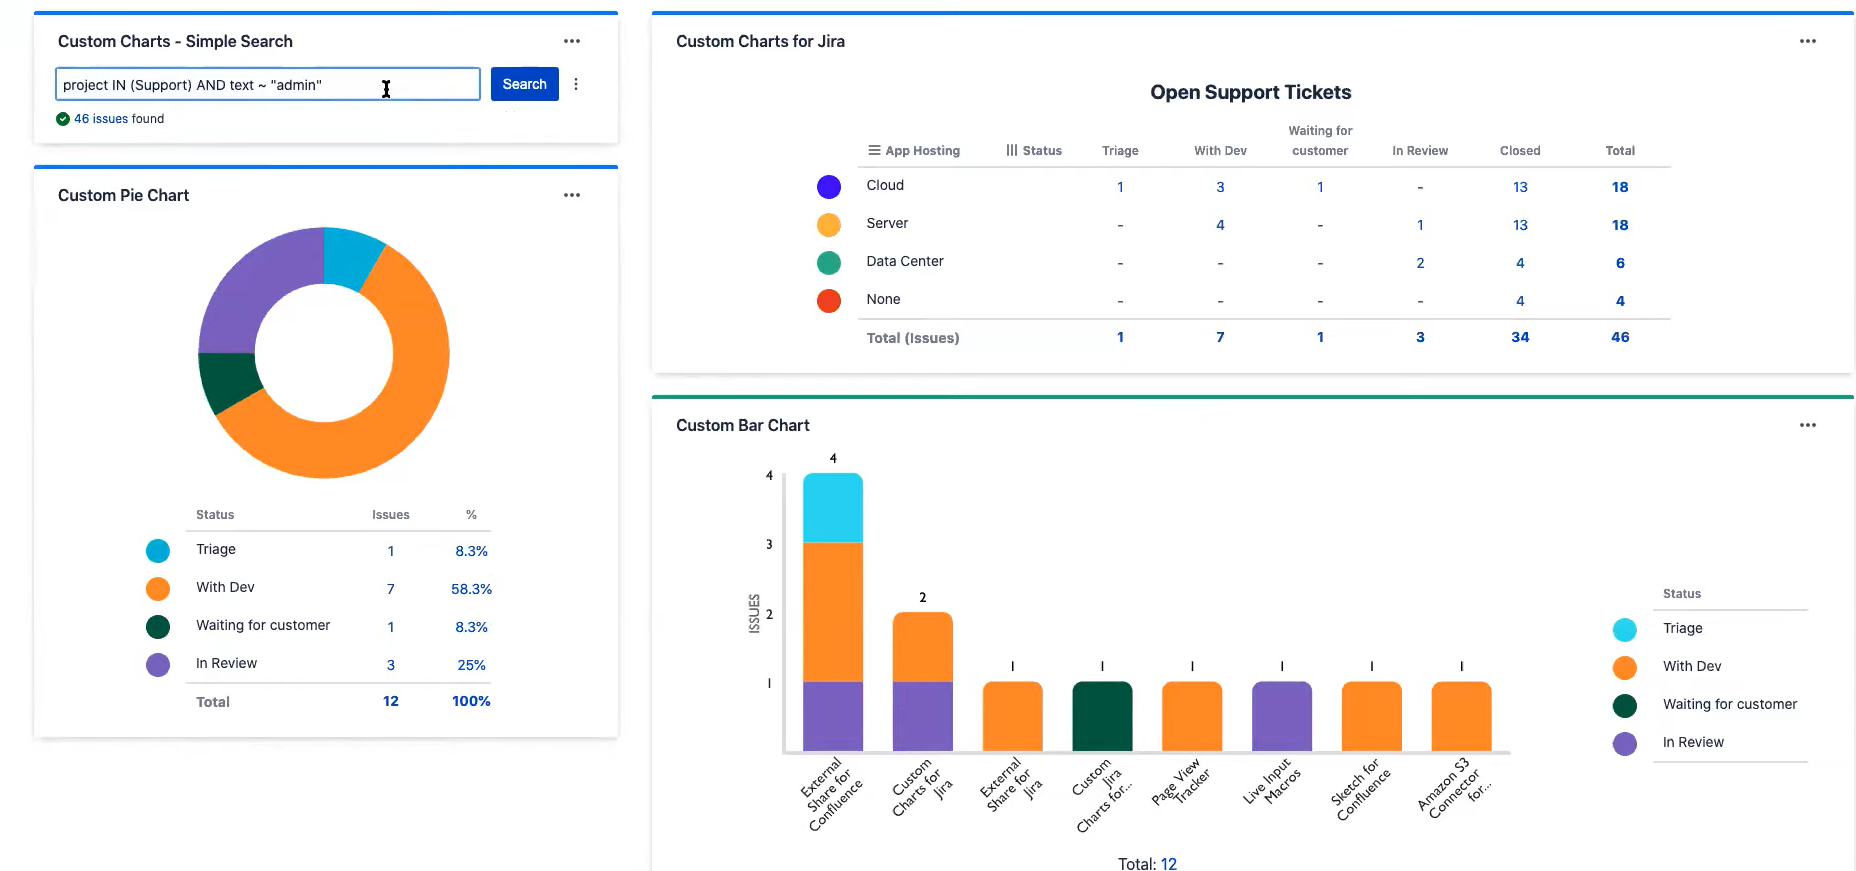
The Two-Dimensional Filter Statistics dashboard can be used to break down a set of data making it easier to find critical areas of concern. This Jira Dashboard example tells you two things: the relative priorities of work distributed throughout the team and how much each team member has on their plate.
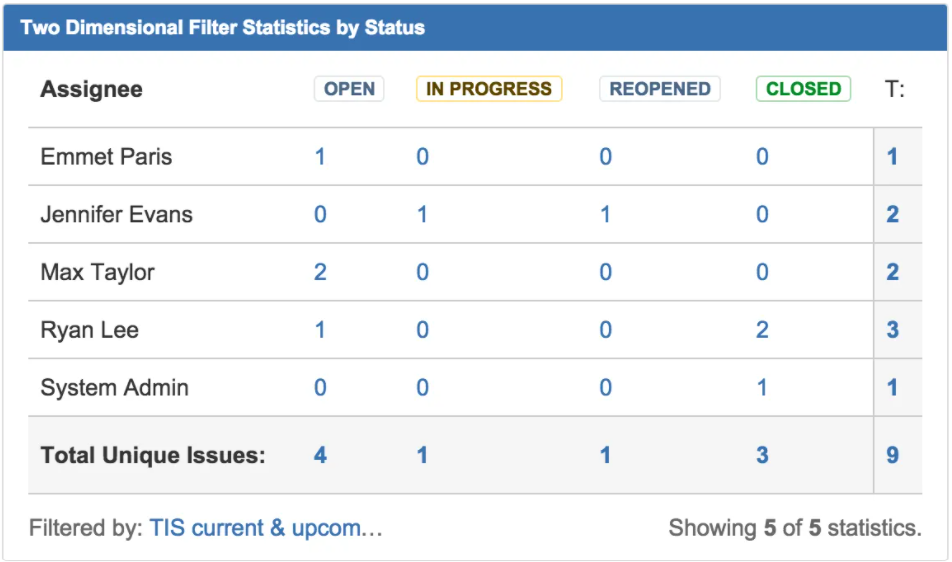
You can set up your base filter by considering your current work. Next, you can use the following JQL statement to show the work in the current sprint as well as future scheduled work:
sprint in (openSprints(), futureSprints()) AND project in (TIS)

6. Progress Tracking
The purpose of a team dashboard is to serve your team’s interest and kindle their drive. This Jira Dashboard example includes Gadgets that help measure progress for projects.
- The Activity Stream Gadget helps you keep track of what’s happening in your project.
- The Jira Road Map Gadget is known for simplifying the progress toward milestones. It lets you know which versions are due and the progress on issue resolution for each one.
- The Resolution Time Gadget shows the average time between an issue’s creation and resolution over a specified period.
- You can use the Created vs Resolved Gadget to display the frequency of issues fixed and logged. The higher the resolution count, the fewer the problems logged, the more stable the Sprint and the project.
- You can also use the Two Dimensional Filter Statistics Gadget to track different metrics namely bugs resolved by your team members.
7. Different Team Tracker
You can use multiple examples of the same gadget to track the progress for different projects and teams, as depicted with the Sprint Health Gadget above.
8. Level Up

You can extend your dashboard to incorporate data from multiple streams. You can track numerous scrum teams together by using examples of the Agile Sprint Burndown Gadget and the Sprint Health Gadget. This will help you get an overview of your teams’ progression towards a common goal.
You can use Gadgets to track the progress of a Sprint and display resolution statistics. You can try these in your dashboard:
- Select the Filter Results Gadget, and pick the custom JQL filter Sprint in:
(openSprints()) AND project in (PRAC) AND (Flagged is not EMPTY OR priority = Medium)
This can be set to cover the range of issue priorities and Sprints you want.
- Similarly, the Sprint Health Gadget can track the progress of issues designated to each team member, and the Sprint Burndown Gadget can display team performance through the Sprint. For the Sprint Burndown Gadget, you can set your estimation at the beginning of the Sprint, which is tracked by the gray line. The red Remaining Values line tracks the closed and added issues. These issues would ideally fall below the Guideline.
You can also take a look at how you can easily connect Jira to Power BI to get better visualizations by creating instant dashboards, which allows you to work with Jira data seamlessly.


Setting up Jira Dashboards
The Jira Dashboard greets you when you first log in to Jira. Jira gives you the option of creating different dashboards for various projects or multiple dashboards for one massive overview of your entire workload. Here are the steps you can follow to create a new dashboard in Jira software:
Step 1. Creating the Dashboard
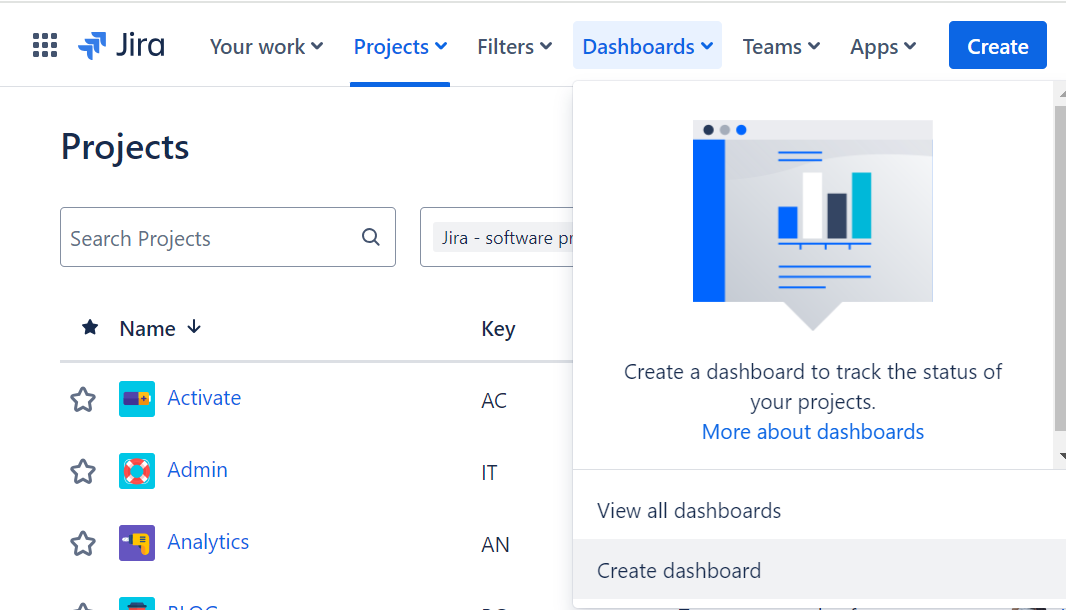
- In Jira Cloud, first, go to Dashboards > Create dashboard.
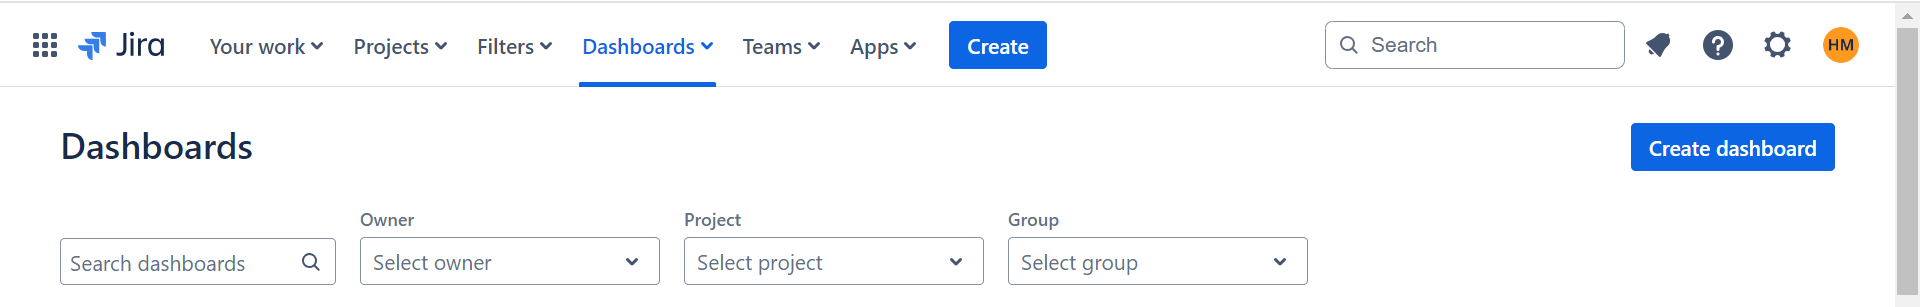
- Next, in Jira Server and Data Center, click Dashboards > View all Dashboards. Click on Create Dashboard located at the top right of the page.
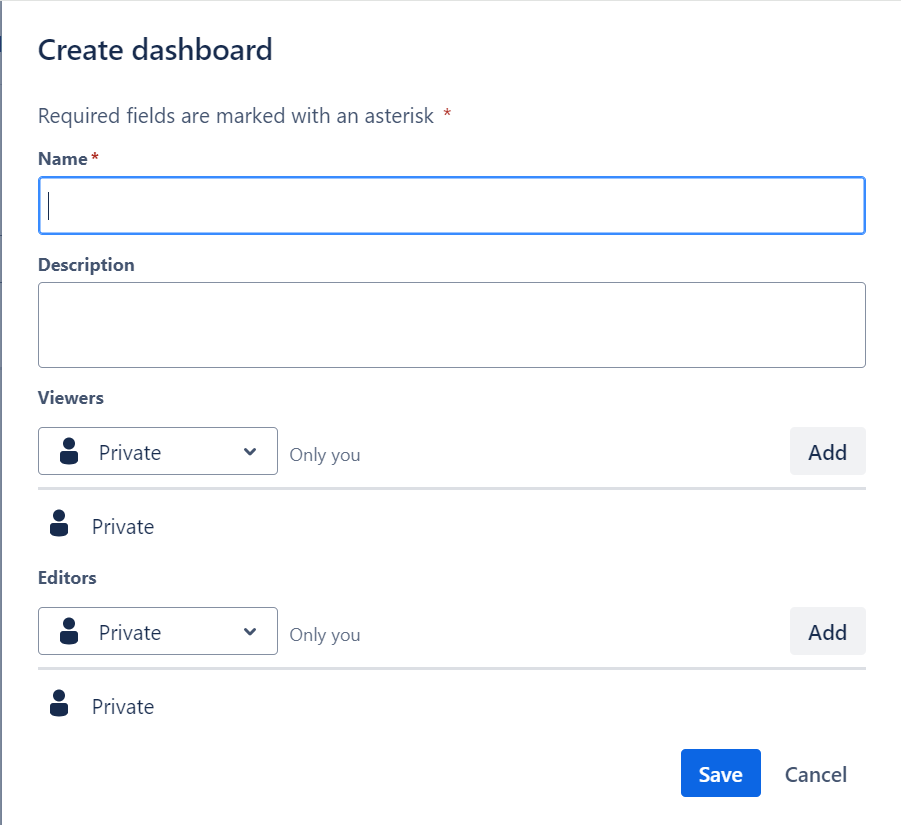
- Finally, give your dashboard a name and description so your team knows when to utilize it. Fill in the remaining fields, and click Save.
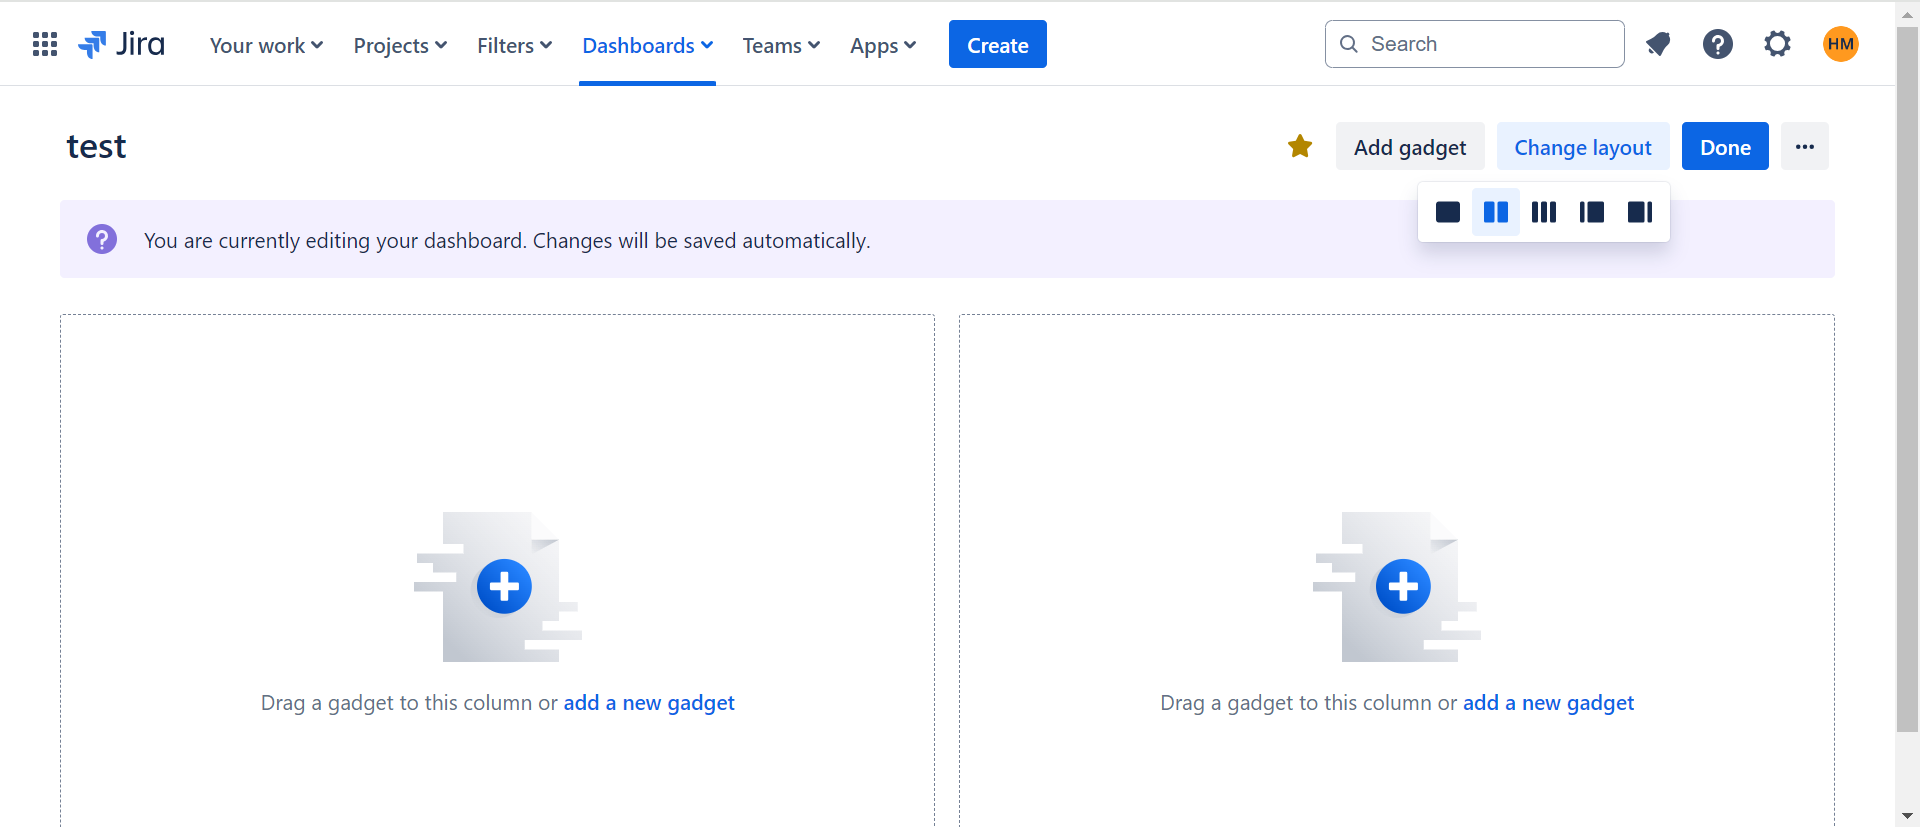
Step 2. Choosing a Jira Dashboard Layout
- Click Change Layout to choose a layout to display your gadgets. There are five options to choose from. Once you decide on a layout, the width of each gadget is fixed while the height may vary.
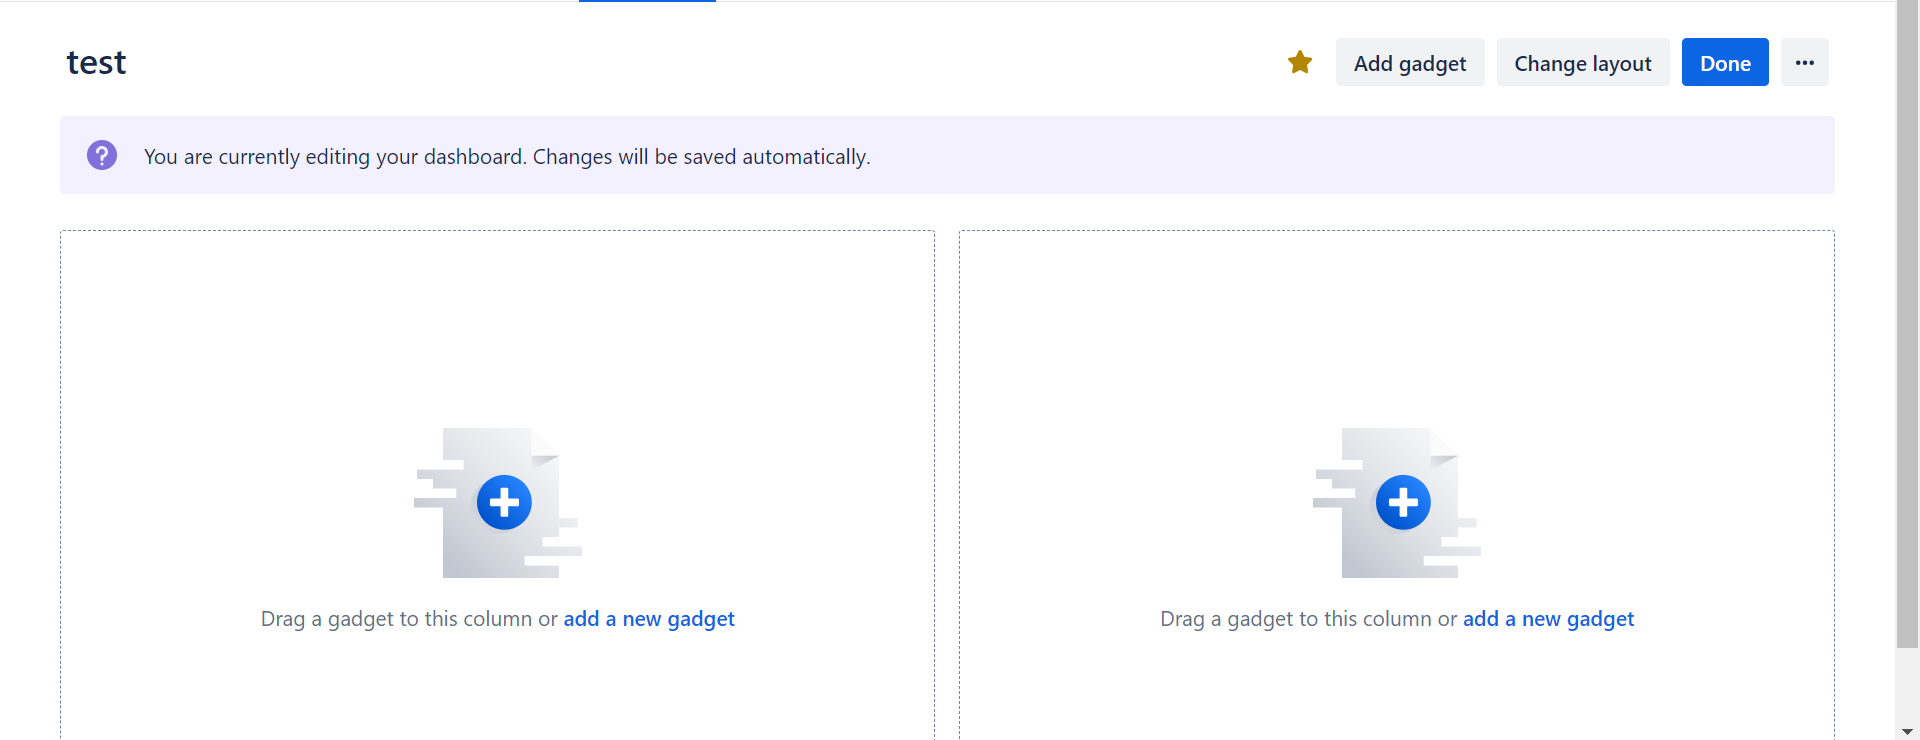
Step 3. Adding Gadgets to Jira Dashboard
- You now have an empty dashboard on your hands. Jira Dashboards are fully customizable, with each Gadget being a modular window. There are numerous Gadgets to choose from and more on the Atlassian Marketplace. Click Add Gadget and choose from the various available Gadgets to populate your dashboard. Custom dashboards aren’t limited to one dashboard page.
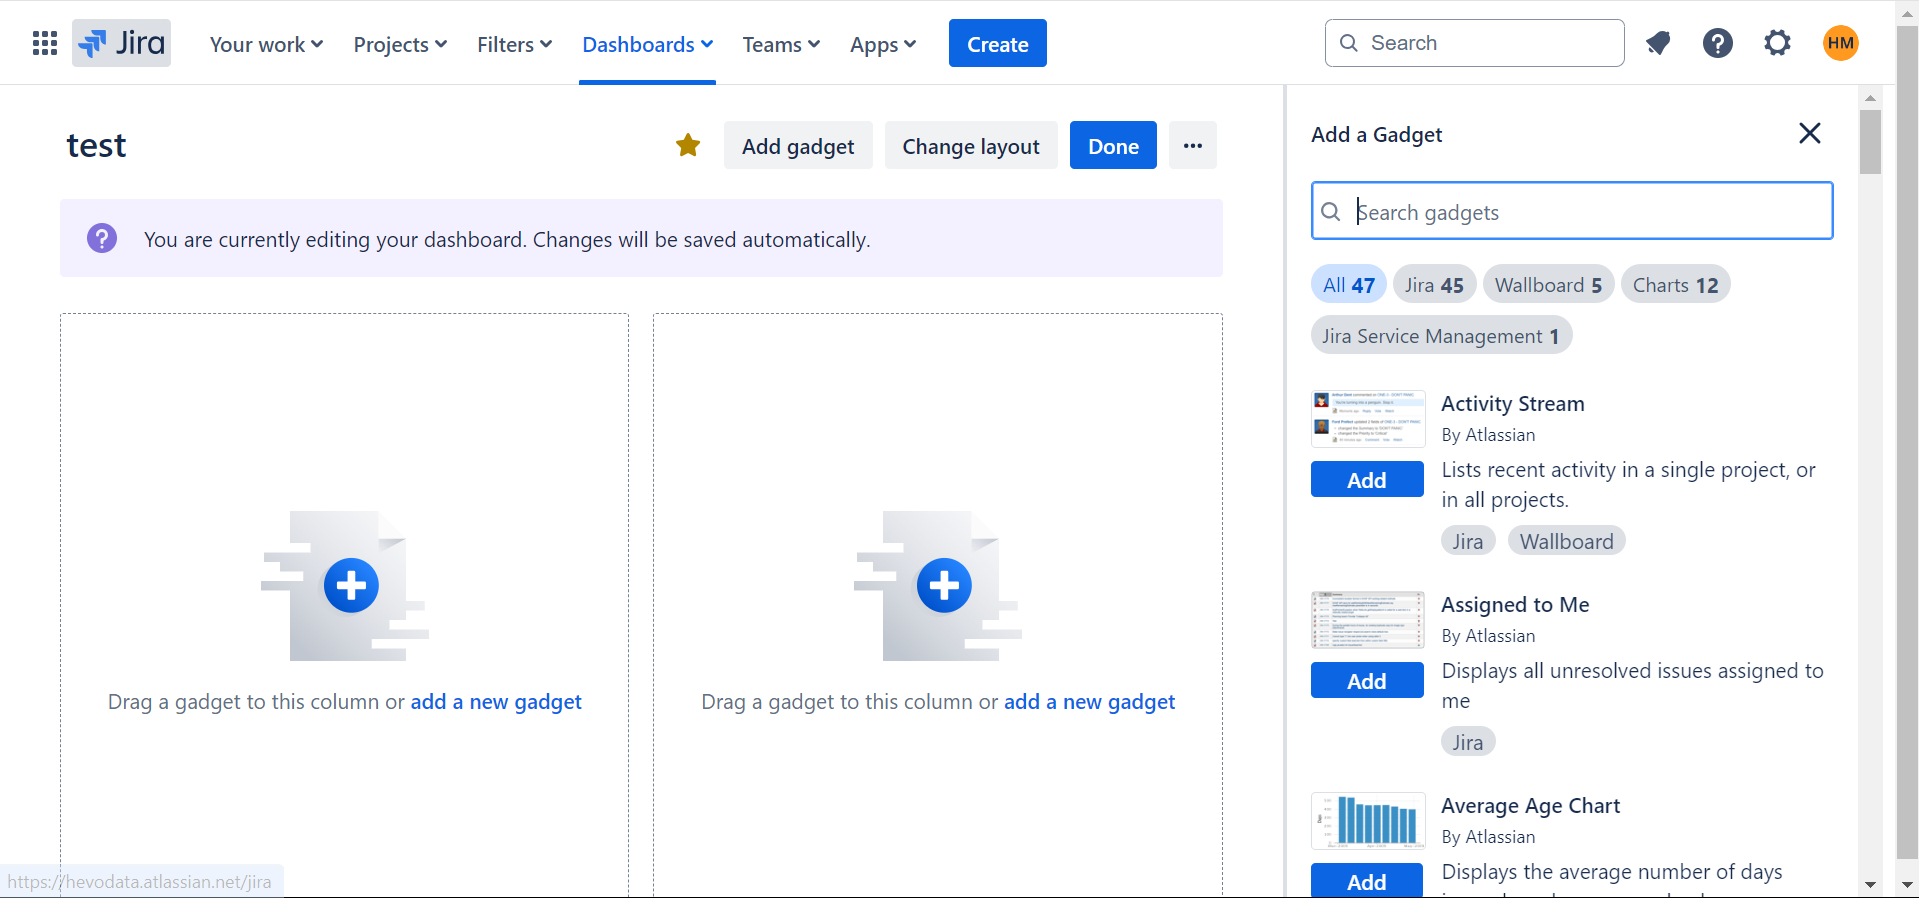
- The most commonly used Gadgets should be visible as soon as the dashboard loads in an ideal situation. You can experiment with different layout options to see which works best for which use case based on the type of reports being displayed. It is suggested to go with no more than 6 Gadgets on a single dashboard.
Introduction to Jira

Jira offers numerous products and deployment options that are purpose-built for IT, Business, Ops teams, and Software. The Jira Service Management, Jira Software, and Jira Work Management are built on top of the Jira platform. Jira Align is a platform that allows you to connect work and scale it up easily.
Jira Service Management, Jira Software, and Jira Work Management come with built-in project templates for various use cases. Since these products can seamlessly integrate for a diverse set of business use cases, teams across organizations can collaborate to improve their efficiency.
Key Features of Jira
- Agile Reporting: Jira Reports help you deliver value to customers faster with real-time insights at your fingertips. These reports offer critical insight into Kanban, Scrum, and any agile methodology in between. You can organize projects and track achievements in a single view with dashboards in Jira Software as well.
- Kanban Boards: Kanban Boards are designed to help teams increase efficiency and continuously improve cycle time. With Kanban Boards, you can show your team the most relevant information for each task, issue, or bug. Kanban Boards can be used to visually depict work at the various stages of production. Teams can use it to define and configure workflows that can be simple or complex as needed.
- Scrum Boards: Scrum framework enables Software teams to manage complex projects by inculcating a culture of collaboration. The Jira Scrum Board is a handy tool that can unite teams around a single goal and promote incremental, iterative delivery. Since Scrum Boards can be accessed by any team member at any time, everyone clearly understands their role. This helps people quickly identify any blockers and improve productivity. Scrum Boards ensure transparency by slicing the work into stages and utilizing Velocity Reports and Burndown.
- Roadmaps: Jira Roadmaps allows you to stay up-to-date in real-time as these are always in sync with the work your teams are tracking in Jira software. It also provides smart filters that ensure that you can always share the right view of your roadmap for every stakeholder.
Conclusion
This blog talks about Jira Dashboard Examples in great detail after a brief introduction to Jira along with its features and benefits. It also talks about the steps you can follow to create a dashboard in Jira. Extracting complex data from a diverse set of data sources can be a challenging task and this is where Hevo saves the day!
Sign up for a 14-day free trial and simplify your data integration process. Check out the pricing details to understand which plan fulfills all your business needs.
Frequently Asked Questions
1. What are the dashboards in Jira?
Jira dashboards are customizable views that show key project metrics, task statuses, and team progress in one place. They help you track important information across multiple projects at a glance.
2. What is the difference between a board and a dashboard in Jira?
A board in Jira shows tasks or issues in a project, often using columns (like To Do, In Progress, Done) to visualize workflow. A dashboard, on the other hand, combines data from various boards and projects to give an overview of metrics, progress, and team activity.
3. How do you create a Jira dashboard?
To create a dashboard in Jira, go to Dashboards > Manage Dashboards > Create New Dashboard. From there, you can add widgets, customize layout, and choose which project data to display.
4. How can Scrum Masters use Jira dashboards to improve team agility?
Scrum Masters can use Jira dashboards as real-time visibility hubs by including gadgets like Sprint Health, Burndown Charts, and Blocker Filters. These dashboards surface sprint progress, highlight at-risk issues, and show blockers upfront—helping the team make informed decisions during standups and retros. With quick filters and workload views, Scrum Masters can guide focused conversations and proactively resolve delivery risks.
5. What should a high-performing Agile dashboard in Jira include?
A high-performing dashboard should combine metrics and context. Include Sprint Burndown to track daily progress, Sprint Health for overall sprint status, Blocker or Flagged issue filters to highlight impediments, and Velocity gadgets to monitor long-term team throughput. For real-time standups, add a wallboard-style display and use Quick Filters to toggle views per team member or status. Always tailor the dashboard to the needs of your team—not just leadership.
6. What are some Jira tips beginners should know when setting up dashboards?
Start with built-in gadgets and master JQL to create powerful filters. Use labels and components to organize work clearly, and apply automation rules to reduce manual updates. Learn keyboard shortcuts to navigate faster, and leverage issue linking and subtasks only when it fits your sprint model. Most importantly, update dashboards regularly and keep them relevant—cluttered or outdated dashboards reduce visibility instead of enhancing it.
7. How can Jira dashboards integrate with other tools for enhanced reporting?
Jira supports integrations with BI tools like Power BI and Tableau, allowing export and visualization of Jira data in advanced analytics platforms for deeper insights.
Share it with your connections.
-
 Share To X
-
 Share To LinkedIn
-
 Share To Facebook
-
 Copy Link


