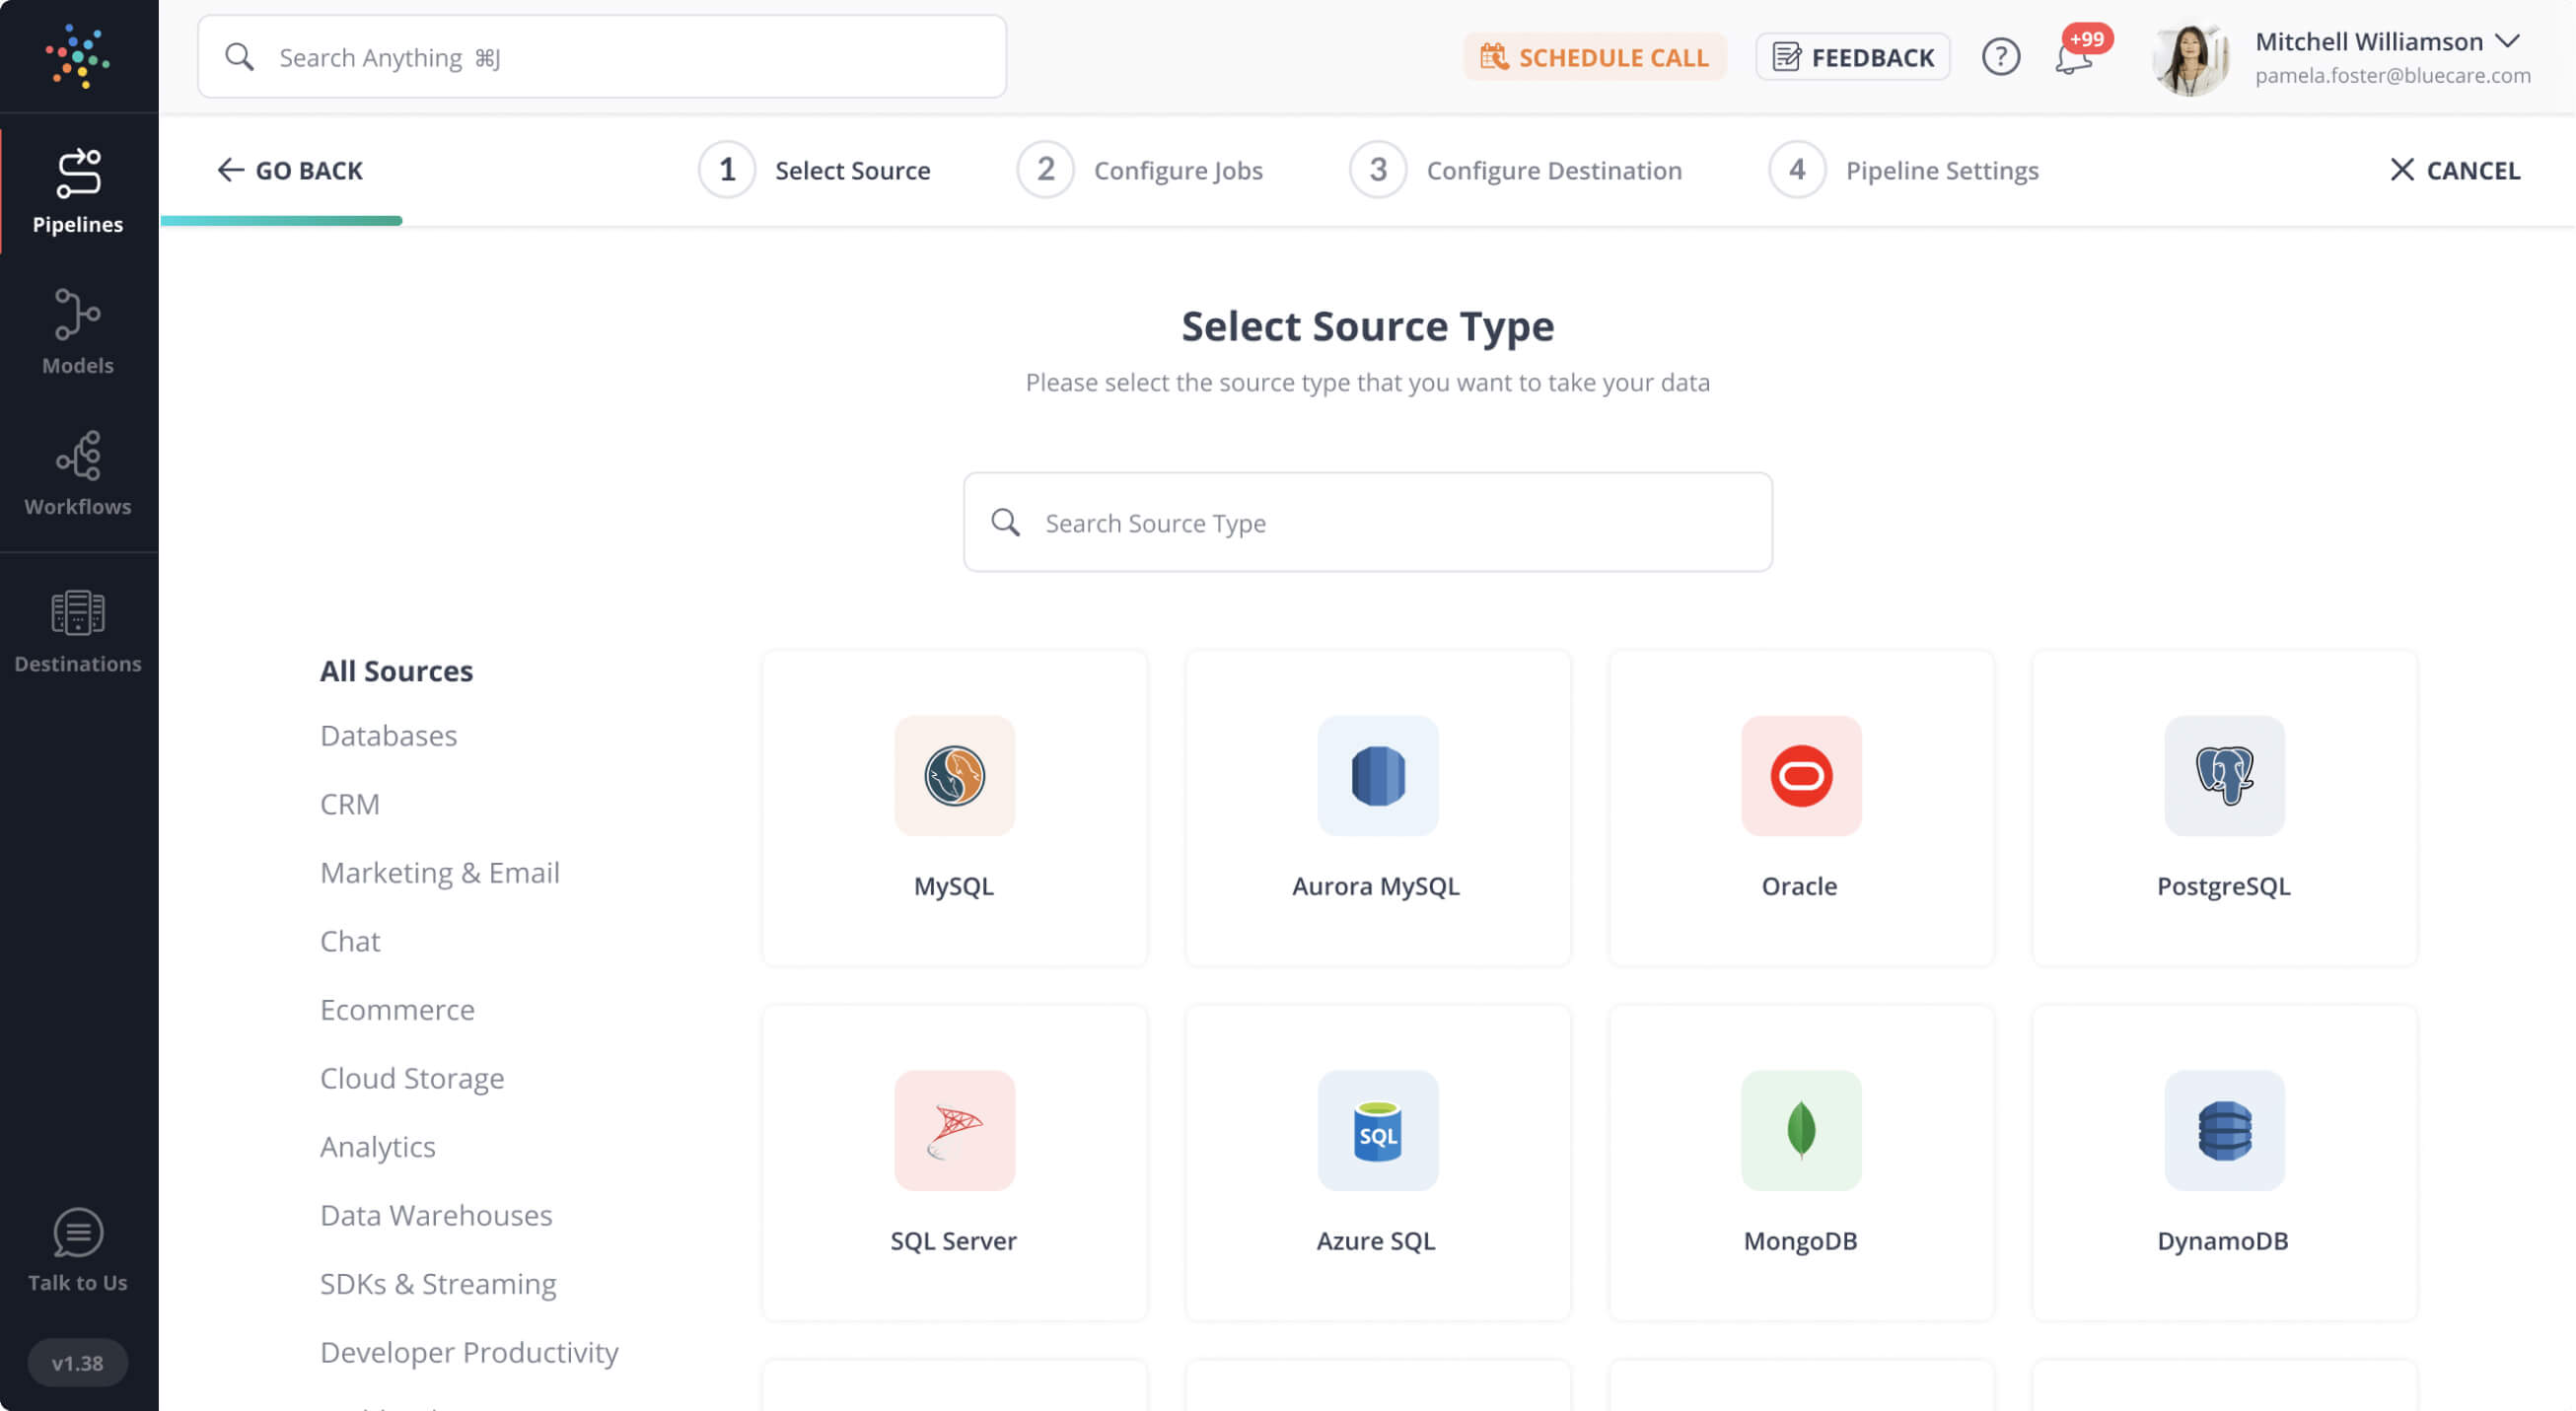
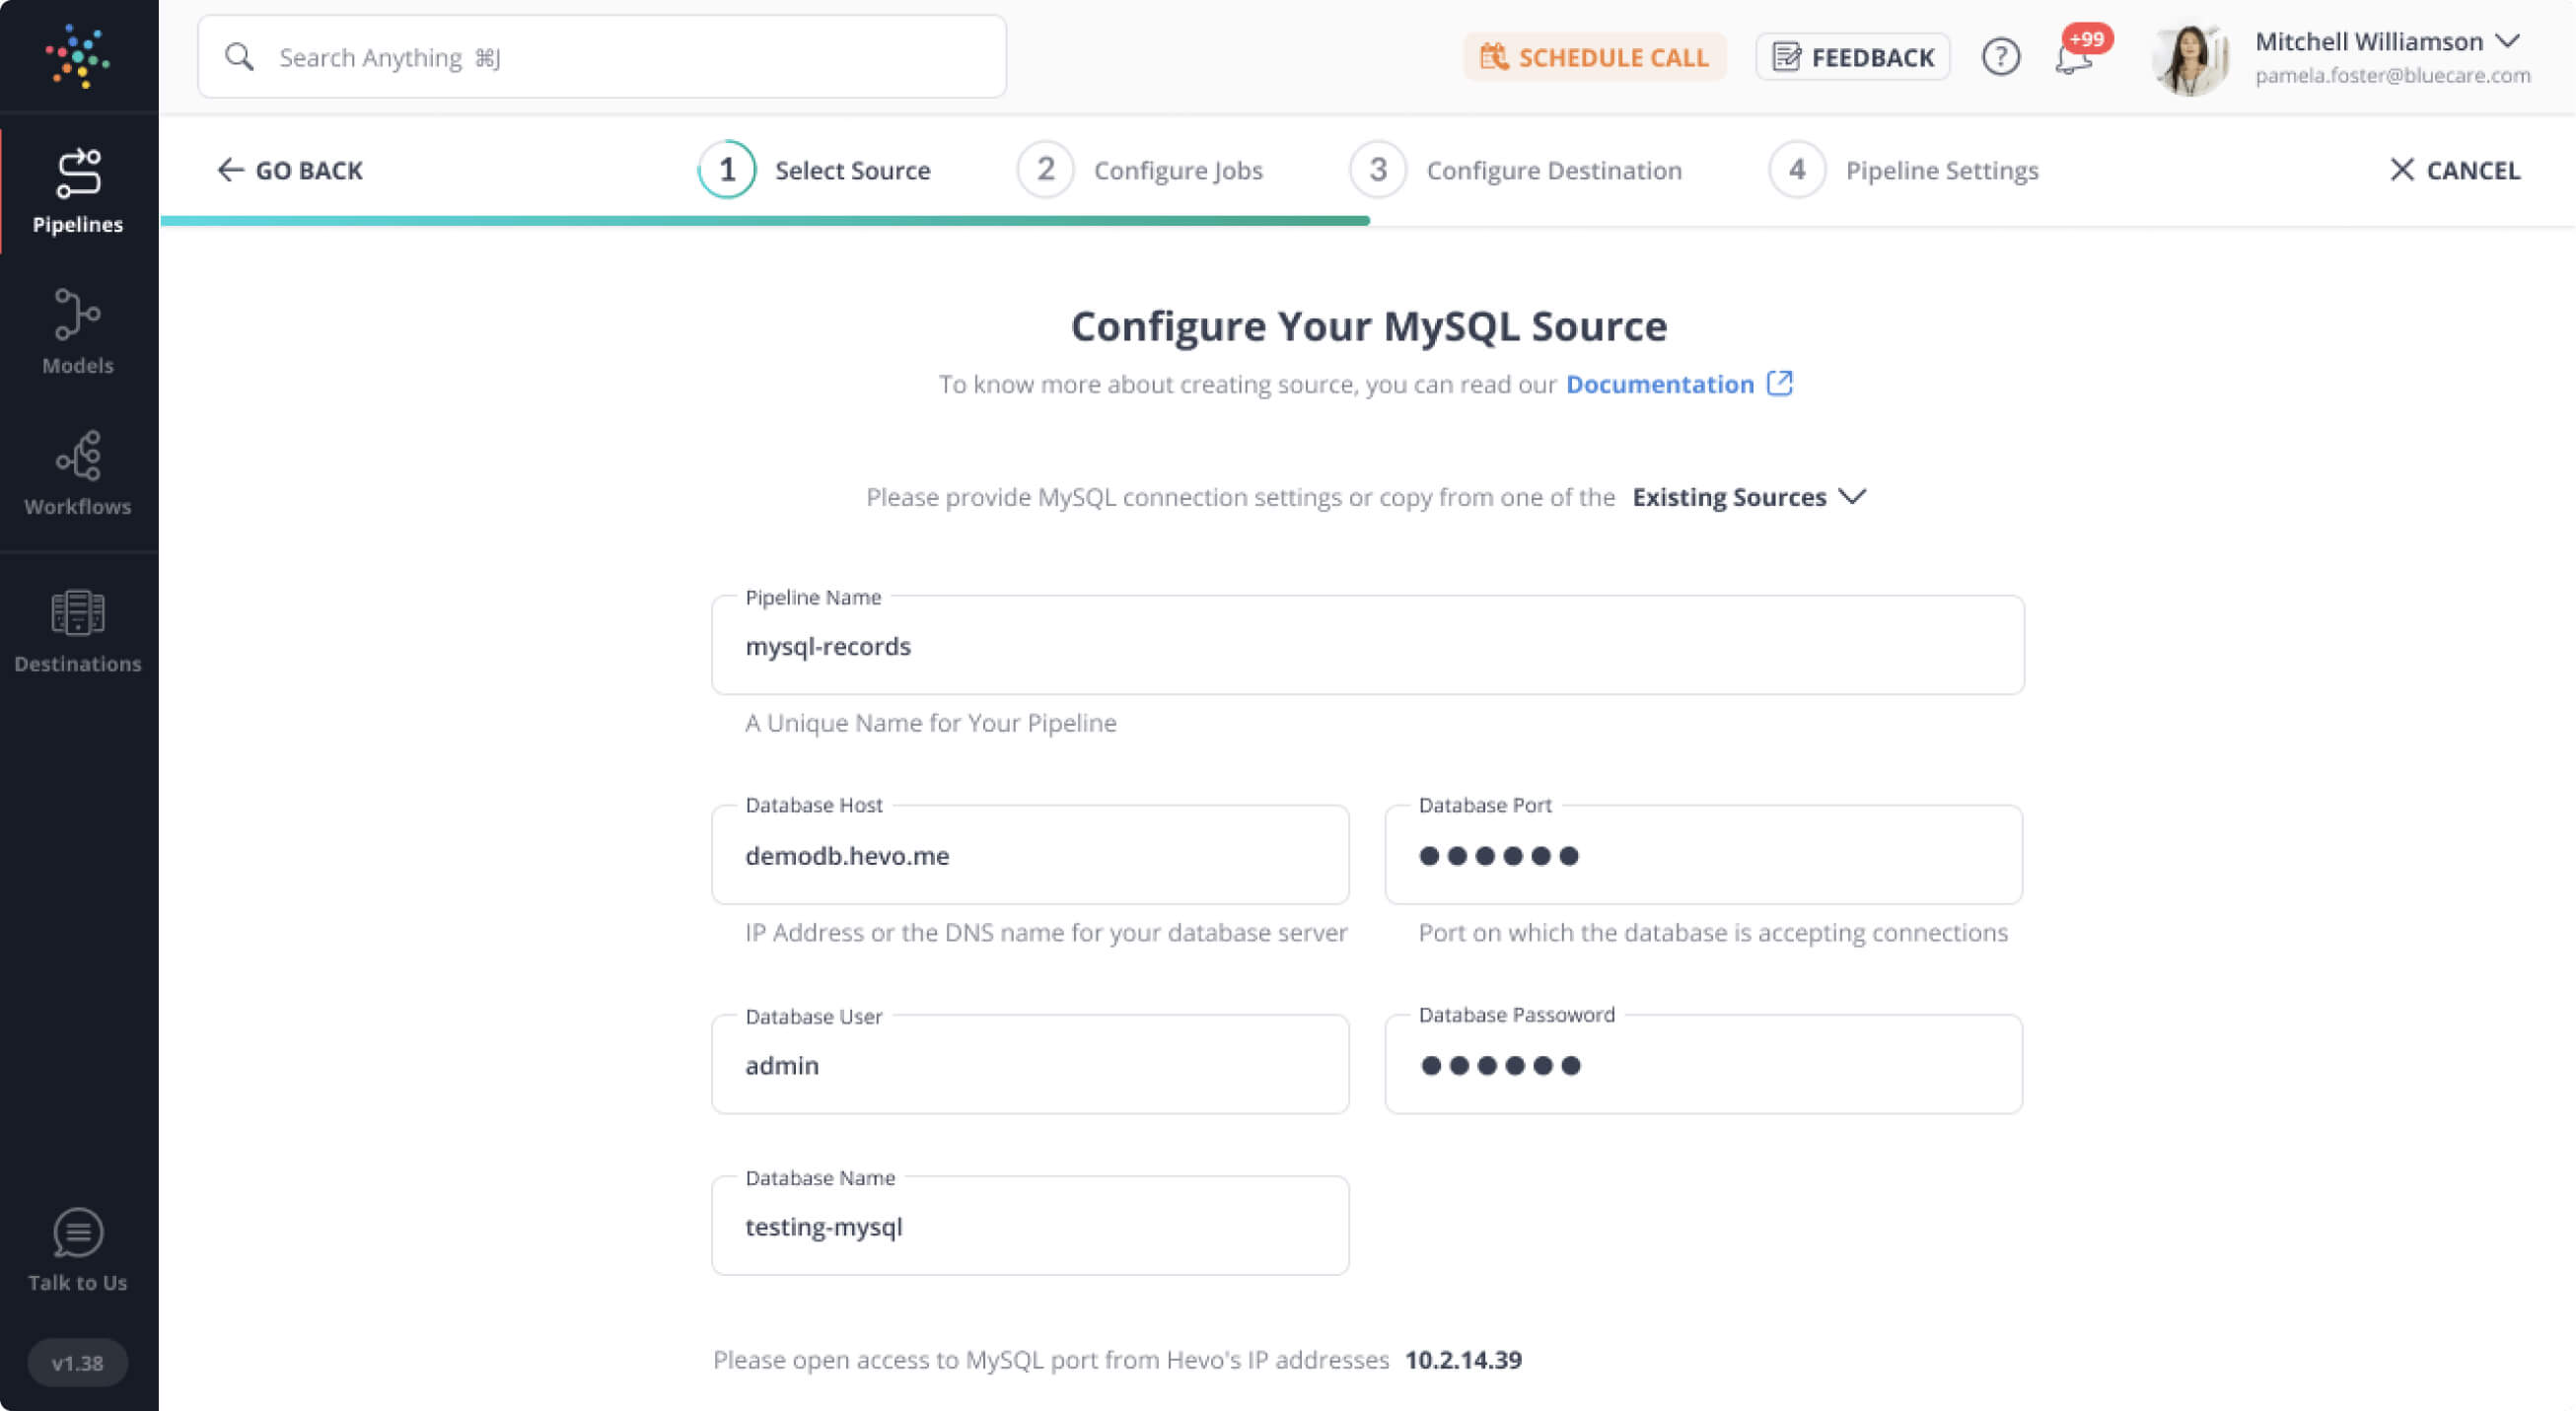
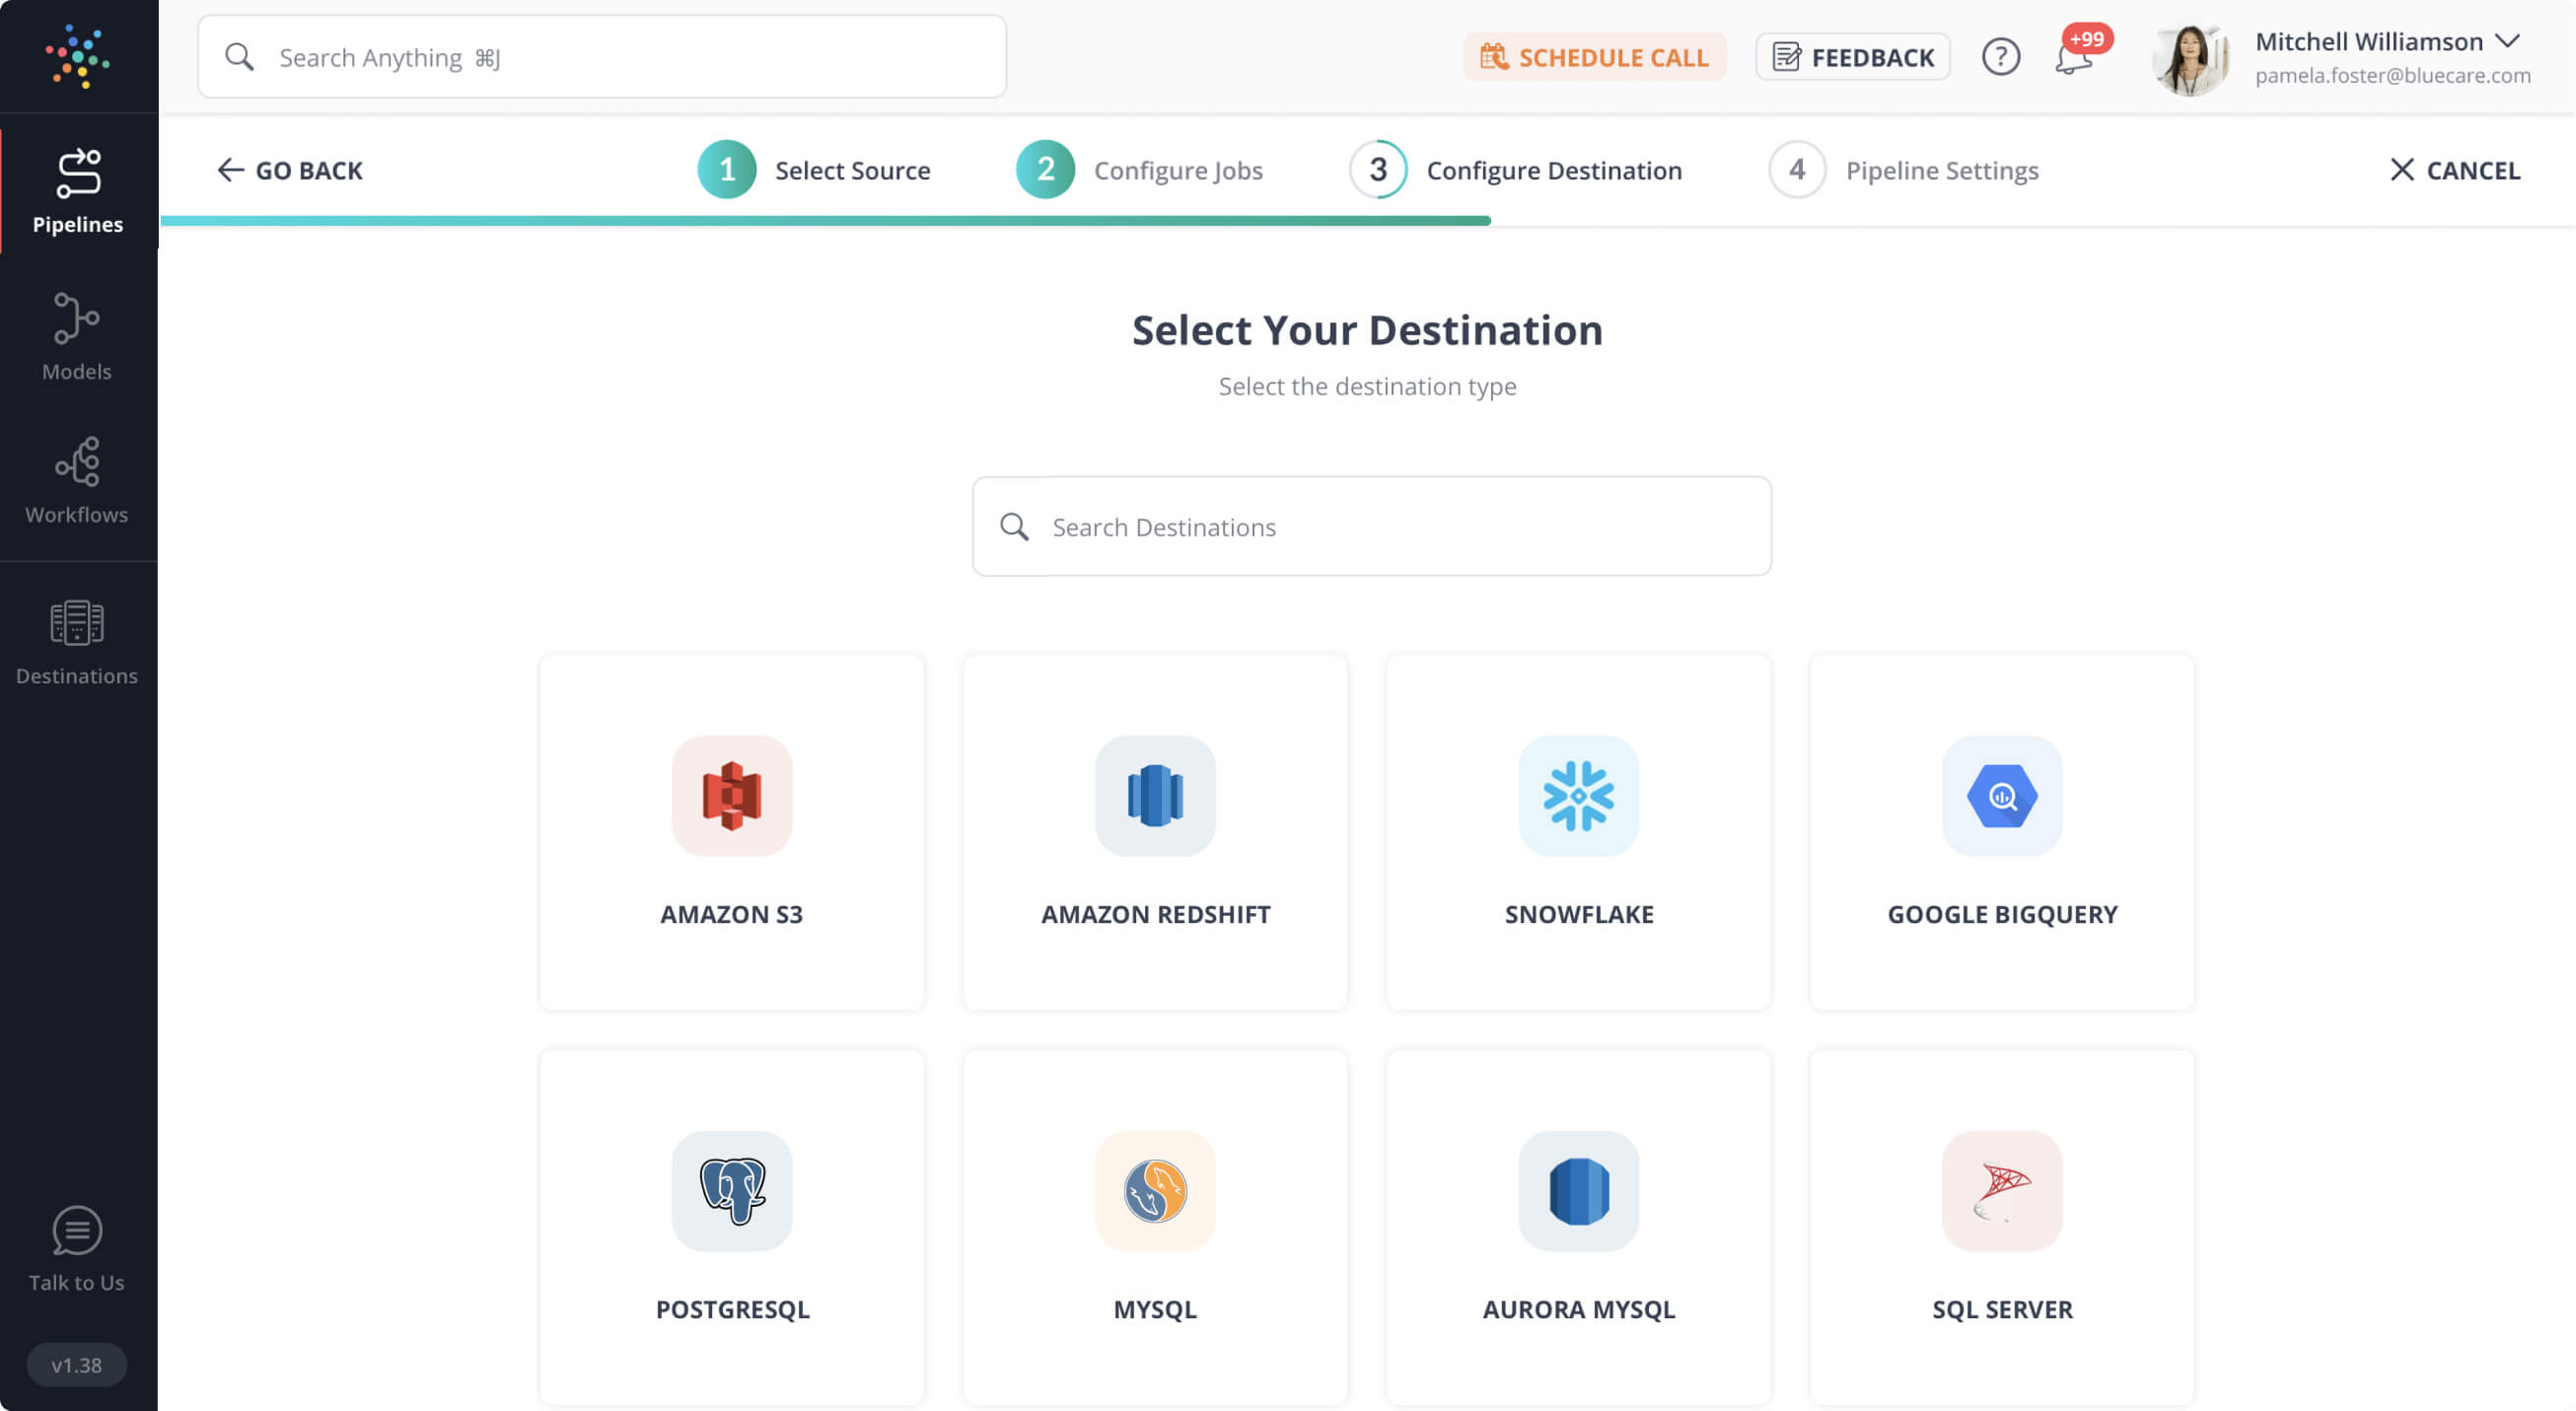
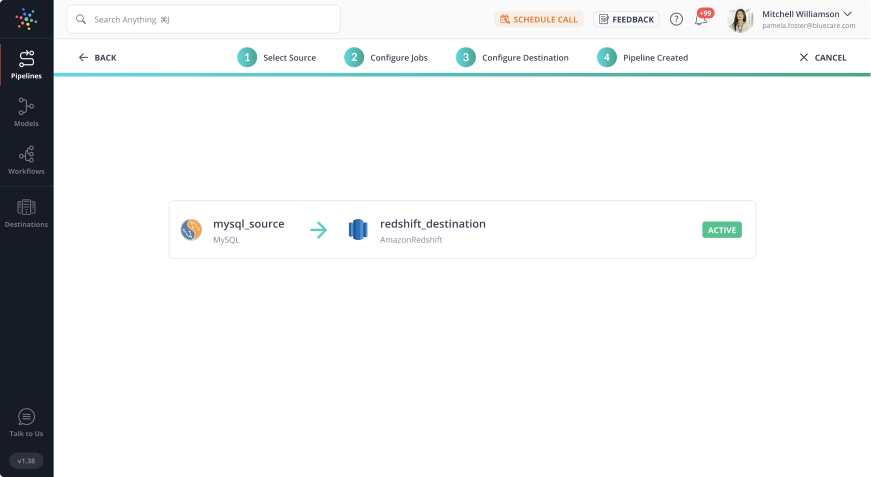
On a complete walkthrough of this article, you will gain a decent understanding of Google Analytics, Heatmaps, and Google Analytics Heatmaps. You will be able to set up Google Analytics Reports and create Custom Dashboards for them.
With Hevo, you can effortlessly export your Google Analytics data to any destination, such as BigQuery, Redshift, Snowflake, and many more. Our no-code platform ensures smooth and efficient data integration and transformation.
- Seamless Export: Transfer Google Analytics data to your target destination in 2 Steps.
- Flexible Transformations: Use drag-and-drop tools or custom Python scripts for data preparation.
- Real-Time Data Ingestion: Keep your data current with real-time synchronization.
Join over 2000 satisfied customers, including companies like Cure.Fit and Pelago, who trust Hevo for their data management needs.
Get Started with Hevo for FreeTable of Contents
Steps to Set up Google Analytics (GA4) Heatmaps
To set up Google Analytics Heatmap you have to follow the steps given below:
- Step 1: Adding Page Analytics Extension to Chrome
- Step 2: Integrating Google Analytics with Page Analytics
- Step 3: Segmenting Website Traffic
- Step 4: Setting up Configurations
Step 1: Adding Page Analytics Extension to Chrome
Google Analytics’ Page Analytics extension needs only a Google Analytics account set up. In a Google Analytics account, you add your website/URL where you wish to study different Metrics and utilize Page Analytics plug-in.
Step 2: Integrating Google Analytics with Page Analytics
Once you’ve created an account, you can install the Page Analytics extension, and your Google Analytics account will help load all the data you’ve recorded and specified, such as Segment, Geography, and a lot more.
Step 3: Segmenting Website Traffic
The next step is to segment Website Traffic data for Google Analytics Heatmap. Google Analytics has built-in Segments, but you may also construct new Segments based on the audience you’re trying to reach. These Segments are then immediately supplied into the extension’s Segment drop-down, allowing you to quickly switch between them while viewing the page.
Page Analytics allows you to create up to four Segments, each with its own Reporting Tab.
Step 4: Setting up Configurations
The final step in the Google Analytics Heatmap setup is to manage minor configurations. Heatmap The extension’s Reporting Dashboard offers data on Metrics such as Page Views, Unique Page Views, Average Time on Page, Bounce Rate, and so on. You can select the measure you wish to track from a drop-down menu for each of these.
You’ll be able to see some figures reflected against each of these elements once you’ve configured them. The best thing about this extension is how versatile it is and how much room it offers you to customize the settings right on the page. You may choose whether to display statistics for all visitors or real-time visitors, change the date range, add a date range to compare the data with, configure the clicks threshold, and more.
You have now successfully set up a Google Analytics Heatmap for checking your website/URL performance.
Steps to Build Custom Google Analytics Heatmaps Reports
To better understand Google Analytics Heatmap, you need to build Custom Reports by exporting data to Microsoft Excel from Google Analytics Here are the steps for creating a Google Analytics Heatmap in Custom Reports:
- Step 1: Creating New Custom Reports
- Step 2: Selecting Report Type, Dimensions, and Metrics
- Step 3: Exporting Data from Google Analytics
Step 1: Creating New Custom Reports
To begin customizing Google Analytics Heatmap is to navigate to the Custom Menu. In the custom menu which is situated at the left side in Google Analytics, select Customization. Now, click on Custom Reports and then add New Custom Report. Then, under New Report, type in a title for your Report, such as Heatmap.
Step 2: Selecting Report Type, Dimensions, and Metrics
The next step in customizing Google Analytics Heatmap is to provide the Metrics. In the Dimensions section, enter the Metrics you wish to track, as well as the days of the week and hours. You can also specify a specific optional data section that you wish to keep an eye on. After you’ve completed this, you’ll be able to see your Report and select a date range from the upper right side.
You can now specify the period that your Heatmap should cover. If you have a limited amount of data, choosing a high date range is recommended.
Step 3: Exporting Data from Google Analytics
The final step in customizing Google Analytics Heatmap is to import your data into Microsoft Excel and create a pivot table. Place the days of the week in columns, the hours of the day in rows, and the sessions, transactions, or anything you want to look at in the value section.
In the value area, select the color you wish to use for the Heatmap. You can now instantly see the good and bad times, which are represented by color tones.
By clicking on the table, de-selecting the previous Metric, selecting the new one, and reapplying the Heatmap, you may simply alter the Metrics.
The total rows and columns can then be used to gain a deeper understanding. You may also use the calculator to divide the two Metrics to obtain more detailed information, such as Conversation Rate.
You have now successfully set up Google Analytics Heatmap for building Custom Reports.
Introduction to Google Analytics
Google Analytics is a free Website Analytics service provided by the search engine giant. It enables website and app owners (both businesses and individuals) to track and report on a variety of user data.
Key Features of Google Analytics
The features given below are a few of the many features of Google Analytics:
- Traffic Reporting
- Conversion Tracking
- Keyword Referrals
- Third-Party Referrals
- Custom Dashboards
Introduction to Heatmaps
A Heatmap is a two-dimensional Data Visualization tool that displays the magnitude of a phenomenon as color.
Key Features of Heatmaps
- Heatmaps allow you to see how people engage with your website pages, helping you answer business-critical questions like “Why aren’t my users converting?” or “How can I get more visitors to take action?” You can use Heatmaps to see if users are:
- Reaching critical information or failing to notice it.
- The major links, buttons, opt-ins, and CTAs on a page can be found and used.
- Non-clickable components are causing you to become distracted.
- Having problems with many devices.
- As a visual tool, Heatmaps help you make informed, data-based decisions for A/B testing, updating, or (re)designing your website. And they are also useful on a wider business scale: Heatmaps let you show team members and stakeholders what’s happening and get their buy-in more easily when changes are needed.
Conclusion
This article teaches you how to set up Google Analytics Heatmaps and build Custom Dashboards for these Heatmaps. It provides in-depth knowledge about the concepts behind every step to help you understand and implement them efficiently. You can integrate many such platforms using Hevo Data, a No-code Data Pipeline, which helps you transfer data from a source of your choice such as Google Analytics for free in a fully automated and secure manner without having to write the code repeatedly. Hevo, with its strong integration with 150+ sources & BI tools, allows you to not only export & load data but also transform & enrich your data & make it analysis-ready in a jiff.
Share your experience of learning about Google Analytics Heatmaps! Let us know in the comments section below!


