


 Key Takeaways
The best ETL tool balances ease of use, reliability, and cost predictability- three factors that determine whether your data pipelines become a competitive advantage or a maintenance headache.
In this blog, we reviewed 20 leading ETL tools in 2026, covering a wide range of needs:
- No-Code & Easy-to-Use Tools: Hevo, Skyvia, Integrate.io
- Open-Source Solutions: Apache Airflow, Airbyte, Meltano, Hadoop
- Enterprise-Grade Platforms: Informatica, IBM Infosphere, Oracle Data Integrator
- Cloud-Native Services: AWS Glue, Azure Data Factory, Google Cloud Dataflow, Matillion
- Specialized Options: Fivetran, Qlik, Portable.io, SSIS, Rivery, Stitch
We evaluated 20 ETL tools, and Hevo consistently ranks highest for teams wanting simple setup, minimal ongoing work, and rock-solid data pipelines.
How do you move data from dozens of sources into your warehouse without breaking pipelines or overspending your budget? And how do you know which ETL tool will work in production, not just in a demo?
These are the questions data teams face when evaluating ETL platforms. A wrong choice means constant maintenance, unexpected costs, and delayed insights. The right one streamlines workflows, scales with your needs, and frees your team to focus on analysis instead of infrastructure.
This guide answers a core question: Which ETL tool is right for your organization in 2026? We examined 20 platforms based on how they perform in real-world environments:


Table of Contents
Top 5 ETL Tools to Consider in 2026: A Quick Overview
Here’s a quick comparison of one tool from each major ETL category:
| Tool type | Tool name | Best for | Key strength |
| No-code Cloud ETL | Hevo Data | Fully managed, no-code, and transparent data pipelines | Auto-healing pipelines, 24/7 customer support, and predictable pricing based on usage |
| Open-source ETL | Apache Airflow | Complex workflow orchestration | Highly customizable Python-based workflows |
| Enterprise ETL | Informatica PowerCenter | Large enterprises | Comprehensive data governance & integration |
| Cloud-native ETL | AWS Glue | AWS-centric organizations | Serverless architecture for the AWS ecosystem |
| Real-time ETL | Fivetran | Automated data replication | Fully automated connectors with minimal setup |
- #1
 HevoNo-code cloud ETL for effortless, maintenance-free pipeline creation.Try Hevo for Free
 - #2
 AirbyteOpen-source ETL offering flexible, customizable connectors for full control.
 - #3
 FivetranEnterprise-grade managed ETL with high reliability and seamless scalability.
- 35Tools considered
- 25Tools reviewed
- 20Best tools chosen
What is ETL or Extract, Transform, Load?

ETL is the process of extracting data from multiple sources, transforming it to meet business requirements, and loading it into a centralized destination like a data warehouse or database for analysis.
Why does this matter? The ETL process is vital for your business because it enables you to:
- Centralize data from scattered sources into a single location for easier access and management
- Improve decision-making by providing teams with clean, structured, and reliable data
- Automate workflows to eliminate manual data collection and transformation tasks
- Enhance data quality by identifying and removing errors, duplicates, and inconsistencies before analysis
Learn more: What is ETL? Guide to Extract, Transform, Load Your Data
What are ETL Tools?
ETL tools are software solutions that make the ETL process easier. They do most of the heavy lifting for extracting, transforming, and loading data, often providing ETL automation, scheduling, error monitoring, and data management. An ETL tool saves you from writing complex scripts and lets you focus on using your data, not managing it.
Different ETL tools work in diverse ways based on where their focus is. However, the underlying principle remains the same. ETL tools first extract data from various sources like SQL databases, flat files, cloud storage, or SaaS applications. Then, they transform the data by cleaning, formatting, and structuring it according to specific business rules. Finally, they load the transformed data into a database, data warehouse, or business intelligence tool, making it available for analysis and applications.
Learn more: 8 Best Open-Source ETL Tools to Consider in 2026
What are the Types of ETL Tools?
| Type | Deployment | Cost | Speed | Best For | Example |
| Open-source | Self-hosted | Free | Moderate | Budget-conscious teams | Apache NiFi, Talend OSS |
| Cloud | Cloud-based | Variable subscription | High | Scalable cloud setups | AWS Glue, Google Dataflow |
| On-premise | Local servers | High | Moderate | Legacy systems | Informatica PowerCenter |
| Real-time | Cloud / Hybrid | Variable subscription | Very High | Real-time data needs | Hevo, Apache Kafka, |
| Custom | Any (built to spec) | Very High | Varies | Complex, unique workflows | In-house built tools |
What are the key factors in considering an ETL tool?
Before choosing any ETL tool for your organization, you must know the factors you should consider while making the decision. These aspects make an ETL tool stand out among the vast list of available options.
- Scalability: The tool should handle increasing data volumes, additional sources, and higher processing frequency without performance degradation or major re-architecture.
- Ease of use: No-code or low-code tools reduce setup time, onboarding effort, and dependency on engineering resources, especially for analytics and business teams.
- Integration coverage: Native support for your existing data sources and destinations ensures faster deployment and fewer workarounds.
- Data reliability: Features like automatic retries, schema drift handling, validation, and monitoring are critical to maintaining trustworthy data pipelines.
- Processing mode: Support for real-time, near real-time, or batch processing should align with how frequently your business needs updated data.
- Pricing transparency: Predictable pricing models help control long-term costs as data usage grows, avoiding surprises tied to rows, API calls, or overages.
List of Best ETL Tools Available in 2026
After extensive research and comparative analysis, we bring you 20 of the most value-adding, efficient, and easy-to-use cloud ETL tools in 2026 for your business.
Explore each of them to make an informed decision:
1. Hevo – Best for no-code cloud ETL
G2 rating: 4.4/5(276) | Gartner rating: 4.4(3)
Overview
Hevo is a fully managed, no-code ETL/ELT platform that helps you build reliable, scalable, and transparent pipelines from 150+ sources into your warehouse or BI tool. It eliminates pipeline maintenance with auto-schema handling, built-in monitoring, and 24×7 support.
With transparent event-based pricing, Hevo avoids the unpredictability of row or MAR-based billing. Teams can set up pipelines quickly using a no-code interface, while advanced users get the flexibility of Python transformations and dbt integration.
Trusted by 2,000+ companies worldwide, Hevo scales from startups to enterprises handling billions of records. It combines simplicity, reliability, and predictable costs — making it a powerful alternative to complex, high-maintenance ETL tools.
Key features
- Unified dashboards provide 360° visibility with detailed logs, data lineage views, and batch-level anomaly detection
- Auto-healing pipelines use intelligent retries and fault-tolerant architecture to ensure continuous data flow
- Automatic schema handling adapts to API or structural changes without requiring manual intervention
- Python transformations and dbt integration enable advanced data manipulation without custom coding
- Supports both real-time processing and scheduled batch loads based on business needs
Pricing: Hevo provides the following pricing plan:
- Free Trial for 14 days
- Starter – $239 per month
- Professional – $679 per month
- Business Critical – Contact sales
Why Use It? It’s user-friendly, supports real-time & batch data pipelines, and offers a no-code interface.
Best For: Startups and mid-sized businesses, teams with limited engineering resources, and organizations seeking fast, seamless data integration.
Customer Testimonial

Read the full case study here.
Try Hevo free for 14 days – automate your data pipelines without code.
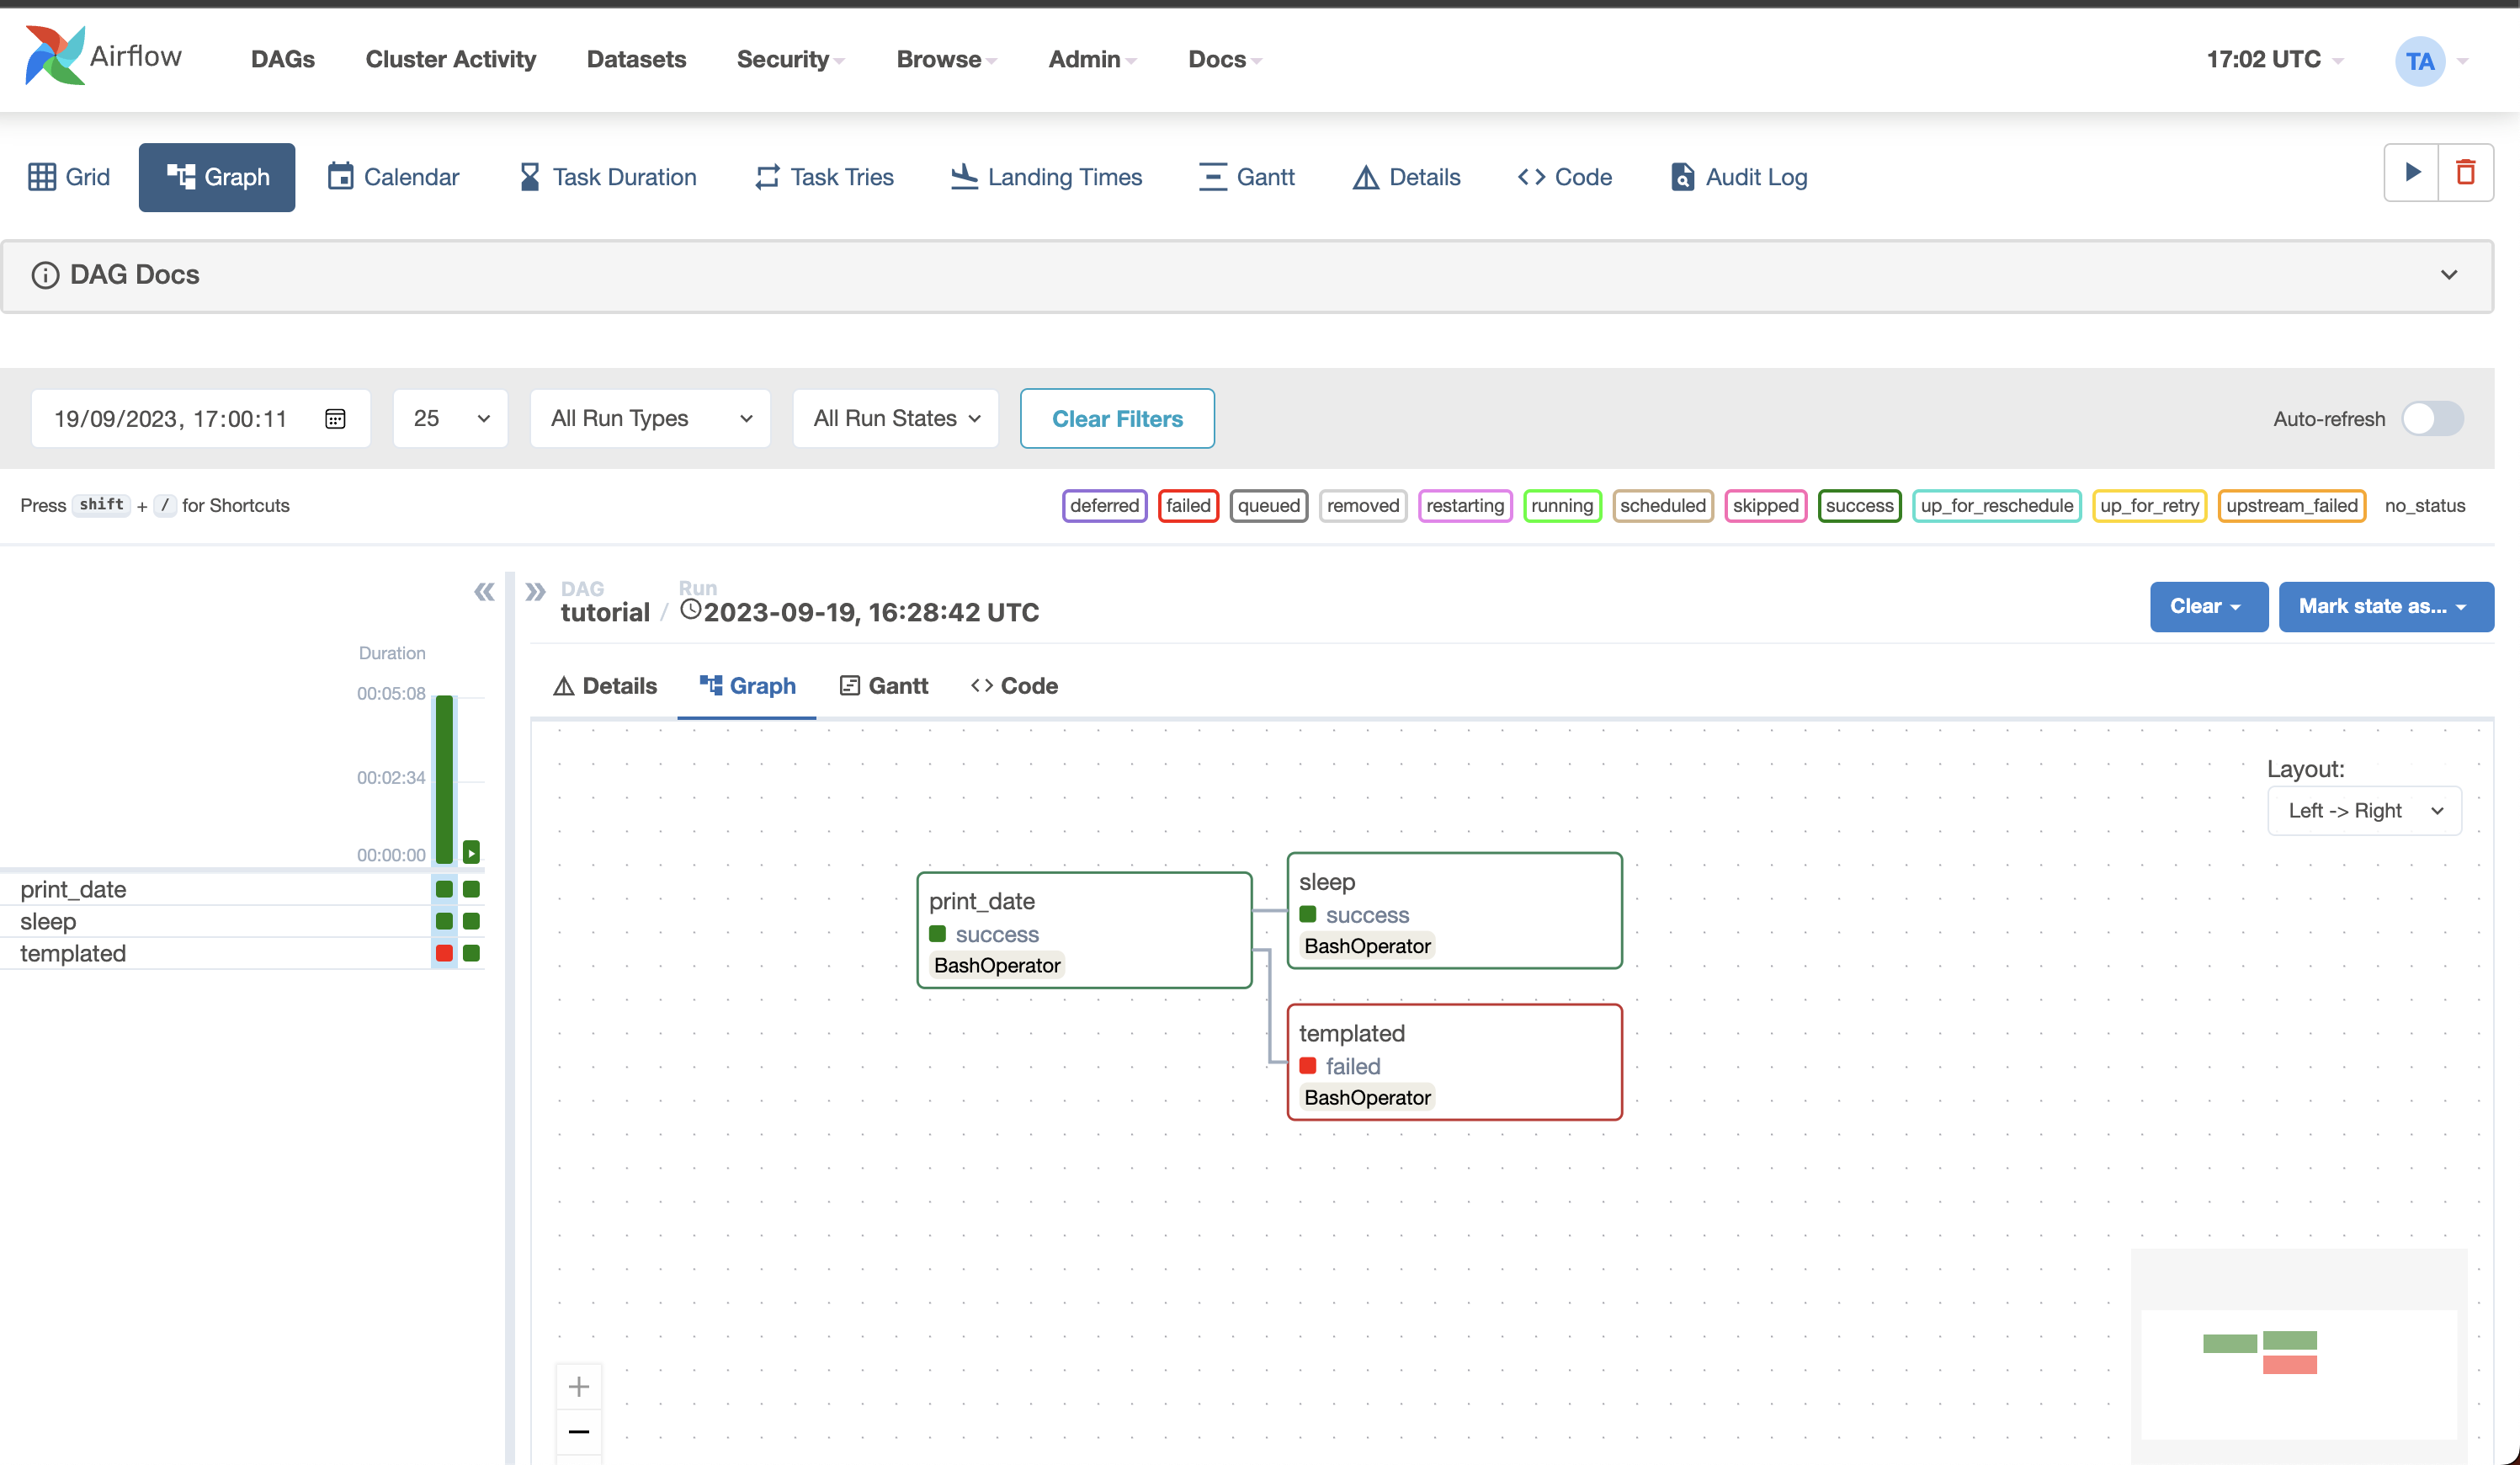
2. Apache Airflow – Best for workflow orchestration of complex ETL pipelines
G2 rating: 4.4/5 (121) | Capterra rating: 4.6(11)
Overview
Apache Airflow is an open-source platform for orchestrating and managing complex data workflows. Originally developed at Airbnb, it’s now maintained by the Apache Software Foundation and has become one of the most popular tools among data engineers.
Airflow’s strength lies in its Python-based approach, allowing you to define workflows as code (DAGs – Directed Acyclic Graphs). This makes it incredibly flexible for building custom data pipelines.
It’s best suited for developers and engineering teams who need full control over their workflows and don’t mind managing infrastructure themselves.
Key features
- XCom metadata exchange lets tasks share data payloads using push/pull methods for dynamic parameter passing between pipeline steps
- Dynamic task mapping uses .expand() and .map() methods to auto-generate parallel task instances at runtime
- Deferrable sensor operators use async triggers to offload long waits and free up worker capacity
- SLA monitoring automatically triggers callback alerts when task executions exceed defined time thresholds
- Bidirectional dependency control lets you define complex workflows with branching, parallel processing, and convergence patterns
Pricing:
- There is no free trial, and only infrastructure costs apply.
- Pricing is open-source with no licensing costs.
Why Use It? Highly customizable and open-source.
Best For: Developers seeking flexibility and engineering teams working with large, complex workflows that require scalability and customizability.
3. Airbyte – Best open-source ETL tool

G2 Rating: 4.5/5(75) | Gartner Rating: 4.6(66)
Overview
Airbyte is a leading open-source data integration platform featuring a library of 550+ pre-built connectors. What sets Airbyte apart is its connector development kit (CDK), which allows you to build custom connectors in under 30 minutes.
The platform offers both open-source and managed cloud options, giving teams flexibility based on their technical capabilities and infrastructure preferences.
Airbyte is perfect for cost-conscious teams and companies with specific integration needs that aren’t covered by traditional ETL vendors.
Key features
- Debezium-powered log-based CDC captures database changes in near real-time by reading PostgreSQL, MySQL, and SQL Server transaction logs
- State checkpointing at 30-minute intervals enables syncs to resume from the last confirmed commit point after failures
- Cursor-based incremental replication tracks timestamps or custom fields to extract only new or modified rows since the last sync
- Auto schema detection continuously monitors source structures and auto-applies non-breaking changes while flagging breaking ones for review
- Native dbt Cloud orchestration triggers transformation jobs automatically after data loads complete
Pricing
- Pricing includes Standard (volume-based), Plus (capacity-based), and Pro plans.
- It offers a 14-day free trial.
Why Use It? Free and open-source, with robust integration options.
Best For: Cost-conscious teams, companies with specific integration needs, and engineering teams that prefer open-source solutions.
4. Meltano – Best for open-source ELT with analytics integration
G2 Rating: 4.9 (7)
Overview
Meltano is an open-source platform for managing the entire data pipeline, including extraction, transformation, loading, and analytics. Built on top of Singer taps and targets, it provides a unified command-line interface for data operations.
What makes Meltano unique is its focus on DataOps practices, offering features like environment management, plugin versioning, and orchestration out of the box. It’s pip-installable and ships with a prepackaged Docker container.
Meltano is ideal for data teams that want a modular, extensible solution and are comfortable working with CLI tools and managing their own infrastructure.
Key features
- Partitioned state tracking stores checkpoint values for each stream independently in JSON state files, supporting multi-tenant sources
- Inline stream mappers transform records during extraction using Python expressions to filter rows, hash fields, or derive new columns
- Replication key signposts establish maximum bookmark values at sync start to correctly handle out-of-order records
- Lock-based state concurrency control uses timestamped lock files to prevent simultaneous state modifications during parallel pipelines
- Declarative YAML configuration lets you specify INCREMENTAL, FULL_TABLE, or LOG_BASED strategies per stream
Pricing
- Pricing is free and open-source with no licensing fees.
- There is no free trial, and only infrastructure costs apply.
Why Use It? Perfect for organizations seeking a flexible, open-source tool to handle their entire data pipeline.
Best For: Data teams that require a modular and extensible solution for managing data pipelines.
5. Hadoop – Best for big‑data batch ETL
G2 rating: 4.4 (141)
Overview
Apache Hadoop is an open-source framework for storing and processing massive datasets across distributed computing clusters. Instead of relying on a single powerful machine, Hadoop distributes data and computation across multiple commodity servers.
Hadoop consists of four main modules: HDFS (Hadoop Distributed File System) for storage, YARN for resource management, MapReduce for processing, and Hadoop Common utilities.
It’s best suited for large enterprises dealing with petabytes of data that need cost-effective storage and batch processing capabilities.
Key features
- NameNode metadata management maintains a complete filesystem namespace in memory for millisecond-latency file operations
- Rack-aware block placement schedules MapReduce tasks on nodes physically storing required data blocks, reducing bandwidth consumption by up to 50%
- Speculative execution detects slow tasks, launches duplicate copies on alternative nodes, and accepts the first completion to prevent job delays
- Pluggable InputFormat interfaces allow parsing of custom file formats including compressed archives, XML, and proprietary binary formats
- Combiner functions execute reduce-like aggregations locally before the shuffle phase to reduce intermediate data volume across the network
Pricing:
- There is no free trial, and infrastructure costs may apply.
- Pricing is free and open-source with no licensing costs.
Why Use It? Extensible data integration tool with CLI interface and built-in ELT orchestration.
Best For: Large enterprises needing to store and process big data efficiently in a distributed system.
6. Informatica PowerCenter – Best enterprise-grade ETL and data governance
G2 Rating: 4.4 /5 (88)
Overview
Informatica PowerCenter is a comprehensive enterprise data integration platform widely used for data warehousing and governance. It’s been a market leader for decades, serving large organizations with complex data environments.
PowerCenter excels at handling sophisticated data integration jobs with advanced transformation capabilities, metadata management, and data quality features. It supports both on-premise and cloud deployments.
This tool is ideal for large enterprises with stringent data governance requirements and complex, high-volume data integration needs.
Key features
- Pipeline partitioning creates separate thread pools using round-robin, hash-key, or key-range methods to parallelize operations across CPU cores
- Checkpoint-based session recovery persists commit points at configurable row intervals, enabling restarts after failures without reprocessing entire datasets
- Dynamic partitioning automatically scales partition count at runtime based on database physical partitions or available CPU cores
- Constraint-based load ordering writes to primary key tables before dependent foreign key tables within a single session to preserve referential integrity
- SQL query override enables pushdown optimization by offloading complex operations like CTEs and window functions directly to source databases
Pricing:
- It also offers a free plan and three different paid plans for cloud data management.
- Informatica supports volume-based pricing.
Why Use It? Enterprise-grade data integration with AI-powered ETL automation and strong governance features.
Best For: Large enterprises with complex data workflows and stringent data governance needs.
7. AWS Glue – Best serverless ETL for AWS ecosystem
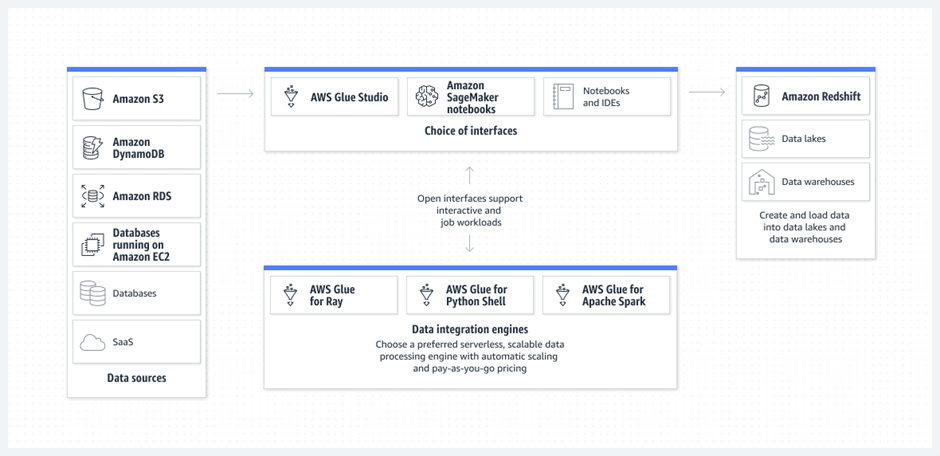
Overview
AWS Glue is a fully managed, serverless ETL service designed specifically for the AWS ecosystem. It automates data discovery, transformation, and loading without requiring infrastructure management.
Glue’s Data Catalog automatically discovers and catalogs metadata using crawlers, making it easy to understand and query your data. The service integrates seamlessly with other AWS services like S3, Redshift, and Athena.
It’s perfect for AWS-centric organizations looking to build scalable data pipelines without managing servers or worrying about infrastructure.
Key features
- Job bookmarks track S3 object timestamps and JDBC cursor positions to enable incremental processing by filtering previously processed files
- DynamicFrame handles columns with multiple data types by casting or splitting them to prevent downstream processing failures
- Spark shuffle partition tuning adjusts default partition counts to target optimal sizes based on input data volume
- Python Shell jobs execute non-Spark ETL scripts for up to 48 hours, providing cost-effective processing for API integrations and file transformations
- DataBrew visual profiling generates statistical summaries and quality reports with 250+ no-code transformations including deduplication and outlier detection
- The first 1 million Data Catalog objects are free, and no free trial is mentioned.
- AWS Glue supports plans based on hourly rating, billed by the second, for crawlers (discovering data) and extract, transform, and load (ETL) jobs (processing and loading data).
Why Use It? Serverless AWS ETL for integrating and transforming data at scale with minimal management overhead.
Best For: AWS-centric organizations looking to simplify data integration and transformation.
8. IBM Infosphere – Best for enterprise data integration across on‑prem and cloud
G2 rating: 4.1 /5(23)
Overview
IBM InfoSphere Information Server is a comprehensive data integration platform designed for large enterprises. It provides tools for understanding, cleansing, monitoring, transforming, and delivering data across on-premise and cloud environments.
The platform offers massively parallel processing (MPP) capabilities, making it highly scalable for enterprise workloads. It includes modules for data quality, master data management, and information governance.
InfoSphere is best suited for large organizations with complex, hybrid IT environments requiring robust data governance and quality management.
Key features
- Partition parallelism divides datasets across processing nodes using hash, range, round-robin, or modulus methods for efficient local join execution
- Balanced Optimizer converts DataStage transformation logic into vendor-specific SQL for Teradata and DB2, eliminating inter-system data movement
- Runtime Column Propagation adopts and propagates undefined columns encountered at execution time through all remaining job stages without errors
- FastTrack auto-generates DataStage jobs from metadata imports with complete lineage documentation stored in the metadata warehouse
- Shared container versioning stores encapsulated transformation logic as reusable repository objects with central version control
Pricing:
- Pricing is enterprise-level with custom quotes and subscription-based licensing..
- Pricing depends on the size of your company, the service level needed, and the particular modules or components you want. IBM usually offers a variety of Infosphere versions and price choices.
Why Use It? Comprehensive data management with features like governance, analytics, and warehousing.
Best For: Enterprises with complex, high-volume data integration and governance needs.
9. Azure Data Factory – Best ETL orchestration within Azure
G2 rating: 4.6 (94)
Overview
Azure Data Factory (ADF) is Microsoft’s cloud-native data integration service for creating ETL and ELT pipelines. It’s a serverless platform that orchestrates data movement and transformation across Azure and on-premises environments.
ADF supports both no-code ETL visual interfaces and code-based development, making it accessible to different user types. It integrates tightly with Azure Synapse Analytics for end-to-end analytics solutions.
This tool is perfect for organizations invested in the Azure ecosystem who need to build scalable, hybrid data pipelines.
Key features
- Tumbling window trigger dependencies ensure downstream pipelines only process after upstream windows complete successfully
- Self-hosted Integration Runtime registers multiple on-premises machines with shared auth keys to establish private VPN/ExpressRoute connectivity to Azure
- PolyBase staging routes source data through Azure Blob containers and distributes loads across Synapse compute nodes for massive parallel ingestion
- Pipeline parameterization passes runtime values through dynamic expressions to configure sources, destinations, and activity properties for multiple datasets
Pricing
- It follows a consumption-based model.
- Pricing is based on usage, including per 1,000 activity runs, DIU-hour, and vCore-hour.
Why Use It: Cloud-native data pipeline orchestration for hybrid and on-premises data integration.
Best For: Companies with Azure cloud infrastructure looking to automate data workflows across platforms.
10. Google Dataflow – Best for data‑processing pipelines and stream/batch ETL
G2 rating: 4.2 /5(44)
Overview
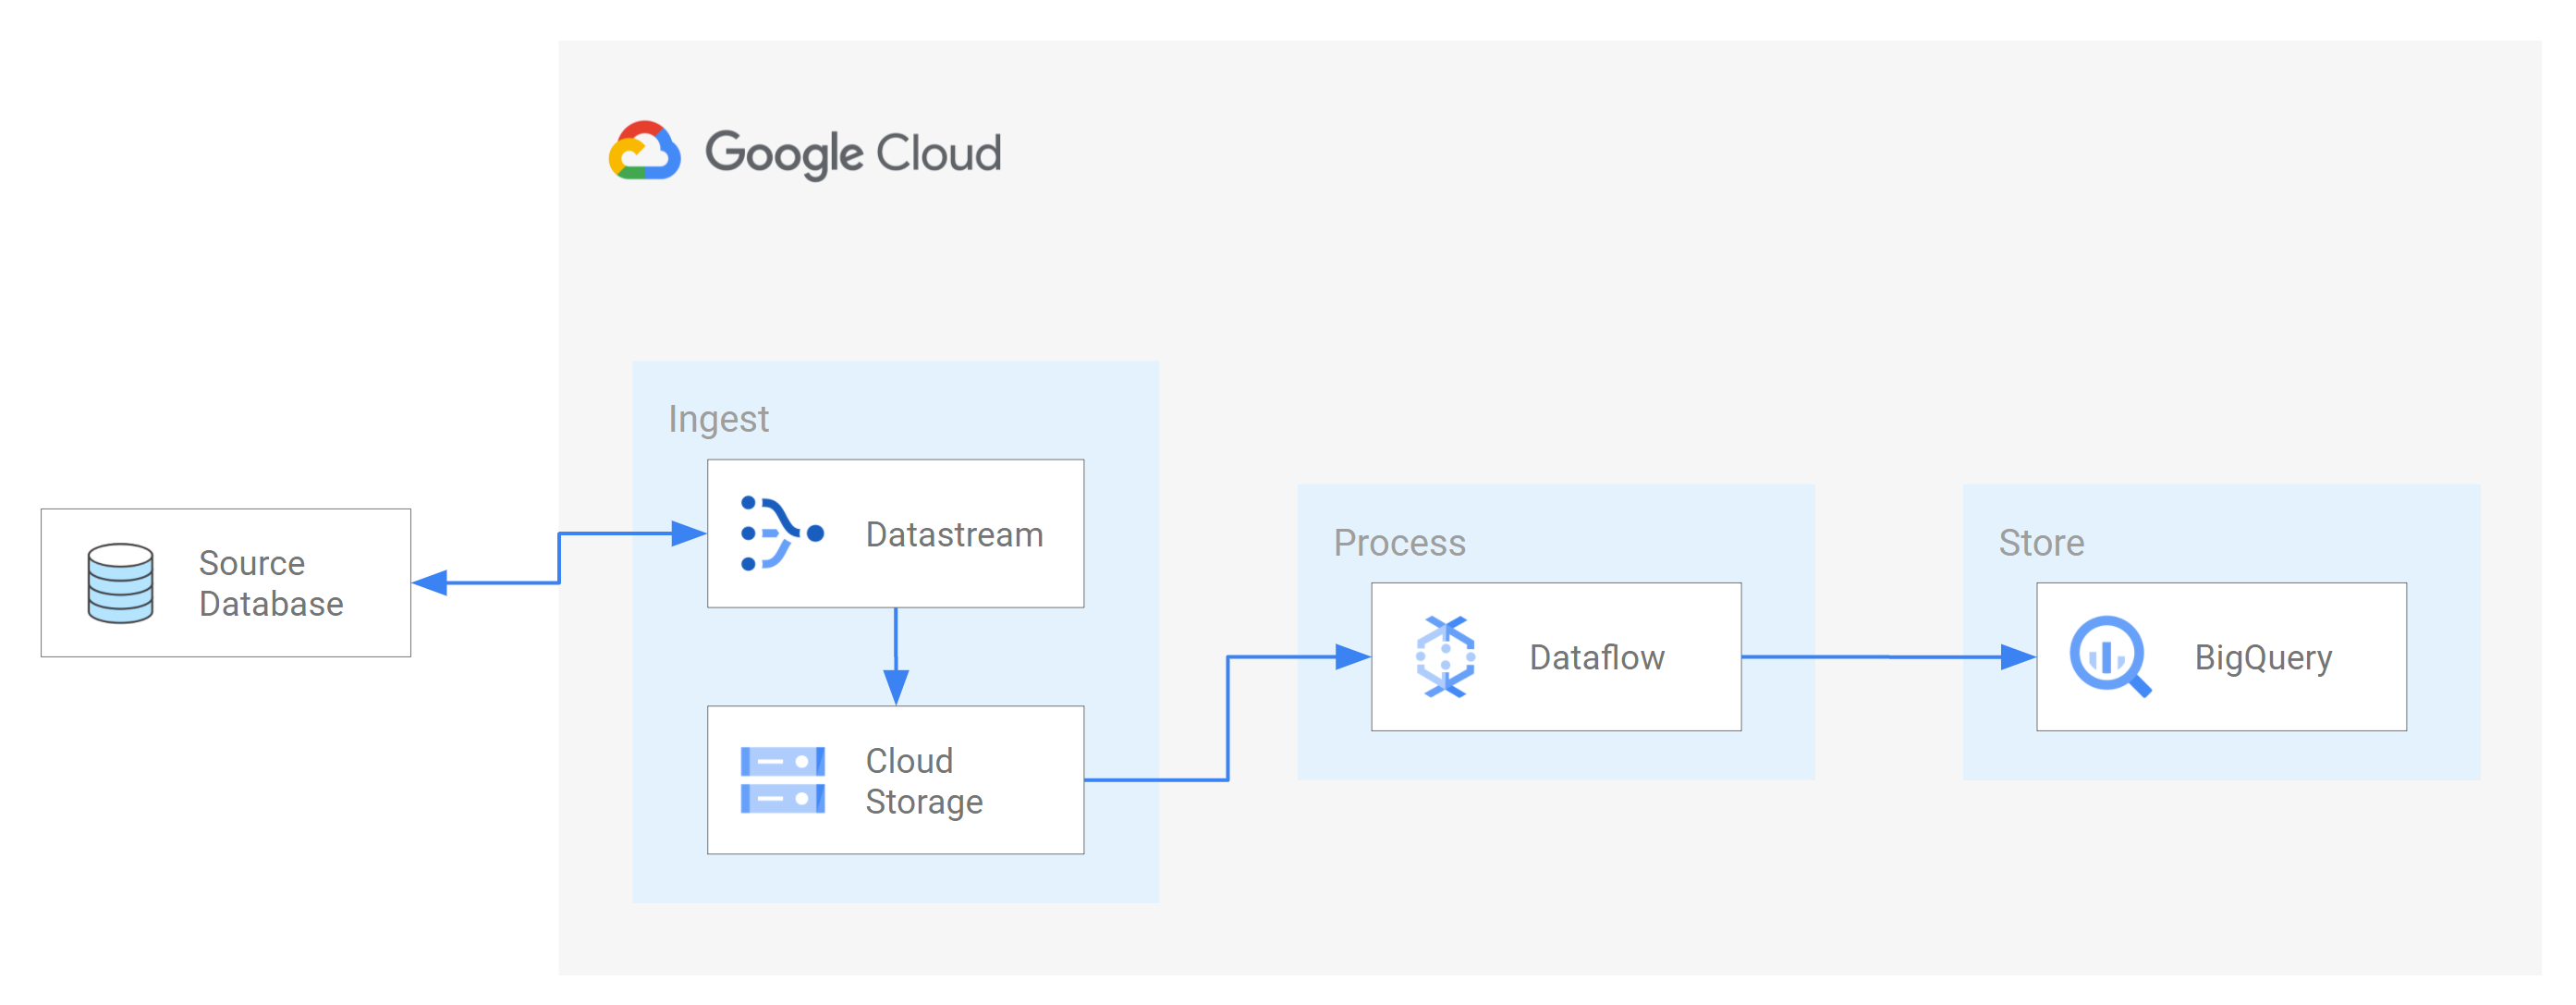
Google Cloud Dataflow is a fully managed service for executing Apache Beam ETL pipelines for both batch and streaming data processing. It provides a unified programming model that works seamlessly across batch and real-time scenarios.
Dataflow automatically handles resource provisioning, optimization, and scaling, making it a true serverless solution. It integrates natively with other Google Cloud services like BigQuery, Pub/Sub, and Cloud Storage.
It’s ideal for Google Cloud customers who need a powerful, scalable solution for complex data transformations and real-time analytics.
Key features
- Event-time windowing uses watermarks derived from event timestamps to accept and reprocess late-arriving records within configurable durations
- Streaming Engine offloads shuffle operations and window state management to Dataflow’s managed backend, reducing worker resource requirements
- FlexRS schedules batch jobs on discounted spot instances combined with standard VMs for approximately 40% cost savings
- Side input broadcasting materializes small datasets as in-memory views for enrichment joins without shuffling large collections
- Snapshot-based pipeline updates capture point-in-time state to allow code or configuration changes without losing window buffers or unacknowledged messages
Pricing:
- It follows a pay-as-you-go model.
- Pricing includes $0.056 per batch vCPU-hour, $0.003557 per GB-hour memory, and $0.069 per streaming vCPU-hour.
Why Use It: Stream and batch data processing with fully managed infrastructure by Google Cloud.
Best For: Google Cloud customers needing a serverless GCP ETL solution for real-time and batch data processing.
11. Stitch – Best lightweight cloud ETL for SMBs
G2 rating: 4.4/5 (68)
Overview
Stitch is a cloud-first ETL platform acquired by Talend, designed for simplicity and speed. It focuses on rapid data replication from 130+ sources to popular data warehouses without complex configuration.
Stitch uses an open-source Singer framework for connectors, allowing the community to extend and customize integrations. It’s optimized for straightforward data movement with minimal transformation.
This tool works best for small to medium businesses and data teams who need quick, reliable data integration without extensive engineering resources.
Key features
- Replication key bookmark persistence stores maximum column values after each job and queries sources for records greater than that threshold
- Log position tracking reads MySQL binary logs and PostgreSQL WALs, bookmarking exact log offsets for precise CDC resumption
- Anchor Time scheduling combines user-selected anchor times with frequency intervals to create predictable, non-overlapping sync schedules
- Row-based pricing calculates monthly charges by summing all replicated row counts regardless of column count or data volume
Pricing:
- It offers a 14-day free trial.
- Pricing includes Standard at $100/month, Advanced at $1,500/month, and Premium at $3,000/month.
Why Use It: Simple and fast SaaS-based ETL with automated connectors for small to medium businesses.
Best For: Data teams who need a simple, easy-to-use ETL tool with minimal configuration
12. Oracle Data Integrator(ODI) – Best for Oracle‑centric data integration
G2 Rating: 4/5 (19)
Overview
Oracle Data Integrator is a comprehensive data integration platform optimized for Oracle environments but capable of handling diverse data sources. It uses an E-LT (Extract-Load-Transform) architecture that leverages the power of target databases.
ODI supports high-volume batch loads, real-time integration, and SOA-enabled data services. It integrates with Oracle GoldenGate for change data capture and Oracle Warehouse Builder for legacy migrations.
This tool is best for organizations heavily invested in Oracle technologies that need high-performance data integration capabilities.
Key features
- Flow control with constraint-based error isolation writes violating records to error tables and recycles corrected rows back without full re-extraction
- Consistent Set journalizing maintains transactional consistency through ordered change capture to journal tables with a multi-subscriber CDC model
- Load plan restart stores execution state so failed orchestrations can resume from the exact failed step rather than re-running the entire plan
- Declarative variable refresh executes SQL queries at runtime to populate variables for parameterized filtering and dynamic schema targeting
Pricing:
- It is provided through custom quotes.
- Pricing is enterprise-based with subscription and perpetual licensing options.
Why Use It? High-performance bulk data movement and transformation for Oracle and non-Oracle environments.
Best For: Enterprises heavily invested in Oracle technologies.
13. Integrate.io – Best no‑code ETL for rapid deployment

G2 rating: 4.3 /5(208)
Overview
Integrate.io is a low-code data integration platform designed for business users and analysts who need to build data pipelines quickly. It offers visual, drag-and-drop interfaces for ETL, reverse ETL, and data observability.
The platform specializes in marketing and sales data integration, with pre-built connectors for advertising platforms, CRMs, and analytics tools. It also provides data transformation and warehouse management features.
Integrate.io is ideal for marketing teams, sales operations, and business analysts who need to integrate SaaS data without relying on engineering resources.
Key features
- Package variable-driven incremental extraction tracks the last successful job timestamp and falls back to a full load on the initial run
- Manifest file-based processing compares current storage listings against previously processed file manifests to read only new or modified files
- Reverse ETL pushes transformed warehouse data back into CRMs and marketing platforms through API mappings, enabling data activation without manual exports
- Row-level sync debugging captures individual API requests, response codes, field mappings, and transformation logic for each record during destination writes
- Anomaly detection monitors record volumes, error rates, and data freshness, triggering alerts when metrics breach historical baseline patterns
Pricing
- It is contract-based and designed for enterprise use.
- Pricing starts at $1,999/month with a fixed-fee model.
Why Use It? Low-code ETL with rich transformations and a focus on ease of use.
Best For: SaaS-heavy businesses that need real-time data integration.
14. Fivetran – Best ETL tool for enterprises
G2 Rating: 4.2/5 (447)
Overview
Fivetran is a fully automated ELT platform built to remove the need for hands-on pipeline management. Its “set it and forget it” approach allows teams to configure pipelines once and rely on them to run continuously in the background.
The platform automatically handles API changes and schema evolution, ensuring data replication remains stable as source systems change. This built-in maintenance reduces operational overhead and minimizes the risk of pipeline failures.
Fivetran also supports in-warehouse transformations through dbt integration, enabling analytics-ready data models. It is well-suited for companies that need reliable, automated data movement without dedicating engineering resources to ongoing pipeline upkeep.
Key features
- HVR binary log reader parses transaction logs at the OS level with read permissions, maintaining commit ordering without adding query overhead on source systems
- Hybrid Deployment Agent processes pipelines within customer infrastructure via Kubernetes or Docker, ensuring actual data never traverses public networks
- Adaptive sync frequency with Smart Syncing triggers dbt transformations only after all upstream connector syncs complete successfully
- Trigger-based CDC fallback deploys database triggers to record INSERT, UPDATE, and DELETE operations when transaction log access is restricted by security policies
Pricing:
- It follows a usage-based pricing model.
- Pricing includes a free tier with 500,000 MAR/month and paid plans based on usage with a $5 base charge.
Why Use It? Fully automated, reliable data replication with built-in schema evolution, support, and an extensive connector library.
Best For: Companies looking for automated data integration with minimal configuration.
15. Qlik – Best for integrated BI & ETL workflows
G2 Rating: 4.3 (123 )
Overview
Qlik’s Data Integration Platform combines ETL capabilities with advanced analytics and business intelligence features. It specializes in real-time data streaming and automated data pipeline creation for cloud and hybrid environments.
Qlik offers change data capture (CDC) for real-time replication from databases, mainframes, and SAP systems. It also includes data warehouse automation and integration with Qlik Sense for end-to-end analytics.
This platform is best for organizations that want integrated data integration and analytics capabilities in a single solution.
Key features
- Batch-optimized apply uses transaction coalescing via MERGE statements to reduce write operations and improve warehouse load efficiency
- Metadata-driven dimensional modeling auto-generates star schema structures including fact and dimension tables from source metadata
- Landing zone architecture stages raw data in tracked warehouse tables before applying transformations for structured, auditable writes
- Parallel full load segments large tables and distributes extraction across multiple threads to maximize ingestion throughput
Pricing:
- It follows a subscription-based model.
- Pricing includes Starter at $200/month, Standard at $825/month, Premium at $2,750/month, and Enterprise with custom quotes.
Why Use It: Real-time data movement with advanced analytics and visualization capabilities.
Best For: Teams focused on data analysis, business intelligence, and reporting.
16. Portable.io – Best for high‑connector‑volume ELT
G2 Rating: 4.9/5 (26)
Overview
Portable specializes in connecting to long-tail, niche data sources that other ETL providers often overlook. With over 1,300 pre-built connectors, it focuses on breadth rather than depth of features.
The platform offers a simple, no-code interface for setting up data flows from obscure APIs and applications. Connectors are maintained by Portable’s team, ensuring reliability even for less common sources.
Portable is ideal for businesses with diverse, niche data sources that aren’t covered by mainstream ETL tools.
Key features
- Over 1,300 pre-built connectors cover niche and long-tail data sources that mainstream ETL vendors typically do not support
- Cursor-based incremental extraction with boundary row handling ensures no records are missed or duplicated across sync cycles
- Exponential backoff retry logic automatically handles API rate limits and transient failures without manual intervention
- Auto schema discovery uses API introspection to detect and map source fields without requiring manual schema definition
- Flat-fee pricing model charges a fixed rate with no per-connector or per-volume overages, making costs fully predictable
Pricing:
- It offers a 14-day free trial.
- Pricing includes Standard at $1,800/month, Pro at $2,800/month, and Advanced at $4,200/month.
Why Use It: Quick deployment of long-tail connectors tailored to niche data sources.
Best For: Small-to-medium businesses with a strong SaaS ecosystem.
17. Skyvia – Best budget‑friendly ETL with no‑code simplicity

G2 Rating: 4.8/5 (291)
Overview
Skyvia is a cloud-based data platform offering integration, backup, and management capabilities at affordable price points. It provides wizards and visual tools that eliminate the need for coding.
The platform supports data integration, database replication, backup, and query across cloud and on-premises sources. It’s hosted on Azure infrastructure for reliability and global availability.
Skyvia works well for small to medium businesses with limited budgets who need straightforward data integration without technical complexity.
Key features
- Modified column comparison identifies changed records during incremental sync without relying solely on timestamp fields
- History Mode creates a full audit trail by storing every change as a separate row rather than overwriting existing records
- Federated query engine (Skyvia Connect) enables querying across multiple disparate sources simultaneously through a unified interface
- Per-table bookmarks provide object-level sync management so individual tables can be tracked and resumed independently
- Agent-based encrypted HTTPS tunnel establishes secure connectivity to on-premises sources without opening inbound firewall ports
Pricing
- Paid plans are tiered based on usage.
- Pricing includes a free tier with 10k records/month, limited scheduling, and 2 flows.
Why Use It? Cloud-based integration for syncing, migrating, and backing up data with ease.
Best For: Teams with limited technical expertise who need to automate data integration and backups.
See a detailed list of Skyvia alternatives
18. Matillion – Best cloud‑native ETL/ELT for data warehouses

G2 Rating: 4.4/5 (81)
Overview
Matillion is a cloud-native data integration platform built specifically for modern cloud data warehouses like Snowflake, BigQuery, and Redshift. It leverages the processing power of these warehouses for transformations.
The platform offers both ETL and ELT capabilities with a visual, drag-and-drop interface. Matillion’s PipelineOS provides intelligent resource allocation and dynamic scaling based on workload.
It’s perfect for teams working primarily with cloud data warehouses who want to maximize performance by pushing transformations down to the warehouse.
Key features
- Log-based CDC via Docker containers enables real-time change streaming from source databases directly into the warehouse
- Environment-specific configuration variables separate Dev, QA, and Prod settings so the same job can be promoted across environments
- Git-based version control tracks all jobs and transformations with full commit history, branching, and rollback capability
- Auto-scaling containerized architecture spins compute resources up or down on demand based on active pipeline workloads
- Hybrid deployment model keeps the UI in the cloud while all data processing stays within the customer’s own VPC
Pricing
- It follows a credit-based consumption pricing model
- Pricing includes Developer (1 user), Teams (5 users), and Scale plans.
Why Use It? Cloud-native ETL optimized for modern data warehouses like Snowflake and BigQuery.
Best For: Teams working with cloud data warehouses that need a scalable ETL solution.
19. SSIS – Best ETL for Microsoft SQL Server environments
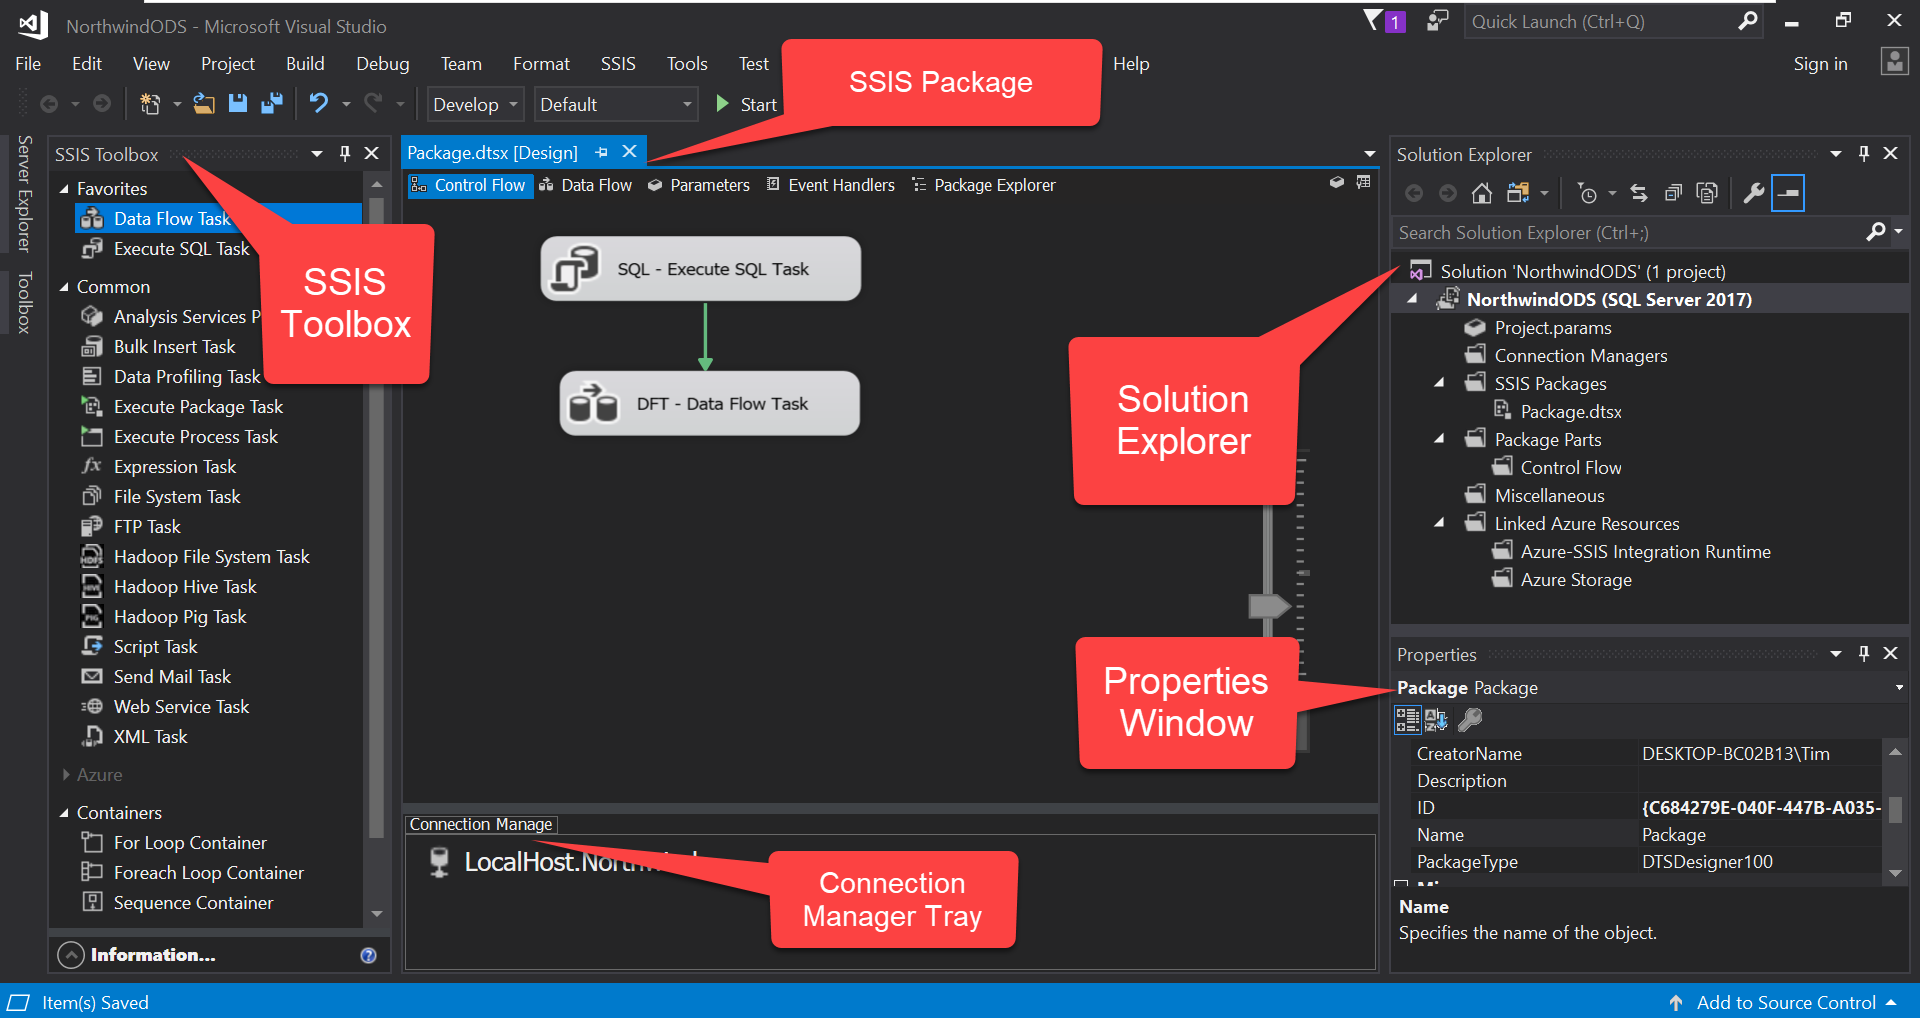
Overview
SQL Server Integration Services (SSIS) is Microsoft’s enterprise ETL platform included with SQL Server. It’s designed for building data integration and transformation solutions within Microsoft ecosystems.
SSIS offers a visual designer for creating packages that extract, transform, and load data. It includes extensive built-in tasks and transformations, and supports custom development using .NET languages.
This tool is ideal for organizations heavily invested in Microsoft technologies, particularly SQL Server, that need powerful on-premise ETL capabilities.
Key features
- Smart auto memory buffer management dynamically allocates between 1 and 100 MB per transformation to optimize throughput
- Checkpoint-based recovery stores job progress to disk so failed packages can resume from the last successful checkpoint
- Environment-based configuration allows a single SSIS package to use different connection strings and settings per deployment environment
- Parallel data processing routes records through multiple transformation paths simultaneously to maximize pipeline performance
- All-or-nothing transaction control wraps multiple steps in a single transaction with automatic rollback on failure to guarantee data consistency
Pricing
- It is part of SQL Server licensing.
- Pricing includes free Developer and Express editions, along with paid Standard and Enterprise editions.
Why Use It? Powerful ETL for Microsoft SQL Server with extensive transformations and control flow options.
Best For: Organizations heavily invested in Microsoft technologies
20. Rivery – Best unified ETL + Reverse ETL platform

G2 rating: 4.7 /5 (120)
Capterra rating: 5/5 (12)
Overview
Rivery is a versatile ELT platform known for its flexibility and comprehensive data management capabilities. Recently acquired by Boomi, it provides an intuitive interface for creating and managing data pipelines with both forward and reverse ETL.
Rivery supports real-time data processing and offers extensive customization options for complex workflows. Its visual canvas makes it easy to build sophisticated pipelines without extensive coding.
The platform is perfect for teams that need both traditional ETL (getting data into warehouses) and reverse ETL (syncing warehouse data back to operational tools).
Key features
- Python transformation runtime supports pandas and NumPy for complex in-pipeline data manipulation without external compute
- REST API orchestration supports conditional chaining logic so downstream steps only execute based on upstream API response outcomes
- Inbound webhook endpoints accept real-time event streams and trigger pipeline execution upon payload receipt
- Hash-based change detection identifies modified records in sources that lack timestamp or sequence fields
- Variable passing between pipeline steps enables dynamic SQL generation and parameterized execution across multi-stage workflows
Pricing:
- It follows a credit-based pricing model.
- Pricing starts at $0.75/RPU for Starter and $1.20/RPU for Professional, with Enterprise custom pricing.
Why Use It: Fully managed ELT with pre-built connectors and no-code workflows for faster delivery.
Best for: Teams needing both ETL and reverse ETL with real-time workflows.
Choose Hevo Data for Real-time ETL Processes from Over 150+ Sources

With dozens of ETL platforms available, each promising fast setup and reliable pipelines, how do you choose the best one for your needs? The difference becomes clear when you compare actual performance, maintenance overhead, and total cost of ownership.
Hevo is a no-code data integration platform built for teams who want to spend time analyzing data, not fixing pipelines. It moves data in real time from 150+ sources, including SaaS tools, databases, and ad platforms, into your warehouse without requiring engineering resources.
What makes Hevo a top choice in 2026:
- 150+ pre-built connectors with no-code setup for reliable data ingestion from diverse sources.
- Real-time and batch processing to keep your dashboards and reports current.
- Transparent, event-based pricing that eliminates surprise costs and scales predictably with usage.
- Auto-schema mapping and error handling that adapts to source changes without breaking workflows.
- Zero-maintenance monitoring with automatic alerts and self-healing pipelines.
- Scales seamlessly from startup to enterprise workloads without migration headaches.
Real-world impact: Plentific increased its data processing efficiency by 800% after switching to Hevo.Ready to see how Hevo works for your use case? Sign up for a free trial or schedule a demo.
FAQs
What is the best cloud ETL tool?
Choosing the best cloud ETL tool depends on your specific needs, but some of the top options in 2026 include AWS Glue, Google Cloud Dataflow, Azure Data Factory, and Hevo Data.
Is AWS Glue ETL or ELT?
AWS Glue is primarily an ETL (Extract, Transform, Load) tool. It automates data extraction, transformation, and loading, making it easier to prepare and move data for analytics.
Which ETL tool is in demand in 2026?
As of 2026, some of the most in-demand ETL tools include Hevo Data, AWS Glue, Databricks, and Azure Data Factory. These tools are popular due to their scalability, ease of use, and integration capabilities with various data sources and services.
Is Snowflake an ETL tool?
Snowflake is not primarily an ETL tool; it’s a cloud data platform. However, it has built-in data transformation capabilities and can work seamlessly with ETL tools like Hevo Data, Matillion, and Talend to provide a complete data pipeline solution.
What is an ETL tool and how does it work?
An ETL (Extract, Transform, Load) tool helps organizations move data from various sources into a centralized system like a data warehouse.
1. Extract: Collects data from different sources (e.g., databases, SaaS tools).
2. Transform: Cleans, enriches, and formats data to match target schema.
3. Load: Sends the processed data to a destination like Snowflake, BigQuery, or Redshift.
Modern ETL tools also support ELT, where transformation happens after loading.
What’s the difference between ETL and ELT?
ETL transforms data before loading it into the destination.
ELT loads raw data first, then performs transformations within the target system (e.g., using SQL in Snowflake).
ELT is often preferred in modern cloud data warehouses for performance and scalability.
Do ETL tools support real-time data pipelines?
Some ETL tools support real-time or near real-time data streaming (e.g., Hevo, Fivetran, StreamSets). Others operate in batch mode with scheduled intervals. Choose based on how current your data needs to be for reporting or operations.
Can I use ETL tools without technical expertise?
Yes. Several modern ETL tools offer a no-code or low-code interface (e.g., Hevo, Integrate.io), allowing non-engineers to create and manage pipelines. However, complex transformations or error handling may still benefit from technical involvement.
Are open-source ETL tools reliable for production use?
Open-source ETL tools like Apache NiFi, Talend Open Studio, and Airbyte are widely used and can be very powerful. However, they may require:
– More setup and infrastructure management
– Engineering expertise
– Community or paid support for troubleshooting
They’re great for teams with the right resources but may not suit everyone.
Why is ETL Important?
ETL (Extract, Transform, Load) is a crucial business process because it ensures data is reliable, accessible, and ready for decision-making. Here’s why it matters:
1. Integrates Multiple Data Sources: ETL centralizes data from different systems into one place, making analysis easier and more consistent.
2. Improves Data Quality: The transformation step cleans, standardizes, and validates data to ensure accuracy.
3. Saves Time & Effort: Automation reduces manual data handling, speeding up the insights flow.
4. Scales with Your Business: ETL can adapt to growing data volumes and complexity, whether you’re a startup or a large enterprise.


Share it with your connections.
-
 Share To X
-
 Share To LinkedIn
-
 Share To Facebook
-
 Copy Link


