Unlock the full potential of your data by integrating it seamlessly with BigQuery. With Hevo’s automated pipeline, get data flowing effortlessly—watch our 1-minute demo below to see it in action!
Google BigQuery is a serverless and scalable enterprise data warehouse that helps businesses to store and query data. It has lightning-fast analytics to analyze huge datasets without loss of performance. To perform CRUD operations using Python on data stored in Google BigQuery, there is a need for connecting BigQuery to Python.
Connecting BigQuery to Python not only allows you to execute CRUD operations but also using Python code, you can manually transform data to load it in BigQuery for further analysis. For teams that prefer building code-first pipelines, evaluating mature Python ETL tools helps accelerate extraction, transformation, and load logic while keeping maintainability in check.
This post will walk you through the process of connecting BigQuery to Python in 9 easy stages. Continue reading to learn more about BigQuery, why you should link it to Python, and how to do so.
Table of Contents
What is Google BigQuery?

Google BigQuery is a completely managed cloud-based data warehouse that can process petabytes of data. A completely managed data warehouse allows the customers to focus on their core business problems rather than spending time developing and maintaining their own custom data warehouse.
Other than the standard data warehouse features like a comprehensive SQL layer and super fast querying abilities, BigQuery provides a complementary suite of accompanying services that further enhances its value proposition.
BigQueryML helps customers to run machine learning models through its simple SQL language. Connected sheets allow data from BigQuery to be analyzed through Google sheets. A recent interesting addition, even though in the alpha state has been the BigQueryQnA service that allows querying in natural language constructs.
BigQuery’s data processing abilities go beyond data stored in its own storage classes. It can also process data from many external sources like Google cloud storage, Big table, Google Cloud SQL, Google Drive, etc. Recent developments also allow it to run on other cloud providers through BigQuery Omni. This post is about connecting BigQuery to Python and processing data.
Key Features of Google BigQuery
Google BigQuery has gained tremendous popularity in the market. Here are some of the key features of Google BigQuery:
- Scalability: Google BigQuery leverages massively parallel processing and a highly scalable secure storage engine to deliver scalability and consistent performance to customers.
- Manageability: By offering serverless execution, Google BigQuery takes care of difficult maintenance and setup operations like Server/VM Administration, Server/VM Sizing, Memory Management, and many more.
- Built-in AI (Artificial Intelligence) and ML (Machine Learning): Google BigQuery’s auto ML feature aids in the development of high accuracy models and enables Predictive Analysis.
- Storage: To store massive amounts of data, Google BigQuery utilizes a Column-based Architecture. Columnar storage provides numerous advantages over traditional row-based storage, which include improved storage usage and the ability to scan data quickly.
- MultiCloud Functionality: This is one of the best features that separates Google BigQuery from other similar solutions in the market. It allows users to analyze data in more than one cloud as opposed to other solutions that make it hard to migrate data from one cloud to the next.
Importance of Connecting BigQuery to Python
Organizations that use BigQuery for their data warehousing needs often need to access the data from BigQuery using programming languages. The typical requirement for this emerges from the need to transform data into various forms suitable for consumption and for moving data to other databases for specific use cases.
Python is a very popular language choice for such needs, because of its data manipulation abilities and ease of integration with data processing frameworks like Spark. Additionally, using Python, retrieving data from the internet is likely to be more feasible, simpler, and durable.
If you ever encounter a problem while building your application, storing data in Google BigQuery, or while retrieving information, you are more likely to find a solution because Python carries a healthy and active community of enthusiasts who strive to make the language better every day. Not only do you gain this advantage, but also Python as a popular and widely employed programming language, enjoys strong support from the world’s largest corporations. This includes Google as well.
Connecting BigQuery to Python and using Python code to transform your data before loading it to the destination is one of the intricate ways to perform data transformation. While you may find this method a bit tricky, a simpler alternative is to use the No-code Drag-and-Drop Transformations by Hevo. Hevo provides a range of transformation blocks ready to be used on your data before loading into your destination, like:
- Control Functions
- Date Functions
- Event Manipulation
- JSON Manipulation
- Mathematical Functions
- Security Functions
- String Functions
These drag-and-drop transformation blocks are provided by default and can be configured for your use and tested before deploying.
Steps for Connecting BigQuery to Python
Google provides libraries for most of the popular languages to connect to BigQuery. The list of supported languages includes Python, Java, Node.js, Go, etc. The first step in connecting BigQuery to any programming language is to go set up the required dependencies. You will begin this tutorial by installing the python dependencies
Step 1: Install the Python BigQuery dependency as follows.
pip install --upgrade google-cloud-BigQueryStep 2: You will now go to the Google cloud service account page and set up a service account to access BigQuery from external libraries.
Click on the New Service Account and provide a name for the account. Ensure that you select the role of owner or editor. The account identifier will be prefilled automatically.
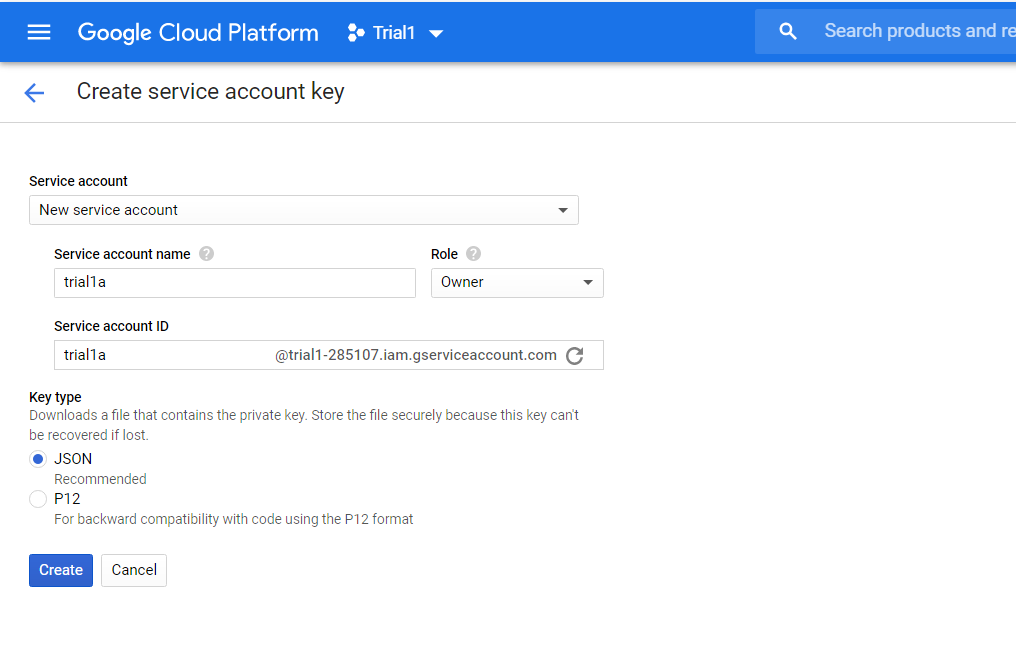
Step 3: Click on Create and you will notice the browser prompting you to download a JSON file. Download the file and keep it for future use. You will use the path of the saved file in the next step.
Step 4: You will now set up the environment variables for the Python script to use while accessing BigQuery.
export GOOGLE_APPLICATION_CREDENTIALS="/home/user/Downloads/my-key.json"Ensure that the path to the credential file is replaced with your original path in the above command.
Step 5: Next, use the python client library to create a simple script to access data from one of the public data sets available in BigQuery. The first step is to get the imports right.
from google.cloud import bigqueryStep 6: Initialize the client as below.
BigQuery_client = bigquery.Client()Step 7: Form the query as follows. The query will access a public data set in BigQuery that has data about names in the USA. Our query will group the names and find the count of each name.
name_group_query = """
    SELECT name, SUM(number)
    FROM `BigQuery-public-data.usa_names.usa_1910_2013`
    GROUP BY name, state
    ORDER BY total_people
    LIMIT 100
"""- Initiate the job as follows. A job in BigQuery is nothing but a query execution. Since query executions are long-running in some cases, they are addressed using the term job.
query_results = BigQuery_client.query(name_group_query) - The last step is to print the result of the query using a loop.
for result in query_results:
    print(str(result[0])+”,”+str(result[1]))
The above loop will print the name and count of the names separated by a comma. Let’s now take a look at the limitations posed while connecting BigQuery to Python.
What Makes Your BigQuery Data Integration Experience With Hevo Best-in-Class?
These are some benefits of having Hevo Data as your Data Automation Partner:
- Exceptional Security: A Fault-tolerant Architecture that ensures Zero Data Loss.
- Built to Scale: Exceptional Horizontal Scalability with Minimal Latency for Modern-data Needs.
- Built-in Connectors: Support for 100+ Data Sources, including Databases, SaaS Platforms, Files & More to Google BigQuery Data Warehouse. Native Webhooks & REST API Connector available for Custom Sources.
- Data Transformations: Best-in-class & Native Support for Complex Data Transformation at fingertips. Hevo also offers Code & No-code Flexibility for everyone.
- Smooth Schema Mapping: Fully-managed Automated Schema Management for incoming data with the desired destination.
- Blazing-fast Setup: Straightforward interface for new customers to work on, with minimal setup time.
Use Hevo’s No-code data pipeline to seamlessly ETL your data from multiple sources to Google BigQuery in an automated way. Try our 14-day full feature access free trial!
Sign up here for a 14-Day Free Trial!Limitations of Manually Connecting BigQuery to Python
That ends the step involved in connecting BigQuery to Python. A typical use case where you will need to use this approach is when you need to move data from BigQuery to another database (for example, using a Python Redshift connection) or to schedule an extraction process.
Even though this approach may serve the use case, it comes with a number of challenges.
- Most such requirements come with the need for scheduling and it can become a time-consuming affair to build a reliable scheduler.
- Most such extractions will require duplicates and deletions to be handled at the destination database end. It can be a pain to build such logic using queries and python logic.
Hevo automatically modifies the data type of Google BigQuery table columns to accommodate Source data with different data types. Try Hevo for free today!
Conclusion
This article provided you with a step-by-step guide for connecting BigQuery to Python manually. Now, there are certain limitations associated with this method. You will need to implement it manually, which will consume your time & resources, and writing custom scripts can be error-prone.
Moreover, while connecting BigQuery to Python, you need a full working knowledge of the backend tools to successfully implement the in-house Data transfer mechanism. You will also have to regularly map your new Python files to the BigQuery Data Warehouse.
Hevo Data provides an Automated No-code Data Pipeline that empowers you to overcome the above-mentioned limitations. Hevo caters to 100+ data sources (including 40+ free sources) and can seamlessly connect to BigQuery within minutes.
Visit our Website to Explore HevoHevo’s Data Pipeline enriches your data and manages the transfer process in a fully automated and secure manner without having to write any code. It will make your life easier and make data migration hassle-free.
Have any questions about connecting BigQuery to Python? Get in touch with us in the comment section below.
FAQ
How to connect to BigQuery through Python?
To connect to BigQuery through Python, use the google-cloud-bigquery library. Install it via pip (pip install google-cloud-bigquery), then authenticate using a service account or your Google Cloud credentials.
How to connect BigQuery to Jupyter?
To connect BigQuery to Jupyter, install the google-cloud-bigquery library as mentioned above. You can also use the pandas-gbq library to easily load and query BigQuery data into pandas DataFrames.
How to insert data into BigQuery using Python?
To insert data into BigQuery using Python, you can use the insert_rows_json() method from the BigQuery client.