Digital transformation has beckoned nearly every industry to understand the importance of Data Analytics. With the increase in data generation, the term “Data Analytics” has found its prominence by helping organizations make decisive actions. Our Data Analytics Guide will help you understand the inside-out know-how of Data Analytics and its importance in today’s world.
Data Analytics is not just limited to deriving insights from the past but also helps in predicting future outcomes and optimizing business processes. As every organization strives to become data-driven, Data Analytics assists every sector in advancing, as it facilitates metrics to help companies accomplish their milestones.
This Data Analytics Guide provides you with a comprehensive overview of Data Analytics. It also explains the types, processes, and tools involved while performing Data Analysis. Lastly, our Data Analytics Guide will brief you on application and career insights to grow in the field of Data Analytics.
What is Data Analytics?
 Image Source
Data Analytics deals with leveraging data to derive meaningful information. The process of Data Analytics primarily involves collecting and organizing Big Data to extract valuable insights, thereby increasing the overall efficiency of business processes.
Considering the importance of Data Analytics, Data Analysts work with various tools and frameworks to draw lucrative insights. With Data Analysis, organizations are able to take initiatives to respond quickly to emerging market trends; as a result, increase revenue.
Why Data Analytics is Important?
Implementing Data Analytics in various industries can optimize efficiency and workflow. Data Analytics has a wide variety of applications that can help businesses to stand in the competitive world and provide an edge.
The financial sector is one of the earliest sectors to adopt Data Analytics in banking and finance. Moreover, it helps to predict the market trends and assess risks. For example, Data Analytics is used in calculating the credit score of a person because it takes many factors into consideration for determining the lending risks. Also, Data Analytics is used for fraud prevention.
Data Analytics is not limited to focusing on more profits and ROI. It can also be used in the healthcare industry, crime prevention, etc. It uses statistics and advanced analytical techniques to generate valuable insights from the data and help businesses in making better data-driven decisions.
The applications of using Data Analytics are endless and it plays an essential role in making the process smooth, efficient, error-free, and more productive. Data is generating at a staggering rate and new opportunities are emerging to use Data Analytics on it.
Data Analytics Guide: Types of Data Analytics
Data has the potential to provide a lot of value to businesses, where the analytical component acts as a key factor to unlock insights. Based on techniques used, Data Analytics can be of four different types:
1) Descriptive Analytics
Descriptive Analytics is a statistical method to search and summarize historical data in order to identify patterns. This process lays the foundation of analysis to prepare datasets by Data Mining and Data Aggregation techniques. Visual tools such as Graphs, Pie, and Bar Charts are also used to present findings that can be understood by a wide business audience easily.
2) Diagnostic Analytics
Diagnostic Analytics takes a deeper look at past data to understand the root cause of events and behaviors. It includes processes such as data discovery, drill-down, and Regression Analysis to find the correlation and causation among key variables.
3) Predictive Analytics
Predictive Analytics uses a combination of statistics and Machine Learning techniques to forecast events based on historical data. As it involves studying patterns and trends, it allows organizations to mitigate risks and opportunities in the coming future.
4) Prescriptive Analytics
Prescriptive Analytics utilizes Artificial Intelligence and Machine Learning algorithms to determine possibilities along with recommendations. This analysis suggests the action and outlines the potential implications by making data-driven decisions.
Prescriptive Analytics is the natural progression of Descriptive and Predictive Analytics, making it the smartest and most efficient tool available to scaffold any organization’s business intelligence.
Hevo is a No-code Data Pipeline that offers a fully managed solution to set up data integration from 150+ data sources (including 40+ free data sources) to numerous Business Intelligence tools, Data Warehouses, or a destination of choice. It will automate your data flow in minutes without writing any line of code. Its fault-tolerant architecture makes sure that your data is secure and consistent. Hevo provides you with a truly efficient and fully automated solution to manage data in real-time and always have analysis-ready data.
Let’s look at Some Salient Features of Hevo:
- Secure: Hevo has a fault-tolerant architecture that ensures that the data is handled in a secure, consistent manner with zero data loss.
- Schema Management: Hevo takes away the tedious task of schema management & automatically detects schema of incoming data and maps it to the destination schema.
- Minimal Learning: Hevo, with its simple and interactive UI, is extremely simple for new customers to work on and perform operations.
- Hevo Is Built To Scale: As the number of sources and the volume of your data grows, Hevo scales horizontally, handling millions of records per minute with very little latency.
- Incremental Data Load: Hevo allows the transfer of data that has been modified in real-time. This ensures efficient utilization of bandwidth on both ends.
- Live Support: The Hevo team is available round the clock to extend exceptional support to its customers through chat, email, and support calls.
- Live Monitoring: Hevo allows you to monitor the data flow and check where your data is at a particular point in time.
Explore more about Hevo by signing up for the 14-day trial today!
Data Analytics Guide: Steps Involved in Data Analytics
Data Analytics involves more than just analyzing data. Most of the required work takes place upfront while preparing datasets. To perform Data Analysis, the following steps are involved in the process:
1) Data Collection
Data Collection forms the foundation of all other processes, thus it must strictly adhere to the business goals. Data can be collected by Web Scraping, Querying Databases, or using Big Data tools.
Although a huge volume of data is available today, only relevant data can provide the right insights to achieve business goals. In current scenarios, data is not restricted to Structured but also Unstructured formats such as text, images, and videos that are later partitioned for further Data Analysis.
2) Data Processing
Data collected is usually unstructured, inherited with few missing values, making it difficult to analyze. Data Processing maintains data quality by cleaning and transforming data into desired forms. This process involves imputation techniques to tackle null values and outliers along with various transformation methods to distribute data uniformly.
3) Data Analysis
Data Analysis is carried out using various software and tools to understand data and arrive at conclusions. Data Analysis requires prerequisite skills to create statistical data models such as Correlation and Regression Analysis to examine relationships. This process may involve Data Visualization tools to identify Linear, continuous characteristics inhibited within features.
4) Data Interpretation
Data Interpretation is the process of reviewing data through predefined processes to arrive at an informed conclusion. Data Interpretation helps Data Analysts make the audience understand the significance of numerical data by creating interactive Dashboards and Reports. This process uncovers facts and trends to find out meaningful information.
2 Key Skills Required for Data Analytics
Data Analytics is now a priority for businesses, choosing the right tool is vital to turn troves of data into usable information. Choice of tool depends on the problem statement, cost of infrastructure and type of data analyzed. Based on the effective tools utilized in the Data Analysis process, it can be categorized into two major parts:
1) Technical Skills
Data Analysts require Softwares and Applications to develop and perform analytical processes. It requires an understanding of Statistics, General-Purpose Programming, and Business Intelligence tools. Following are a list of tools prominent in the market:
- SQL Console: SQL (Structured Query Language) is a standard Programming Language used to manage/query data held in Relational Databases, particularly effective in handling Structured data as a Database tool for Data Analysts. This tool helps in storing, collecting, and organizing data for the Data Analysis process.
- Programming Languages: Python is the most popular tool for Data Crawling, Cleaning, Modeling, and constructing Machine Learning algorithms based on business scenarios. An extensive number of Modules, Packages, and Libraries make Python, a respected and favourite language across industries. However, the R language is widely used for performing Statistical Computing and Data Visualization.
- Business Intelligence Tools: Data Analysis is well underpinned by Data Visualization Platforms. Tableau and PowerBI are the most widely used tools for Data Visualization as they connect to several Databases and offer better security features. These tools come with a drag-and-drop interface, enabling the creation of enthralling Reports and interactive Dashboards that update in real-time.
2) Soft Skills
A Techno-savvy Analyst may become the best Data Analyst provided Soft Skills are correctly utilized. Soft Skills play a significant role as Data Analysts work with other branches of their organization to harness the power of data. Following are the necessary qualities required:
- Communication Skills: A Data Analyst digging through raw data to find insights would not add value if they fail to communicate with the decision-makers. Communication can be carried out through various mediums, including written, verbal, and especially with Visualization Software. Data Analysts are required to report their conclusions to a team or stakeholders, making public speaking and presentation skills valuable.
- Critical Thinking: Data Analysis process may be manual or automated, but it might not always be running in ideal condition. Critical Thinking allows Data Analysts to debug the code, troubleshoot the Machine Learning Algorithms, and efficiently capture the data required for Data Analysis. This skill is result-oriented when a team collaborates while overseeing a big project.
Data Analytics Guide: Applications of Data Analytics
With the advent of digitization, every segment of the industry has become data-driven. Some of the applications of Data Analytics are:
1) Sales and Marketing
 Image Source
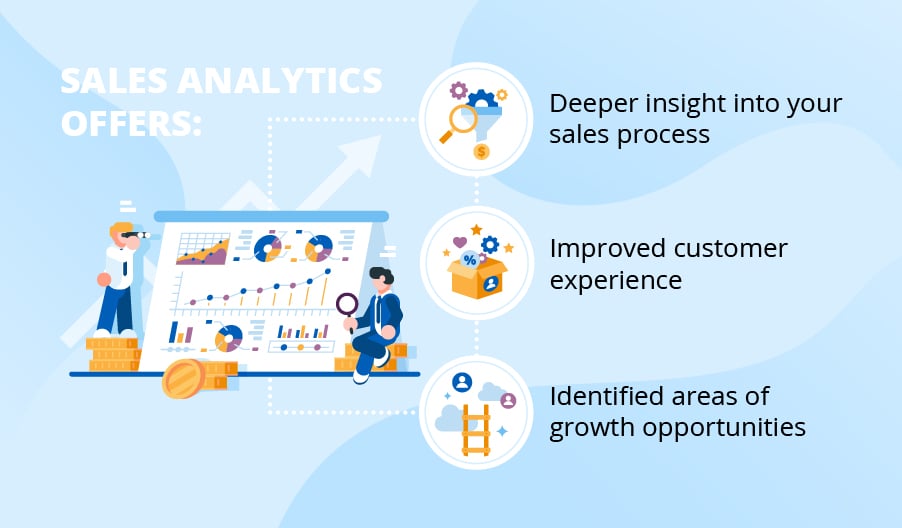
Data Analysis helps organizations in understanding customers right from the initial touchpoint till the purchase by analyzing behavior and preferences. In addition, Data Analysis also impacts marketing initiatives by providing Key Metrics to Stakeholders to devise Digital Marketing Strategies.
2) Healthcare
 Image Source
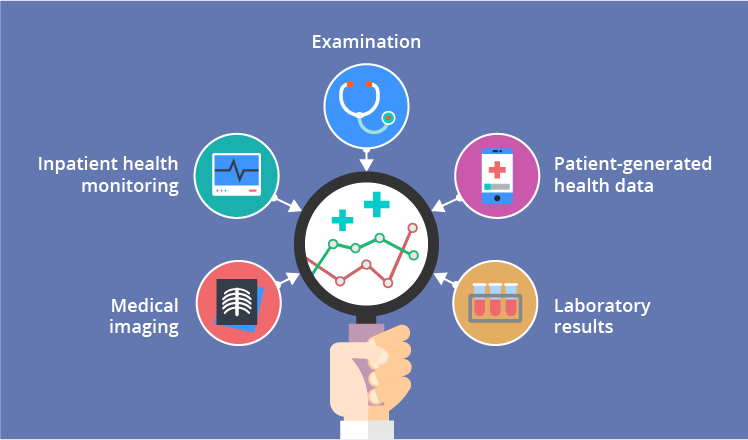
Data Analysis is making a great leap to discover treatments for disease and ill-effects of medicines. The Healthcare Industry is flourishing with features that prescribe medications, chatbots examining health, and customized health tips.
Benefits of Data Analytics
Some of the benefits of applying Data Analytics are listed below:
Collaborate and Simplify
Data analytics is used to simplify complex problems that cannot be addressed before with such efficiency. Technologies like Hadoop and Spark allow users to implement Data Science techniques at scale. Collaborating across data science, line of business and IT teams on big data analytics projects increases efficiency and productivity for the entire organization.
Find Anomalies and Take Action
Data is generating at a staggering rate and analyzing a high volume of data thoroughly allows you to find anomalies and take action as per the scenarios. With the help of Data Analytics, users can summarize, filter data and gain insights and solve the anomalies before it becomes a big problem.
Operationalize, Monitor, Manage, and Trust
Data Analytics allows users to retrain, refresh, and automatically deploy new Analytics models at an edge to provide better and valid results.
Respond Fast and Correctly
It allows organizations to respond to events in a fraction of a second to ensure the right action is taken at right time. Employ microservices for edge scoring and modern serverless applications with a tiny footprint based on open source technology.
Top Use Cases for Data Analytics
Some of the most common use cases of Data Analytics are listed below:
- Detecting anomalies
- Managing customer data
- Managing risk
- Detecting fraud
- Personalizing and customizing
- Performing market research
- Analyzing operations
Data Analytics vs. Data Science
Both Data Analytics and Data Science are similar to each other. Data Analytics is a subpart of Data Science that is used to understand the organization’s data whereas Data Science takes the results of Data Analytics to study and solve problems.
Data Analytics vs. Business Analytics
Business Analytics is a subset of Data Analytics and it uses techniques of Data Analytics such as Data Mining, Statistical Analysis, and Modeling to make better data-driven decisions.
Data Analytics Guide: Careers in Data Analytics
Considering the demand of the industry, there are excellent opportunities to explore in a Data Analytics career. Every organization requires data literate professionals to churn their raw data into sensible business insights to assist in making data-driven decisions. Any aspirant who seeks to begin a career or switch to this field requires a wide range of skills.
To begin a career in this field, the three most important things to be kept in mind are — Understanding Domain Interest, Expertise in Data Analysis tools, and Connecting dots with smart decisions. More than 15 job roles are available in Data Analysis and are diversified according to the expertise one gradually gains. Data Analysts are valuable as there is a shortage of talent globally as more sectors and businesses are starting to implement Big Data Initiatives.
Conclusion
This Data Analytics Guide provides a comprehensive guide to Data Analytics. It also gives a brief overview of the types and processes involved in Data Analysis. Furthermore, in this Data Analytics Guide, we describe different tools and applications of Data Analysis in detail. Data Analytics plays a vital role in every segment to unearth Key Metrics hidden under the mass of information. The Data Analysis process tunnels raw data to bring the rays of insights to drive business objectives. Data Analysis forges the foundation of strategies and crucial steps for business growth and thus has huge potential for aspirants to begin a career and grow with the ever-changing technology landscape.
The first step in performing any kind of Data Analysis is integrating the data from various sources. However, most businesses today have an extremely high volume of data with a dynamic structure that is stored across numerous applications. Creating a Data Pipeline from scratch for such Data is a complex process since businesses will have to utilize a high amount of resources to develop it and then ensure that it can keep up with the increased Data Volume and Schema Variations. Businesses can instead use automated platforms like Hevo.
Hevo Data, a No-code Data Pipeline, helps you transfer data from a source of your choice in a fully automated and secure manner without having to write the code repeatedly. Hevo, with its strong integration with 150+ sources & BI tools, allows you to not only export & load Data but also transform & enrich your Data & make it analysis-ready in a jiff.
Want to take Hevo for a spin? Sign up here for the 14-day free trial and experience the feature-rich Hevo suite first hand. You can also have a look at our unbeatable pricing that will help you choose the right plan for your business needs!
Share with us your experience of learning about Data Analytics in this Data Analytics Guide. Tell us in the comments below!
Amit Kulkarni specializes in creating informative and engaging content on data science, leveraging his problem-solving and analytical thinking skills. He excels in delivering AI and automation solutions, developing generative chatbots, and providing data-driven AI & ML solutions. Amit holds a Master's degree and a Bachelor's degree in Electrical Engineering, consistently achieving distinction in his studies.